
 By
By What Is Open Interest In Options Trading?
Open interest is a very good indicator of the investor activity in a stock/index. In contrast to the daily volume whose increase or decrease is not directly correlated to the strength of the move, the open interest is a direct measure of the strength of the move in a market. To explain further, if a rally in the price of a stock is associated with an increase in open interest then you can be certain that new positions have been added or that there is a renewed interest in the stock/index. This is an indicator that can easily be used in Futures and Basics of options trading. Today let us try to build an Open Interest Trading Using Python to check some basic assumptions about what open interest indicates. This blog is an introduciton to option trading for dummies.
Where To Find Open Interest Data?
First, let us pull the data of a stock/index and verify the open interest from this open interest data. Let us pull the futures price of the stock SBI (State Bank of India) and check the trend in its price and open interest. It is common for a stock to increase its open interest when the contract becomes active or front month. Conversely, as the stock approaches expiry its open interest decreases. So, to check if the open interest of the futures is increasing or decreasing, we will have to take the combined open interest of the front and second-month futures contracts. This will give you the complete picture and avoid any abnormality during the contract rollover.
Options Trading Using Open Interest
In this blog, I will show you how to pull the futures data of the Jan contract, after it became the front month, and then we will pull the next month contract (Feb) information for the same time period and check for the combined open interest. I have used the package nsepy (Thanks to Swapnil Jariwala for sharing the code) to pull the data of NSE stocks.
Pull The Data
from nsepy import get_history
from datetime import date
import pandas as pd
import matplotlib.pyplot as plt

stock="SBIN"
start=start=date(2017,12,26)
end=date(2018,1,25)
end2=date(2018,2,5)
data_fut = get_history(symbol=stock,futures=True,start=start, end=end,
expiry_date=date(2018,1,25))
data_fut2 = get_history(symbol=stock,futures=True,start=start, end=end2,
expiry_date=date(2018,2,22))
Let us print and check both contracts’ data. 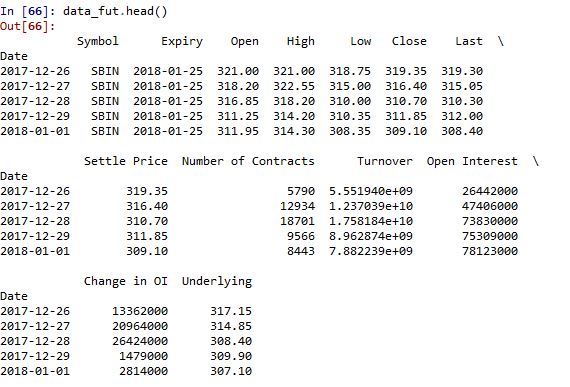
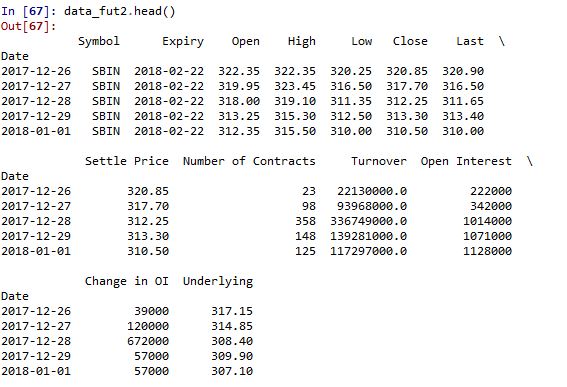 data_fut contains the futures data of Jan contract and data_fut2 contains the futures data of Feb contract. Now, let us combine the open interests of both the contracts and plot the change.
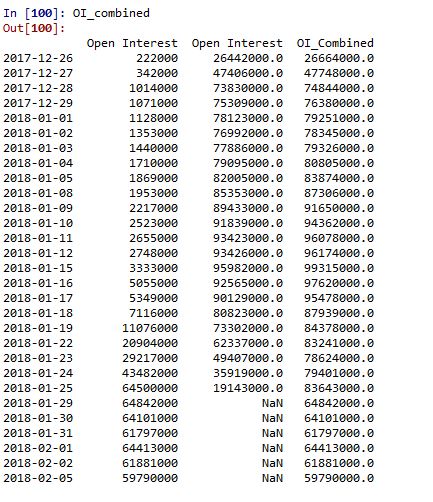
OI_combined= pd.concat([data_fut2['Open Interest'],data_fut['Open Interest']],
axis=1)
OI_combined['OI_Combined']=OI_combined.sum(axis=1)
Plot The Data
plt.figure(1,figsize=(10,9))
plt.subplot(211)
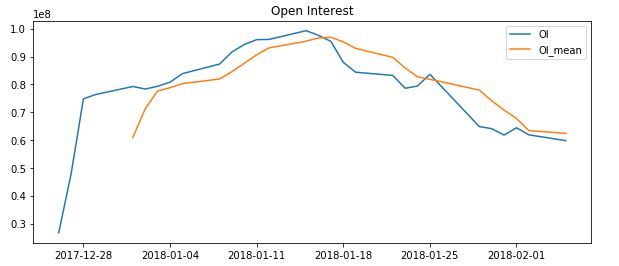
plt.title('Open Interest')
plt.plot(OI_combined.OI_Combined,label='OI')
plt.plot(OI_combined.OI_Combined.rolling(5).mean(),label='OI')
plt.legend(['OI','OI_mean'])
 Next, we make a continuous contract that rolls over after expiry and check the stock’s performance for the same time period.
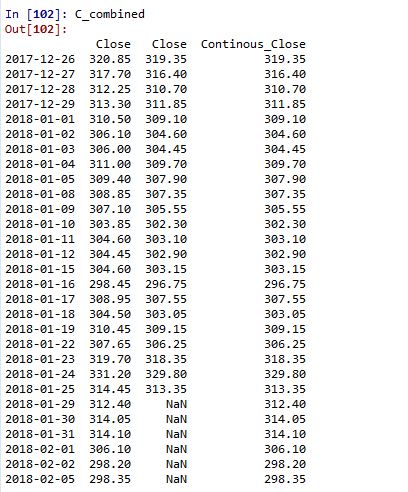
C_combined= pd.concat([data_fut2['Close'],data_fut['Close']],axis=1)
C_combined['Continous_Close']=C_combined.iloc[:,1].fillna(C_combined.iloc[:,0])
plt.subplot(212)
plt.title('Close')
plt.plot(C_combined.Continous_Close)
plt.plot(C_combined.Continous_Close.rolling(5).mean())
plt.legend(['Close','Close_mean'])
plt.show()
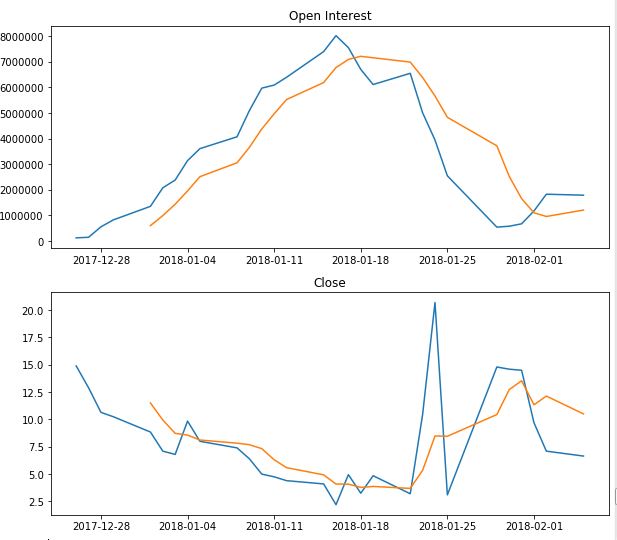
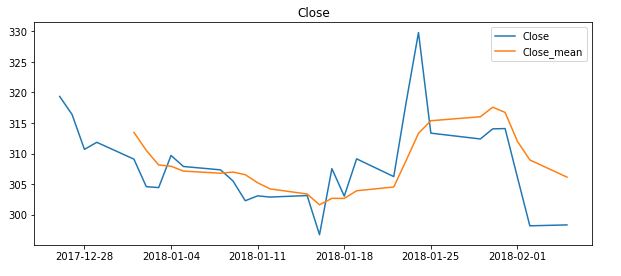 As you can see, I have combined both the futures contracts with the close prices of the Jan contract until its expiry and later with Feb’s contracts.
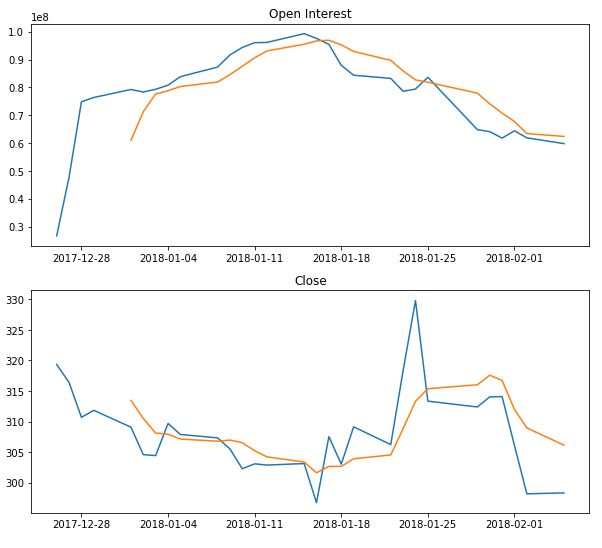
Analyse The Data
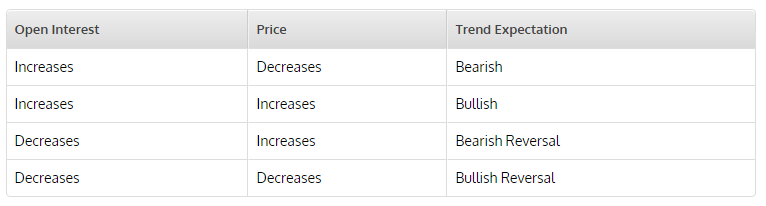
Now let us analyse how the stock traded and if there was an opportunity for us to trade in this combined Open Interest chart. First, let us put these two charts together then you can see that the combined OI (open interest) starts to decrease well before the expiry, but the price keeps increasing. This is generally considered a bearish signal, as it indicates the fact that either of the traders is winding up their positions or beginning to short, and hence the open interest is decreasing. This leaves us with a good shorting point just before the expiry, when the divergence increased significantly. I will leave you with a small but important table that will help in identifying the strength of a trend.
For the final confirmation let us pull the options data for the same stock with the same time period and verify.
data_fut = get_history(symbol=stock,start=start, end=end,option_type='CE',
strike_price=310, expiry_date=date(2018,1,25))
data_fut2 = get_history(symbol=stock,start=start, end=end2,option_type='CE',
strike_price=310,
expiry_date=date(2018,2,22))
OI_combined= pd.concat([data_fut2['Open Interest'],data_fut['Open Interest']],
axis=1)
plt.figure(1,figsize=(10,9))
plt.subplot(211)
plt.title('Open Interest')
plt.plot(OI_combined.sum(axis=1),label='OI')
plt.plot(OI_combined.sum(axis=1).rolling(5).mean())

C_combined= pd.concat([data_fut2['Close'],data_fut['Close']],axis=1)
C_combined['Continous_Close']=C_combined.iloc[:,1].fillna(C_combined.iloc[:,0])

plt.subplot(212)
plt.title('Close')
plt.plot(C_combined.Continous_Close,label='Close')
plt.plot(C_combined.Continous_Close.rolling(5).mean())
plt.show()
Conclusion
As you can see, the Open Interest of the options contract has also shown a significant reduction before the expiry. This further strengthens our belief that a correction is on the cards.
Modern trading demands a systematic approach and the need to steer yourself away from trading from the gut. This course on Systematic Options Trading by Quantra, helps you create, backtest, implement, live trade and analyse the performance of options strategy.
Disclaimer: All investments and trading in the stock market involve risk. Any decisions to place trades in the financial markets, including trading in stock or options or other financial instruments is a personal decision that should only be made after thorough research, including a personal risk and financial assessment and the engagement of professional assistance to the extent you believe necessary. The trading strategies or related information mentioned in this article is for informational purposes only.
Download Data File
- Open Interest Trading Python Code

