Form 4 looks unusually convenient for quantitative research. It is public, structured and tied to a regulatory deadline: in general, a reporting person must file by the end of the second business day after a reportable transaction. The SEC's Form 4 instructions state the rule and also show why a filing is more complicated than “one insider, one trade.” A filing can contain many transaction rows, and multiple beneficial owners may file jointly.
This article builds a filing-date event study of C-suite code-P purchase filings submitted from January 1, 2022 through June 30, 2026. The raw SEC files contain 1,345,036 non-derivative transaction rows. The filing-only funnel reduces those to 11,957 component events. Price coverage, fill-price validation and issuer-day aggregation then produce 7,406 public signals, of which 7,405 have a scoreable next-session return.
The short version of the result is deliberately modest. The primary SPY-adjusted mean cumulative abnormal return (CAR) is +0.534% for the next session and +1.009% over five sessions. Their issuer-and-entry-month two-way clustered t-statistics are 6.460 and 5.053. At 21 and 63 sessions, however, the adjusted CAR confidence intervals include zero; adjusted buy-and-hold abnormal return (BHAR) does too. A fitted market model produces larger estimates, but I treat that as sensitivity rather than the headline. Nothing here estimates causal impact, trading costs, portfolio returns or a deployable strategy.
This blog covers:
- Why purchases are worth testing—and what this sample is not
- Form 4 anatomy without the usual shortcuts
- Loading the SEC research files
- Two aggregation levels: components first, public signals second
- The filing funnel
- Price acquisition and corporate-action QA
- Event-study design
- Primary results: short-horizon association, uncertain drift
- Transaction-date lookahead and exact-common curves
- What the matched placebo does—and does not show
- Subgroups: estimate contrasts, not separate t-statistics
- Liquidity is a limitation, not a backtested capacity result
- Reproducibility and limitations checklist
- Frequently Asked Questions
Why purchases are worth testing—and what this sample is not
Earlier research provides a reason to study insider purchases, but it does not let us assume that every code-P filing is informative. Lakonishok and Lee (2001) found that purchase activity was more informative than sales in their 1975–1995 sample and that the result was concentrated in smaller firms. Jeng, Metrick and Zeckhauser (2003) estimated returns earned by insiders themselves and found positive abnormal performance after purchases; that estimand is not the same as an outside investor's post-filing return.
Cohen, Malloy and Pomorski (2012) make another important distinction. Their “opportunistic” category is the complement of a specific routine-trader classifier built from several years of each person's history. This article does not reproduce that classifier. Excluding transactions affirmatively marked as Rule 10b5-1 plan trades does not make everything remaining “opportunistic,” discretionary or information-driven. I therefore use the literal label “not affirmatively flagged as a 10b5-1 plan trade.”
The design is observational. An officer may buy after a price decline, alongside earnings news, during a financing or for reasons invisible in the structured fields. Without a credible counterfactual for the filing event, post-filing returns are associations, not the causal effect of disclosure or proof of private information.
Form 4 anatomy without the usual shortcuts
Section 16 reporting covers officers, directors and beneficial owners of more than 10% of a registered equity class. A Form 4 reports changes in beneficial ownership. The non-derivative table can contain common stock, preferred stock, depositary interests or other instruments; derivative transactions occupy a separate table.
The transaction code is essential. The SEC's ownership-code definitions describe P and S as open-market or private transactions. The code alone does not identify the venue.
Code | SEC meaning, abbreviated | Treatment here |
P | Open-market or private purchase | Keep only acquired non-derivative common/ordinary shares; venue remains unknown |
S | Open-market or private sale | Exclude |
A | Grant, award or other acquisition under Rule 16b-3(d) | Exclude |
M | Exercise or conversion of a derivative security | Exclude |
F | Securities delivered or withheld for exercise price or tax liability | Exclude |
G | Bona fide gift | Exclude |
C, D, J, X and others | Conversions, issuer dispositions, “other” transactions, exercises, etc. | Exclude from this purchase study |
Calling every P row an “open-market buy” would therefore be wrong. A legitimate private purchase can occur away from the exchange close. That matters later: a fill-to-close anchor is a data-quality screen, not a determination that the filing itself is erroneous.
Joint filings are another trap. The Form 4 instructions explicitly allow beneficial owners to report the same transaction individually or jointly. In the SEC's flattened research tables, transaction rows do not carry a reporting-owner foreign key. Assigning every transaction row to one owner on a joint filing would invent attribution. The primary construction here drops all multi-owner filings: 7,479 joint accessions and 19,690 candidate transaction rows at that stage. That is conservative, but it changes the population being studied.
The Rule 10b5-1 timing detail
The SEC amended Forms 4 and 5 to add a checkbox for transactions under a contract, instruction or written plan intended to satisfy Rule 10b5-1(c). Section 16 filers had to comply for beneficial-ownership reports filed on or after April 1, 2023, according to the SEC compliance guide.
That date is more precise than saying “the field starts in 2023Q2.” The SEC's downloadable files have also been revised: the Insider Transactions Data Sets page notes that the 2023–2025 sets were updated in July 2025 to include AFF10B5ONE in SUBMISSION. The study normalizes affirmative values such as 1 and true and removes them. Before the compliance date, missing or false does not establish that no plan existed; even afterward, the study only knows what was marked in the structured filing.
Loading the SEC research files
The SEC publishes quarterly ZIP archives with flattened tables extracted from Forms 3, 4 and 5. SUBMISSION.tsv carries filing and issuer fields, including the plan checkbox where available; REPORTINGOWNER.tsv carries owner identity and relationship fields; NONDERIV_TRANS.tsv carries transaction rows. The SEC documentation also warns that the files are as-filed data and are not a substitute for the source filings.
A minimal loader should tolerate schema changes without pretending that a missing field is a negative observation:
The study downloads 18 quarters, 2022Q1 through 2026Q2. It excludes every Form 4/A rather than claiming to resolve supersession. That prevents obvious double counting, but later corrections are ignored and same-day amendment order cannot be inferred from a calendar date alone. A production-quality history should chain originals and amendments using acceptance timestamps and the source filings.
Two aggregation levels: components first, public signals second
The raw transaction row is too narrow. One purchase can be reported as several price tranches. The whole filing is too broad: it can contain different transaction dates, ownership forms or security classes.
The first aggregation level is therefore one:
accession × issuer CIK × reporting-owner CIK × transaction date × direct/indirect ownership × normalized security class.
Within that key, shares and dollar value are summed and the fill price becomes a value-weighted average:
The second level matches the statistical observation. All validated components for the same issuer CIK and public filing date collapse to one issuer × filing-calendar-day signal, even if several owners or accessions became public that day. That avoids overweighting a coordinated issuer-day simply because it generated multiple filings.
The persisted invariant is one unique signal_id = ISSUERCIK:filing_date. The headline sample is never described as “one filing” or “one insider,” because neither is true after this aggregation.
The filing funnel
The following counts come directly from data/funnel2.csv. They are cumulative. The unit is a transaction row until the explicit component-event aggregation line, after which it is an event. This distinction prevents a polished table from quietly mixing denominators.
Cumulative filter | Rows/events surviving |
Non-derivative transaction rows, all forms | 1,345,036 |
On an original Form 4; 4/A excluded, not supersession-resolved | 1,312,250 |
Code-P purchases, acquired | 114,505 |
Not affirmatively flagged as an equity-swap transaction | 114,491 |
Positive shares and a reported price | 110,492 |
Security title is common/ordinary stock | 105,214 |
Transaction date sane; filing on/after it, lag ≤ 1 year | 103,766 |
Owner attributable under the single-owner policy; all joint filings dropped | 84,076 |
Filed by an officer | 39,483 |
Conservative issuer-level core/president/chair role | 30,004 |
Not affirmatively flagged as a Rule 10b5-1 plan trade | 28,957 |
One component event per filing × insider × day × ownership form × class | 20,760 |
Component-event value ≥ $10,000; no cross-day summing | 12,422 |
Usable ticker symbol printed on the filing | 11,966 |
Exact cross-accession economic repeats removed | 11,957 |
Of those component events: public-time cluster label true | 2,731 |
The role filter is intentionally narrower than “all officers.” CEO, CFO and COO variants are included before testing president/chair wording, because titles such as “EVP and CFO” must not disappear merely because they contain “VP.” Divisional and deputy presidents are screened out. The result is a researcher-defined C-suite sample, not a legal category.
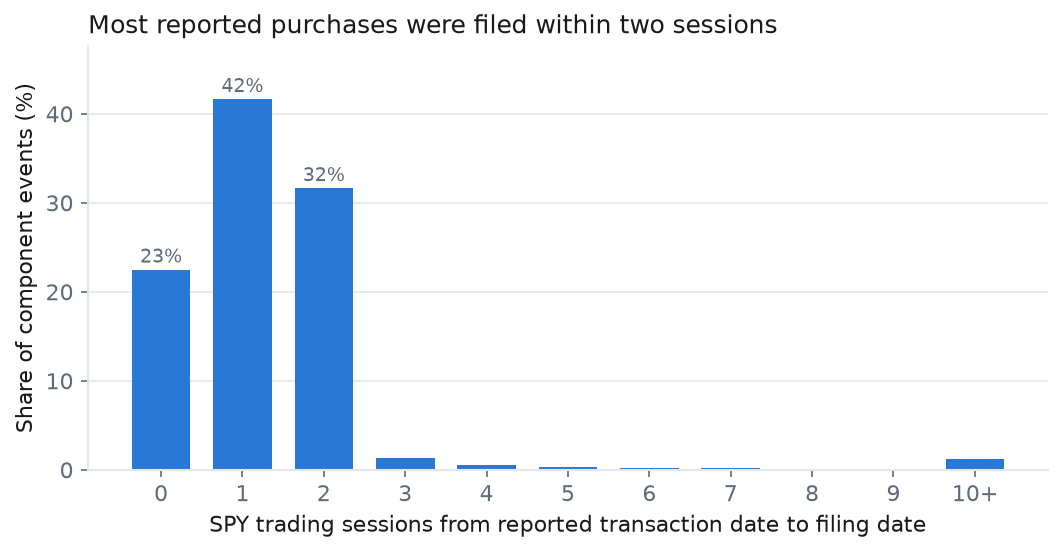
The lag distribution uses the final 11,957 component events and the SPY trading calendar as a reproducible proxy for business days. The median is one session, 95.8% have a lag of two sessions or less, and the 99th percentile is 13. It is descriptive, not a legal finding about filing timeliness; the federal business-day calendar and filing acceptance time are not in the event file.
Derived labels do not change the primary sample
Two descriptive labels are built before price filtering, using only SEC-public metadata available by each filing date:
- Cluster: another reporting owner at the same issuer has a qualifying transaction within ten calendar days, and that partner filing is already public by the current filing date.
- First observed: the owner's first qualifying issuer-level filing day since the sample begins in 2022Q1. Simultaneous same-day filings are batched, so they do not create artificial prior history for each other.
“First observed” is left-truncated. It does not mean the person's first purchase ever, first purchase as an insider or even first purchase in a longer history. Both labels are used only for exploratory contrasts; neither defines the headline result.
Price acquisition and corporate-action QA
The price layer uses daily Yahoo data acquired through yfinance. That is convenient research input, not a point-in-time security master. Tickers are taken from free-text filing symbols and mapped to the symbols Yahoo serves now. Delisted securities, historical ticker changes, reused symbols and classes can be missing or misjoined.
The coverage drop is material:
Price/study stage | Components or signals |
Filing-only component events | 11,957 |
Components with a Yahoo price column | 10,069 |
Components passing the nominal fill-price anchor | 9,718 |
Issuer × filing-day signals after aggregation | 7,406 |
Signals with a scoreable next-session outcome | 7,405 |
Signals with a complete 63-session outcome | 7,048 |
Exact-common 63-session curve and placebo sample | 6,901 |
The 1,888 components without a price column are not missing at random. Dead, delisted, renamed, very small and otherwise difficult securities are plausible members of that group. The resulting estimand is explicitly conditional on Yahoo coverage; the study does not claim a point-in-time universe or survivorship-free sample.
Do not assume “raw Close” means untouched nominal history
It is unsafe to make a blanket claim that Yahoo always adjusts—or never adjusts—the field labelled Close. The local files show mixed behavior around recorded stock actions. The code compares raw and adjusted gross returns around each recorded action and classifies the interval rather than trusting the column name.
Among 705 recorded actions in the downloaded ledger, 631 look already adjusted in the relevant price history, five look like visible nominal jumps that can be repaired, 66 are ambiguous and three lack a usable local interval. Historical nominal closes for the fill-price anchor are reconstructed only where the observed action classification supports it. This reconstruction uses a subsequently observed action ledger, so sample validation is not fully point-in-time even though the filing-derived metadata is.
The recorded ledger can itself be incomplete. The study identifies 1,454 unresolved action-like local intervals:
- 852 raw 3×–10× discontinuities are flagged but retained;
- 536 unrecorded raw jumps above 10× are invalidated;
- 66 ambiguous recorded-action intervals are invalidated.
That makes 602 invalidated local intervals. The exclusion is event-local: only an outcome horizon that crosses an invalid interval becomes missing. It does not erase the ticker's entire history. This is preferable to declaring a whole issuer “clean,” but the missing outcome can still be non-random—an MNAR limitation—because extreme action-like intervals may correlate with distress and future returns.
The fill-price anchor
Each component's reported VWAP is compared with the reconstructed nominal close near its transaction date. The accepted band is 0.5×–2.0×, not an assertion that the trade occurred on an exchange. Of 10,069 covered components, 351 fail because the close is missing, the symbol maps to multiple issuer CIKs or the ratio lies outside the band. Ten current Yahoo symbols map to multiple issuer CIKs in the filing sample and are treated as ambiguous.
This screen catches obvious unit errors and some wrong-ticker joins. It can also exclude legitimate private purchases, different listed bases, ADS ratios or other security-class mismatches. Only passing components are aggregated into the issuer-day signal, so signal_value is the sum of validated components, not necessarily every reported purchase on that day.
Event-study design
The entry date is the first SPY trading session strictly after filing_date. The component file does not contain SEC acceptance timestamps, so the study cannot distinguish a filing accepted before the open from one accepted after the close. Next-session open is a conservative daily-bar convention, but it is not a claim that the filing was first observable at that moment.
Session 1 uses the stock's open-to-close return and SPY's open-to-close return. Later sessions use close-to-close returns. Primary abnormal returns are:
CAR is additive; BHAR preserves compounding and is the more direct long-horizon buy-and-hold comparison. Both are primary.
The market-model sensitivity estimates stock_return = alpha + beta × SPY_return + error over sessions [-160, -21) relative to entry, requiring at least 60 valid observations. Its CAR sums stock_return - (alpha + beta × SPY_return). Market-model availability never gates the primary adjusted estimators, which is why its N is slightly smaller.
Exact inference used in the tables
An issuer can appear repeatedly, and many issuers share the same market month. Treating 7,405 signal rows as independent would overstate precision. Every reported t-statistic and 95% confidence interval below comes from the persisted Cameron–Gelbach–Miller two-way clustered covariance, clustered by:
- issuer CIK; and
- entry calendar month.
The implementation adds the issuer and month cluster “meats” and subtracts their intersection, with finite-cluster corrections. Two-sided p-values and 95% intervals use a Student t reference with min(number of issuers, number of months) - 1 degrees of freedom. Day 1 has 2,004 issuer clusters and 55 month clusters; the 63-session primary sample has 1,918 issuers and 53 months. See Cameron, Gelbach and Miller (2011) for the estimator.
These are nominal intervals. They are not adjusted for testing several horizons and estimators.
Primary results: short-horizon association, uncertain drift
The results in this and the following sections are provided for educational purposes only. They are not investment advice, and nothing in this article guarantees any future performance.
Measure | N | Mean | Winsorized 1% mean | Median | Two-way t | Two-way 95% CI | Two-sided p |
Adjusted CAR, 1 session | 7,405 | +0.534% | +0.434% | +0.109% | 6.460 | [+0.368%, +0.700%] | <0.0001 |
Adjusted CAR, 5 sessions | 7,404 | +1.009% | +0.845% | +0.203% | 5.053 | [+0.608%, +1.409%] | <0.0001 |
Adjusted CAR, 21 sessions | 7,397 | +0.980% | +0.716% | -0.295% | 1.678 | [-0.191%, +2.151%] | 0.0991 |
Adjusted BHAR, 21 sessions | 7,397 | +0.814% | +0.303% | -1.009% | 1.332 | [-0.411%, +2.039%] | 0.1885 |
Adjusted CAR, 63 sessions | 7,048 | +1.103% | +0.718% | -0.648% | 1.194 | [-0.751%, +2.956%] | 0.2380 |
Adjusted BHAR, 63 sessions | 7,048 | +0.104% | -0.967% | -3.605% | 0.105 | [-1.890%, +2.099%] | 0.9167 |
The one- and five-session mean adjusted CARs are distinguishable from zero under this two-way covariance. They are not “returns from a strategy”: there is no transaction-cost model, no portfolio weighting, no execution test and no control for concurrent news.
The longer-horizon language must be weaker. At 21 sessions the adjusted CAR point estimate is +0.980%, but its interval runs from -0.191% to +2.151%. At 63 sessions adjusted CAR is +1.103% with an interval from -0.751% to +2.956%. BHAR is less favorable, especially in the tail-robust summaries: the 63-session raw mean is +0.104%, while the 1%-winsorized mean is -0.967% and the median is -3.605%. The study does not establish persistent 21- or 63-session drift under the primary estimators.
Why the market-model sensitivity is larger
Market-model sensitivity | N | Mean | Two-way t | Two-way 95% CI |
CAR, 1 session | 7,156 | +0.658% | 7.285 | [+0.477%, +0.840%] |
CAR, 5 sessions | 7,155 | +1.493% | 6.545 | [+1.036%, +1.950%] |
CAR, 21 sessions | 7,148 | +3.063% | 4.640 | [+1.740%, +4.387%] |
CAR, 63 sessions | 6,817 | +6.560% | 5.271 | [+4.063%, +9.057%] |
The pre-event fitted alpha averages -0.085% per session, and 65.2% of fitted alphas are negative. Subtracting a negative daily alpha mechanically lifts cumulative market-model residuals as the horizon grows. That does not make the market model wrong, but it makes the specification choice economically decisive. Reporting only +6.560% at 63 sessions would hide the primary adjusted CAR of +1.103% and adjusted BHAR of +0.104%.
Transaction-date lookahead and exact-common curves
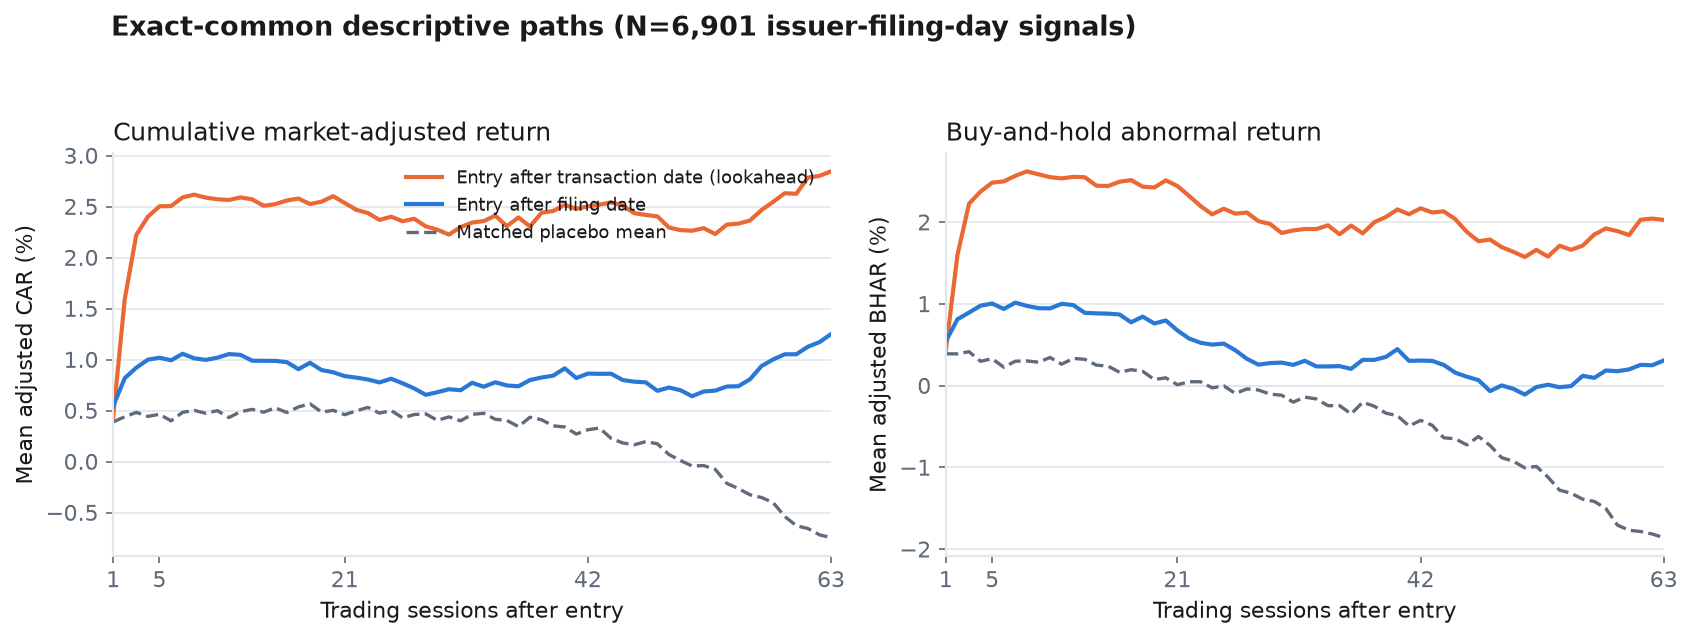
A transaction-date entry uses information that was not yet public. Comparing it with filing-date entry quantifies the lookahead embedded in many insider studies. Each row below uses the strict common sample available for that horizon, and the difference is filing-date minus transaction-date entry with the same two-way covariance.
Primary metric | N common | Filing-date entry | Transaction-date entry | Difference | Two-way 95% CI for difference |
Adjusted CAR, 1 session | 7,228 | +0.553% | +0.425% | +0.128 pp | [-0.033, +0.289] pp |
Adjusted CAR, 5 sessions | 7,227 | +1.047% | +2.572% | -1.525 pp | [-1.768, -1.281] pp |
Adjusted CAR, 21 sessions | 7,220 | +0.993% | +2.714% | -1.721 pp | [-2.007, -1.436] pp |
Adjusted BHAR, 21 sessions | 7,220 | +0.832% | +2.617% | -1.786 pp | [-2.121, -1.451] pp |
Adjusted CAR, 63 sessions | 6,901 | +1.250% | +2.845% | -1.595 pp | [-1.874, -1.316] pp |
Adjusted BHAR, 63 sessions | 6,901 | +0.308% | +2.027% | -1.719 pp | [-2.088, -1.351] pp |
The long-horizon transaction-date paths are higher because their windows begin earlier and include pre-publication returns. This comparison diagnoses timestamp lookahead; it does not establish that the filing caused the difference.
What the matched placebo does—and does not show
For 7,228 real signals, the study builds same-ticker candidate dates outside a ±63-session blackout around real entries. Candidates are matched on trailing stock momentum and volatility, market momentum and volatility, beta and alpha. A fixed seed draws 200 placebo panels. The design holds ticker composition roughly fixed while asking whether similarly situated dates look different.
The paired, two-way-clustered honest-minus-placebo contrasts remain imprecise under the primary estimators:
Metric | N common | Honest | Mean placebo | Honest minus placebo | Two-way 95% CI | p |
Adjusted CAR, 21 sessions | 7,220 | +0.993% | +0.452% | +0.541 pp | [-1.037, +2.119] pp | 0.4947 |
Adjusted BHAR, 21 sessions | 7,220 | +0.832% | +0.004% | +0.828 pp | [-0.676, +2.332] pp | 0.2746 |
Adjusted CAR, 63 sessions | 6,901 | +1.250% | -0.746% | +1.996 pp | [-0.448, +4.439] pp | 0.1073 |
Adjusted BHAR, 63 sessions | 6,901 | +0.308% | -1.859% | +2.167 pp | [-0.241, +4.575] pp | 0.0768 |
Therefore the placebo does not “confirm that filing timing carries the return.” A panel-level upper-tail count for 63-session BHAR is smaller, 5/201 = 0.0249, but it answers a different empirical-randomization question and does not account for issuer and month dependence in the same way. The paired two-way contrast is the conservative basis for the article's claim.
Subgroups: estimate contrasts, not separate t-statistics
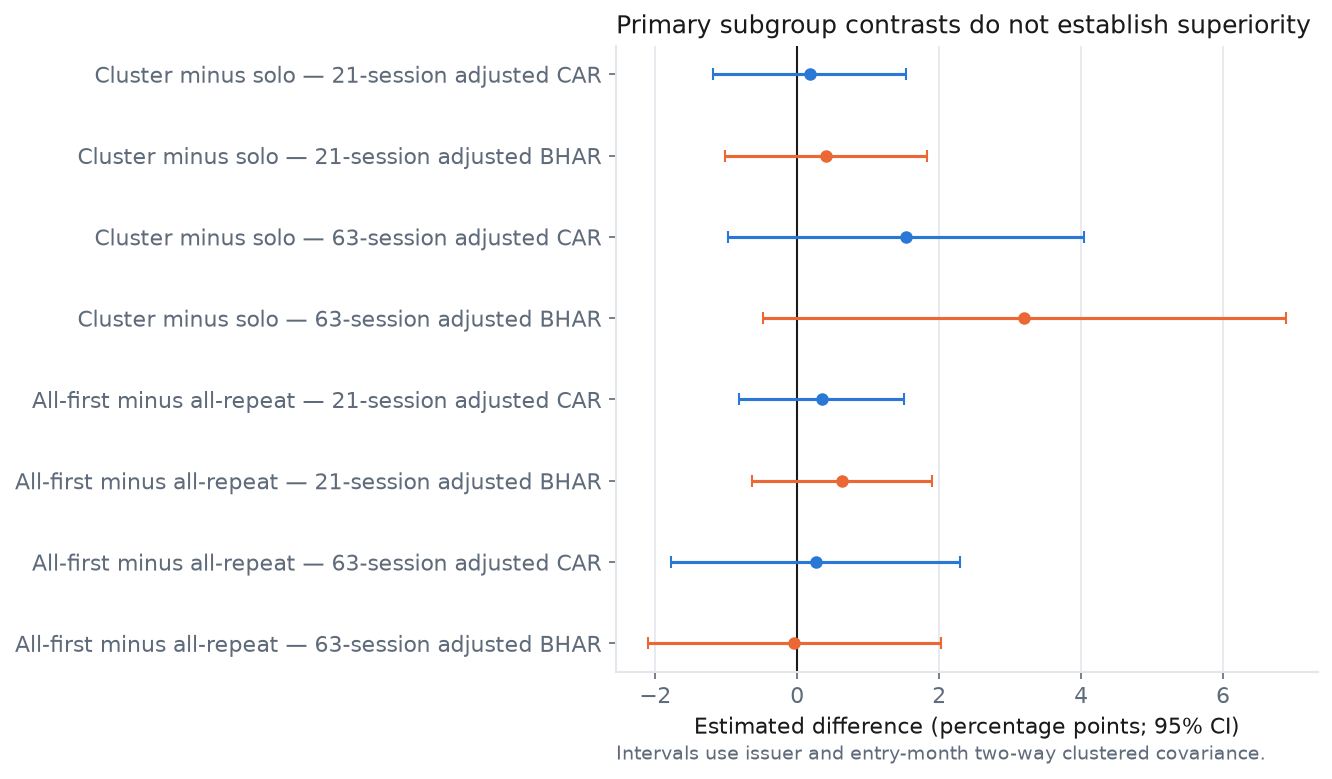
A significant mean within a subgroup does not show that it beats its complement. The correct claim requires a direct difference. Every primary cluster-minus-solo and all-first-minus-all-repeat interval crosses zero:
Direct primary contrast | Estimate | Two-way 95% CI |
Cluster minus solo, 21-session adjusted CAR | +0.175 pp | [-1.184, +1.535] pp |
Cluster minus solo, 21-session adjusted BHAR | +0.406 pp | [-1.022, +1.833] pp |
Cluster minus solo, 63-session adjusted CAR | +1.528 pp | [-0.981, +4.038] pp |
Cluster minus solo, 63-session adjusted BHAR | +3.200 pp | [-0.484, +6.885] pp |
All-first minus all-repeat, 21-session adjusted CAR | +0.344 pp | [-0.817, +1.505] pp |
All-first minus all-repeat, 21-session adjusted BHAR | +0.629 pp | [-0.640, +1.899] pp |
All-first minus all-repeat, 63-session adjusted CAR | +0.260 pp | [-1.774, +2.293] pp |
All-first minus all-repeat, 63-session adjusted BHAR | -0.041 pp | [-2.103, +2.021] pp |
The market-model sensitivity gives positive first-minus-repeat contrasts at 21 and 63 sessions, but the primary adjusted CAR/BHAR results do not. Combined with left truncation and multiple exploratory tests, that is not enough to claim subgroup superiority.
Liquidity is a limitation, not a backtested capacity result
For 7,108 signals with valid trailing dollar volume, aggregate insider purchase value is compared with the pre-entry median positive daily dollar volume. The median ratio is 5.08%; 37.52% exceed 10%, 23.82% exceed 25%, and 9.58% exceed 100%.
This is the insider's disclosed purchase footprint, not the size of a hypothetical strategy order and not a capacity estimate. The study has no quote data, spread model, participation rule, market-impact model or portfolio capital allocation. The ratios simply warn that many events occur in securities where execution assumptions would matter.
Reproducibility and limitations checklist
The companion code, tests, frozen result artifacts and the executed notebook are published at github.com/makeev/form4-event-study (release v1.0.0); the notebook also opens directly in Colab. The final run writes a manifest containing the event-study script hash, input-file SHA-256 checksums, seed, horizon settings, anchor band, placebo count and estimand. That prevents “final” tables from drifting away from the exact price snapshot that produced them. A publication package should include the code, the manifest and the small result tables; the large acquired price matrices may need documented download instructions because redistribution terms can differ.
Before interpreting the estimates, keep the following limitations together rather than scattering them across footnotes:
- No causal identification. The design conditions on purchases and does not isolate the disclosure from concurrent information or the reasons insiders chose to buy.
- No strategy or net-return claim. There is no portfolio construction, turnover, spread, slippage, market impact, tax or short-sale model.
- Not a point-in-time universe. Filing-derived labels use public dates, but Yahoo coverage, current ticker mapping and future-observed action data affect sample inclusion and validation.
- Coverage may be MNAR. Missing Yahoo histories and horizon-local exclusions around unresolved action-like intervals can correlate with distress, delisting and extreme outcomes.
- Ticker identity is weak. Form 4 symbols are free text; historical ticker changes and ticker reuse require a point-in-time CIK-to-security master for a stronger study.
- Corporate-action records are incomplete. Raw 3×–10× discontinuities are retained but flagged, while >10× and ambiguous intervals are locally invalidated. Both choices can leave bias.
- The anchor changes the population. A 0.5×–2.0× fill-to-close band can remove typos and wrong joins, but also legitimate private transactions, ADS ratios and class-basis differences.
- Original filings only. Form 4/A amendments are dropped, not supersession-resolved, so corrected economic values are not incorporated.
- No acceptance timestamps. Filing calendar date and next-session open replace the actual public acceptance time.
- First-observed is left-truncated. History begins in 2022Q1 and cannot support a claim about an insider's first-ever purchase.
- Multiple testing. Reported intervals are nominal and do not adjust for the number of horizons, estimators, placebo summaries or subgroup contrasts inspected.
These limits are not boilerplate. They define the population and the question the numbers can answer: among scoreable, Yahoo-covered issuer-filing-day signals that pass the event-local validation rules, what post-filing abnormal returns are observed?
Frequently Asked Questions
Q: What is an SEC Form 4 event study?
An SEC Form 4 event study measures abnormal stock returns in the trading sessions following a public insider-purchase filing. Corporate insiders must disclose changes in beneficial ownership within two business days of a transaction. By anchoring analysis to the filing date rather than the transaction date, a practitioner studies only information that was publicly available to outside investors at the time of signal generation.
Q: What does SEC Form 4 tell you about an insider purchase?
A: Form 4 discloses that a corporate officer or director changed their beneficial ownership. A transaction coded "P" means an open-market or private purchase of a non-derivative security. The filing does not identify the trading venue, and a single filing can contain multiple price tranches, multiple owners, or transactions from different dates.
Q: Why use the filing date as the entry point rather than the transaction date?
A: The transaction date precedes the filing and was not yet public information at that moment. A filing-date study enters at the next trading session after disclosure, which is the earliest point an outside investor could have acted on the information. Using the transaction date embeds lookahead bias that can substantially overstate returns at longer horizons.
Q: What is cumulative abnormal return (CAR) in an event study?
A: CAR is the sum of daily excess returns over a defined window after an event. In this study, excess return is stock return minus SPY return for that session. A positive mean CAR across thousands of events means the average signal-day stock outperformed SPY over that window.
Q: Can this analysis be replicated without a paid data subscription?
A: Yes. The study uses SEC quarterly ZIP files, which are free from EDGAR, and daily prices from yfinance, which is free and Yahoo-sourced. The data files are approximately 100 MB each. The README in the companion repository walks through the download steps once, and the notebook runs the full pipeline from there.
Q: What Python libraries are needed to run this event study?
A: The core requirements are pandas, zipfile, and pathlib for data loading and aggregation, plus standard libraries for statistical inference. The full dependency list and installation instructions are in the companion repository at github.com/makeev/form4-event-study (release v1.0.0).
Conclusion
The final evidence supports a narrow statement. In this selected sample of filings submitted during 2022Q1–2026Q2, C-suite code-P purchase filing days are associated with a positive average SPY-adjusted return over the next one and five sessions. The exact estimates are +0.534% and +1.009%, with issuer-and-entry-month two-way clustered t-statistics of 6.460 and 5.053.
It does not establish a durable one- or three-month effect under the primary estimators. The 21- and 63-session adjusted CAR and BHAR intervals include zero, the 63-session BHAR median is negative, matched-placebo contrasts remain imprecise, and no primary subgroup contrast establishes superiority. Market-model results are larger, but their dependence on negative pre-event alpha is precisely why they remain sensitivity checks.
The transferable lesson is methodological. Preserve filing time, aggregate to the economic and statistical unit separately, never infer trade venue from code P, treat corporate-action data as evidence rather than truth, cluster inference along the dependence dimensions and publish the funnel that defines the estimand. That work is less exciting than a backtest headline, but it is what keeps a public-data event study interpretable.
References and direct sources
- A. Colin Cameron, Jonah B. Gelbach and Douglas L. Miller (2011), “Robust Inference With Multiway Clustering,” DOI 10.1198/jbes.2010.07136.
- Lauren Cohen, Christopher Malloy and Lukasz Pomorski (2012), “Decoding Inside Information,” DOI 10.1111/j.1540-6261.2012.01740.x.
- Leslie A. Jeng, Andrew Metrick and Richard Zeckhauser (2003), “Estimating the Returns to Insider Trading: A Performance-Evaluation Perspective,” DOI 10.1162/003465303765299936.
- Josef Lakonishok and Inmoo Lee (2001), “Are Insider Trades Informative?” DOI 10.1093/rfs/14.1.79.
- U.S. Securities and Exchange Commission, Form 4 and general instructions.
- U.S. Securities and Exchange Commission, Insider Transactions Data Sets and dataset documentation.
- U.S. Securities and Exchange Commission, ownership transaction-code definitions.
- U.S. Securities and Exchange Commission, Rule 10b5-1 amendments compliance guide.
- U.S. Securities and Exchange Commission, EDGAR automated-search rate control.
- yfinance project, source and documentation. Yahoo-sourced data are used as a research convenience, subject to their source terms and the limitations above.
About the author

Mikhail Makeev is the founder of AlphaAI, where he works on financial-news and SEC-filing data pipelines. He is based in Varna, Bulgaria. His interests include alternative data, event-driven research and reliable financial-data engineering.
Author's Disclosure: I am Mikhail Makeev, founder of AlphaAI (alphai.io), a financial-news API that parses SEC filings. That work motivated this research. The study uses free SEC filings and Yahoo-sourced daily prices; it does not call or link to my product. All return estimates in this article are for educational and research illustration purposes only. They do not constitute investment advice and do not reflect the returns of any trading strategy.
Disclaimer: The views, opinions, and information provided within this guest post are those of the author alone and do not represent those of QuantInsti®. The accuracy, completeness, and validity of any statements made or the links shared within this article are not guaranteed. We accept no liability for any errors, omissions or representations. Any liability with regards to infringement of intellectual property rights remains with them.