Quants and technical analysts are the two sides of the same coin. Since both technical analysts and quants work for the algorithmic trading practice, they are interconnected yet perform individually. By finding out how each works individually, you can better learn the importance of each and how the fusion can be useful.
This blog covers:
- What are the similarities and the differences between Quants and Technical Analysts?
- Combination of Quants and Technical Analysts and benefits when together
- How to differentiate between the educational requirements of Quants and Technical Analysts?
What are the similarities and the differences between Quants and Technical Analysts?
When we find out the similarities while comparing the two roles, it is much easier to filter out what sets them apart. With the different roles come different responsibilities as well.
Similarities in Quants and Technical Analysts
|
Quants and Technical Analysts |
|
Employed for the algorithmic trading domain |
|
Use technical indicators such as trend lines, moving averages, mean reversion |
|
Look at the past behaviour of the market |
|
Help in creating a trading strategy with an entry and an exit signal, and a position sizing algorithm |
Differences between Quants and Technical Analysts
|
Quants |
Technical Analysts |
|
More than predicting the market’s behaviour in future, quants focus on creating a trading strategy |
Technical analysts focus on predicting the market’s behaviour in the future with the help of historic market data |
|
Quants use a degree in mathematics, statistics and finance |
A certified financial technician, certified market technician or a similar degree in finance is required |
|
Quants give Sharpe ratio, expected risk, expected return and other such statistics for a particular algorithm or strategy. All of these metrics are outputs of a well-structured backtesting process, the course on backtesting trading strategies python covers how to compute and interpret each of these performance statistics with hands-on Python code. |
A technical analyst gives a buy or sell signal in the market on the basis of a similar past situation |
|
Along with the technical indicators/tools such as moving averages, oscillators, trend lines, etc., quants also use machine learning, neural networks and statistical tools such as Sharpe ratio etc. |
Technical analysts make use of technical indicators and preconceived opinions based on past performances of the market |
Example of Technical Analysis
I have taken a graphical representation of the values/outcome of stochastic indicator for giving a simple example below:
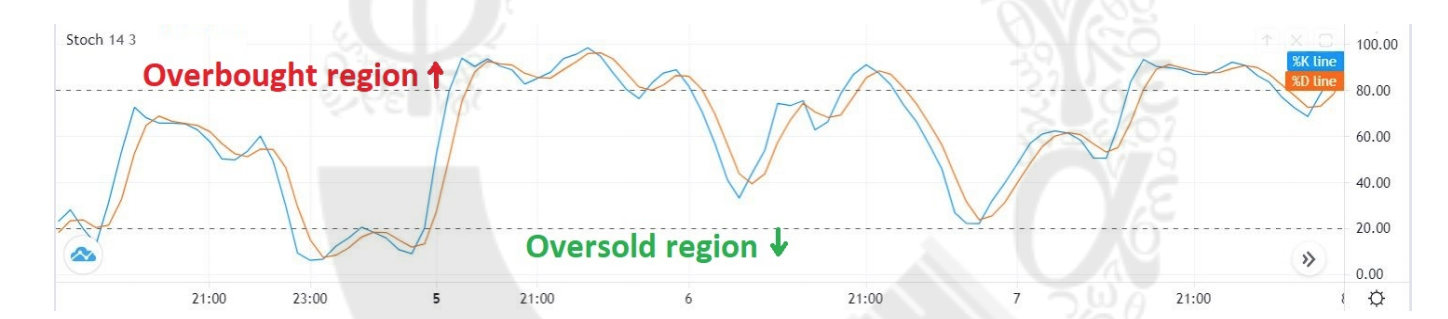
In the image above, %K (Stochastic indicator value) line is shown on the graph moving from left to right. This %K is represented by blue line and shows the proportion of the difference in the close and the low price to the difference between the high and the low price in the past 14 periods. When %K goes above 80, it is an overbought situation and when %K goes below 20, it is an oversold situation.
Similarly, %D is smoothed stochastic indicator value which also generates buy and sell signals. To learn more about stochastic oscillator, you can enrol in our course on Python For Trading!
Example of Quantitative Analysis
An example of quantitative analysis is the Sharpe ratio for the trading strategy created after using the technical indicator.
In this case, we can say that after using a stochastic oscillator and seeing overbought and oversold situations, the quant will create a trading strategy on the basis of the Sharpe ratio. The Sharpe ratio measures the excess return per unit of standard deviation in an investment asset or a trading strategy.
- High Sharpe ratio - More returns per unit risk
- Low Sharpe ratio - More returns per unit risk
Sharpe ratio’s equation: Sharpe ratio = (Rp - Rf) / σ
Where,
Rp= Mean portfolio return
Rf= Risk-Free rate
σ= Portfolio’s standard deviation
Suppose you expect that your portfolio has an annualized return of 12%. If risk-free rate is 7% and your portfolio carries an 8% standard deviation. The Sharpe ratio for your portfolio would be calculated as:
Sharpe Ratio = (12% - 7%)/ 8% = 0.625
Combination of Quants and Technical Analysts and benefits when together
When a quant and a technical analyst work together, it creates a team for successful algorithmic trading. Let us see how.
Technical analysts make use of technical indicators to predict the market scenario as to whether the market has more probability of becoming bearish or bullish. With the help of these results, the quantitative analyst can make use of statistical tools for outcomes such as expected returns, risks, Sharpe ratio, etc.
Then, combining both, that is, prediction of the market based on historic market performance and statistical numbers, a trading strategy can be created.
Benefits when Quants and Technical Analysts go together are as follows:
- The specialisation of tasks makes the work more efficient
- A combination of both helps in evaluating the long term investments since one predicts the market situation on historical performance and the other runs the statistical test to quantify the strategy’s performance
- Both combined together can help the trader realise the potential advantages and risks of trading decisions
- The strategy becomes verified twice. One with the help of technical indicators and other with the help of statistical tools
- Combining the technical and quantitative analysis leads to more beneficial trades
How to differentiate between the educational requirements of Quants and Technical Analysts?
For becoming a quantitative analyst, you need a mix of subjects to be knowledgeable in such as finance, statistics, mathematics, computer science, etc.
Now, since a quant requires to be in a broader framework practically, one needs to be skilled in maths and stats along with finance.
But, for becoming a technical analyst you mainly need to possess an educational qualification in finance since the role requires one to be studying historic market data or performance. With the historic market data, a technical analyst predicts what the performance of the market will be in future.
We have curated a list of some of our most demanded blogs on Technical Analysis written by experts!
Conclusion
We discussed a quant and technical analyst in this blog and how they specialise in their own roles and responsibilities. Both a quant and a technical analyst work in the same algorithmic trading domain. While they are good individually in their respective roles, combined they make for success in algorithmic trading.
If you want to learn about using technical indicators with one of the trading strategies known as swing trading, you can opt for this course on Swing Trading. If you are looking to explore more programs in quantitative finance and algorithmic trading, browse the complete suite of quantitative finance courses available on Quantra.
Disclaimer: All data and information provided in this article are for informational purposes only. QuantInsti® makes no representations as to accuracy, completeness, currentness, suitability, or validity of any information in this article and will not be liable for any errors, omissions, or delays in this information or any losses, injuries, or damages arising from its display or use. All information is provided on an as-is basis.