Guest Post by Alex Boykov
Building Trading Strategies using Google Stock Historical Prices
Hello, my name is Alex Boykov. I am a member of a team of developers for the WFAToolbox. This application provides the easiest way to develop algorithmic trading strategies in MATLAB using Google stock historical prices. The toolbox will help you solve the problem of getting free daily and intraday historical stock prices from 20+ Stock Exchanges, including Shanghai Stock Exchange (SSE), Bombay Stock Exchange (BSE) etc.
Have any of you encountered the following problem before? You heard from someone, or read on the Internet, about an interesting strategy for some assets (for example, pairs trading for oil companies on emerging markets that are highly cointegrated amongst themselves, and have enough liquidity) and you exclaim: “Oh my god, here it is, of course! Ah, if only I had the intraday historical data for those “Gazprom” and “Lukoil”, I could test it! “. Right then, you start frantically pouring your way through all the websites that you know to get free historical data, starting with a fierce search on Google, on forums, blogs etc. Then you turn on the waterworks, visiting the “Pricing” page of some expensive data feed company; and, in the end, after a long and tiresome day spent searching for quotes, you get desperate. You decide to go to the Google Finance website, and you see the Google stock historical prices data that you are requiring. You hysterically exclaim: “Why! Why can I not just download it from Google Finance … ”
At WFAToolbox, we face this exact scenario on a constant basis. As long as we still have not yet decided to change this situation. At the same time that we have developed an application that dramatically simplifies the testing and analysis of algorithmic trading strategies on MATLAB, we have also added to it a special module that allows you to download 100’000+ daily and intraday Google stock historical prices from 20+ Stock Exchanges from America, Europe, Asia and Australia.
Some of the other features offered by WFAToolbox include:
- Building Strategy rules
- Conducting Walk-Forward Analysis
- Performing optimization of trading strategies
- Rich visualization of performance results
- Usage of parallel processing technologies
- Easy analysis of strategy and portfolio results in Excel etc.
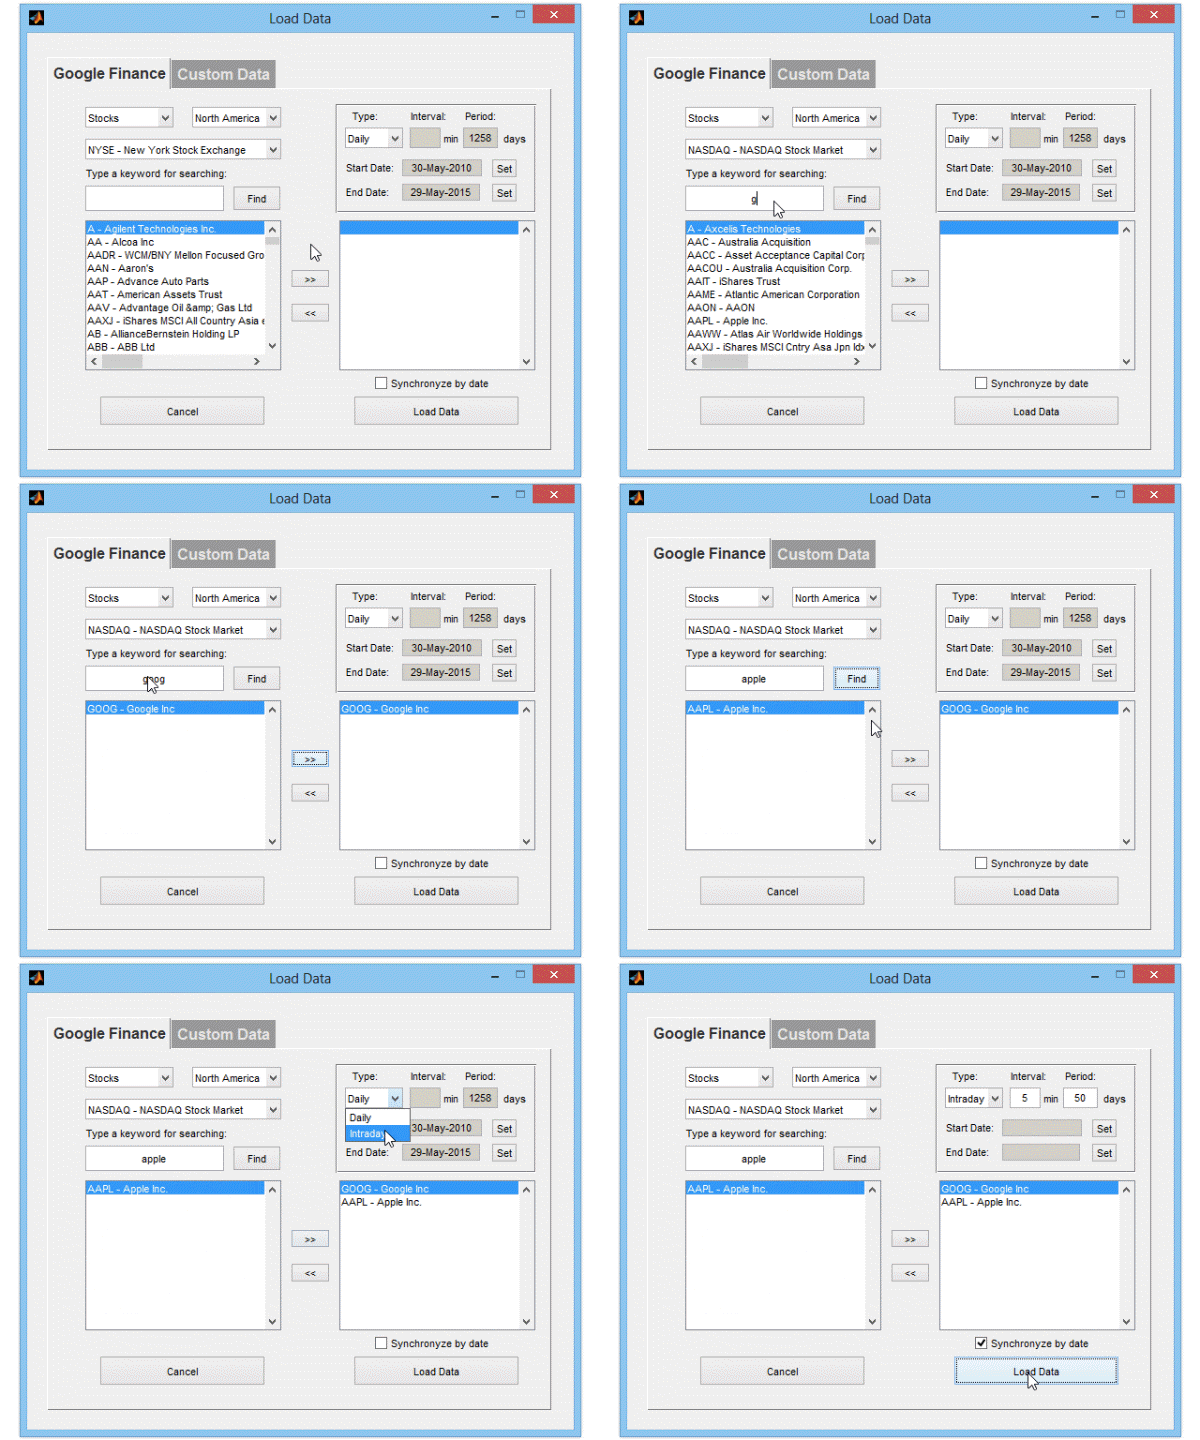
Especially for the QuantInsti® blog, we compiled a standalone application from MATLAB that allows any user (having MATLAB or not) to upload the Google stock historical prices quotes in csv format for further import to other programs and for working in Excel. We have tried our best to make the application as easy as possible for the job.

We use MATLAB in creating algorithmic trading strategies. We believe that it has a lot of advantages over R and other solutions, the main one of which is the ability to add modules from both Mathworks and third-party developers (for example, our application – WFAToolbox – Walk-Forward Analysis Toolbox).
Walk-Forward Analysis is an on-going, adaptive approach in evaluating the robustness of a trading system. It combines multiple cycles of “in-sample optimization” with “out-of-sample verification”.
Other advantages of MATLAB include:
- Easy to learn language which allows writing a complete backtest program
- Provision for vectorized operations which speeds up the strategy program execution time
- Numerous advanced statistical and mathematical built-in modules useful for creating strategies
- Large number of third-party packages available for quantitative trading purposes
- Ideal for testing strategies that involve a large portfolio of stocks and other assets
- Rich graphical interactive visualization output for accessing the strategy performance
In Executive Programme in Algorithmic Trading (EPAT™) there are two special lectures taken by Dr. E P Chan on Quantitative Momentum Strategies. He makes extensive use of MATLAB for illustrating the practical implementation of momentum strategies.
Next Step
In our next article 'Basic Operations On Stock Data Using Python' we will illustrate basic operations that can be performed on stock data using Python to analyze and build algorithmic trading strategies. We run through some basic operations that can be performed on a stock data using Python and we start by reading the stock data from a CSV file.
Update
We have noticed that some users are facing challenges while downloading the market data from Yahoo and Google Finance platforms. In case you are looking for an alternative source for market data, you can use Quandl for the same.
Disclaimer:
The views, opinions, and information provided within these guest posts are those of the author alone and do not represent those of QuantInsti®. The accuracy, completeness, and validity of any statements made or the links shared within this article are not guaranteed. We accept no liability for any errors, omissions or representations. Any liability with regards to infringement of intellectual property rights remains with them.


