
By Rekhit Pachanekar and Chainika Thakar
Bollinger Bands, a widely acclaimed technical analysis tool, has become an indispensable asset for traders seeking to navigate the turbulent waters of financial markets. Developed by John Bollinger in the 1980s, these bands offer a unique perspective on price volatility, helping traders make informed decisions.
In this comprehensive guide, we delve into the intricacies of Bollinger Bands, exploring their formula, calculation, and application in Python. If you want to see Bollinger Bands coded alongside other key indicators in a single workflow, our tutorial on technical analysis in Python covers exactly that, including moving averages, RSI, and ATR with full Python examples. Also, we will be addressing common pitfalls and offering invaluable tips for effective utilisation.
All the concepts in this blog have been taken from Volatility Trading Strategies for Beginners. You can take a Free Preview of the course by clicking on the green-coloured Free Preview button.
This blog covers:
- Brief about Bollinger Bands
- Formula and calculations
- Importance of Bollinger Bands
- Bollinger Bands-based trading strategies
- Trading strategy with Bollinger Bands in Python
- Common mistakes while using Bollinger Bands
- Limitations of using Bollinger Bands
Brief about Bollinger Bands
We embark on our journey by providing a concise overview of Bollinger Bands. These bands consist of three lines—an SMA (Simple Moving Average) flanked by an upper and lower band.
Moving averages are the averages of a series of numeric values. They have a predefined length for the number of values to average. This set of values moves forward as more data is added with time.
The dynamic relationship between these bands encapsulates valuable information about market volatility and potential price movements.
Formula and calculations
Delving deeper, we demystify the formula and calculation behind Bollinger Bands. A clear understanding of these mechanics is fundamental to interpreting and utilising them effectively.
Bollinger bands involve the following calculations:
- Middle Band: 30 Day moving average
- Upper Band: Middle Band + 2 x 30 Day Moving Standard Deviation
- Lower Band: Middle Band – 2 x 30 Day Moving Standard Deviation
As with most technical indicators, values for the look-back period and the number of standard deviations can be modified to fit the characteristics of a particular asset or trading style.

As depicted in the chart above, when the prices continually touch the upper band, the asset is usually in an overbought condition, conversely, when prices are regularly touching the lower band, the asset is usually in an oversold condition.
The Upper Bollinger band is constructed by moving 2 standard deviations above the 30-day moving average.
Similar to the upper Bollinger band, we construct the Lower Bollinger band two standard deviations below the 30-day simple moving average (SMA).
The reason why the upper and lower Bollinger bands are two standard deviations away from the moving average is that this makes an envelope around the closing price and contains the majority of the price action. Statistically, two standard deviations include 95% of price movement. Thus, any time the closing price goes below or above the Bollinger bands, there are high chances for breakout or price reversion, and hence it can be used as a signal. Learn Price Action Trading Strategies in detail in the Quantra course.
The beauty of Bollinger Bands is that it can be used in any type of market, from stocks to derivatives, as well as forex.
That’s it! Now you know how to create a Bollinger Band for any stock. But wait!
In addition to the Bollinger Bands, John Bollinger has said that we should look at the bandwidth of the band too, to help us in our analysis.
It is very simple to calculate the bandwidth, which is as follows:
[(Upper Band - Lower Band)/SMA] * 100
Bollinger Bandwidth is effectively used to identify the Bollinger Band squeeze.
A Bollinger Band squeeze is a period of low volatility characterised by a narrowing of the Bollinger Bands. It serves as a warning sign to traders that a significant price move or breakout may be imminent, prompting them to prepare and plan their trading strategies accordingly.
Importance of Bollinger Bands
The importance of Bollinger Bands in the realm of technical analysis and trading cannot be overstated.
These bands serve several crucial functions that make them an invaluable tool for traders and investors:
- Volatility Measurement: Bollinger Bands provide a dynamic way to assess market volatility. The width of the bands expands and contracts in response to price volatility. Wider bands indicate higher volatility, while narrower bands suggest lower volatility. Traders can use this information to adjust their strategies accordingly, such as tightening stop-loss orders during high volatility or entering positions during periods of low volatility.
- Trend Identification: Bollinger Bands help traders identify the direction and strength of trends. When prices consistently ride along the upper band, it suggests a strong uptrend, whereas prices hugging the lower band indicate a strong downtrend. This information aids traders in aligning their positions with prevailing market trends.
- Overbought and Oversold Conditions: Bollinger Bands can signal overbought and oversold conditions in the market. When prices touch or breach the upper band, it may indicate that an asset is overbought and due for a correction. Conversely, prices touching or dipping below the lower band may suggest oversold conditions and a potential rebound. Traders often use these signals to make timely entry or exit decisions.
- Reversal Indicators: Bollinger Bands can help identify potential reversal points in the market. When prices move to the outer bands and then reverse course, it can signal a reversal in the current trend. This is especially useful for swing traders and investors looking to capitalise on trend changes.
- Risk Management: Bollinger Bands offer risk management benefits by providing a visual representation of price volatility. Traders can adjust their position sizes and stop-loss levels based on the width of the bands, helping them manage risk more effectively.
- Confirmation Tool: Bollinger Bands can be used in conjunction with other technical indicators to confirm trading signals. When multiple indicators align, it can increase the confidence in a particular trade setup.
In summary, Bollinger Bands are a versatile and essential tool in the trader's toolkit. They assist in assessing market conditions, identifying trends, managing risk, and making informed trading decisions. Traders and investors who understand and effectively utilise Bollinger Bands can gain a significant edge in the financial markets.
We now move on to the main event, trying to figure out how to use Bollinger Bands to create a trading strategy.
These overbought and oversold indications shouldn’t be interpreted as direct buy/sell signals. Though, they can be a part of the signal generating decision process.
Bollinger Bands based Trading Strategies
Bollinger Bands, a powerful and versatile technical analysis tool, offer traders a unique framework for developing effective trading strategies.
Let us see below some of the widely used trading strategies with the help of Bollinger Bands.
The reversal
We talked about how the Bollinger Bands contain most of the price action in the bands. This means that at any time if the price moves above or below the Bollinger bands, it can be used as a signal.
This is the logic for the reversal trading strategy. We know that fear and greed drive the market. Thus, we can say that if the price goes above the upper Bollinger band, it could be a sign that the trend might reverse. A similar case is when the price goes below the lower Bollinger band.
Example:
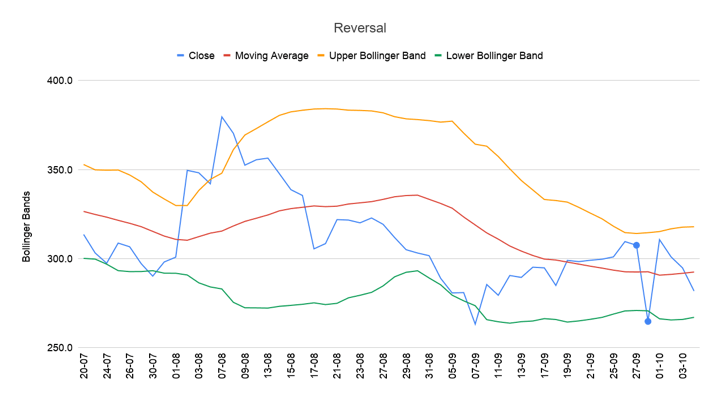
You can see in the stock chart above, on 27 September 2023, the price breached the lower Bollinger band and then subsequently went bullish for the next few days.
One must understand that the reversal of the price trend can happen due to a variety of factors such as a negative false news announcement over social media and not only because of the bands themselves.
Bollinger Band Squeeze
Bollinger bands help us to understand the volatility of an asset. When the market is strongly bullish (or bearish), due to their inherent properties, the Bollinger Band envelope will widen dramatically. In low volatility periods, or when the price of the asset is pretty much stagnant, the Bollinger Band envelope shrinks, effectively squeezing against the SMA.
Bollinger Band strategy is used to identify a period where the bands have squeezed together indicating that there is a breakout which can happen.
Unlike the strategy discussed above, where you know the direction of the trend, it can be hard to predict which direction the price would go after a period of low volatility.
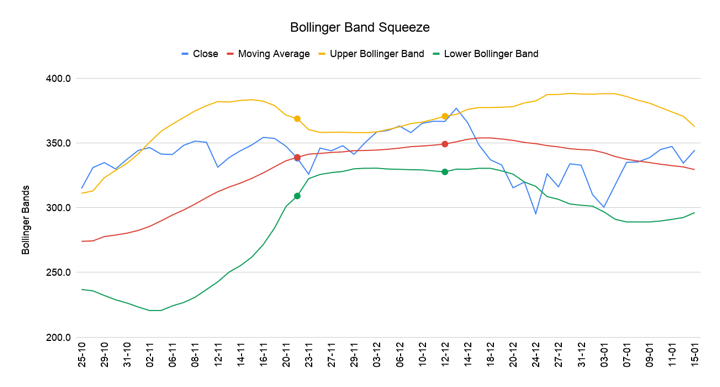
For example, in this chart, you can see the Bollinger band squeeze in the middle, from 21 November to 12 December before breaking out.
Double Bottoms
While the double bottoms strategy is not exactly unique to the Bollinger bands, it can be used efficiently with it. In a double bottom setup, as the name suggests, we are looking for a W shaped formation where the price closes below the lower band once before increasing the next period for a short while, only to close below the lower Bollinger band again.
It is at this precise moment where most traders are confident that the price will increase and sustain itself.
Usually, traders hone in when the price breaches the lower band and rebounds for a short while before diving again. If the second low is above the lower band, it is generally assumed that it is a double bottom and there is a strong chance that it will be an uptrend.

For example, we can see that on 7 September, the price breached the lower Bollinger Band and then rebounded. The price reduced again but did not breach the lower Bollinger band and thus, this can qualify as a Double bottom setup.
If we go further, we can see the same pattern on 5th October onwards.
Double top
Similar to the double bottom which is focused on the lower Bollinger band, the double top occurs at the upper Bollinger Band. The double top formation is a rare occurrence compared to the double bottoms which were seen earlier.
In the double top (or M top) we tend to look at the price which breaches the upper Bollinger band before decreasing for a while and then increasing again. The traders will check if the second rise closes below the upper Bollinger band and only then will they short the asset.
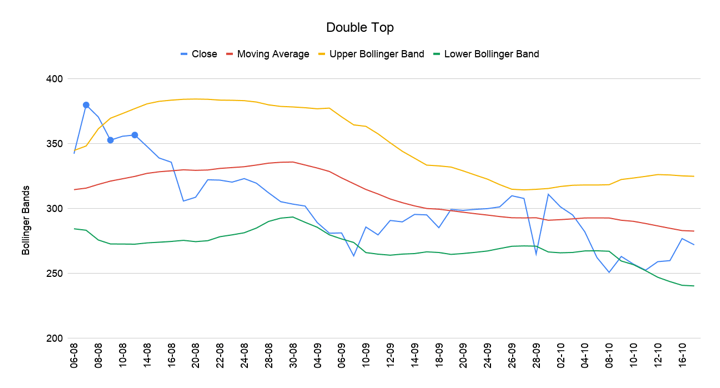
For example, the price breached the upper Bollinger band on 7th August and then reduced below the upper Bollinger band again. It rose again on 10th August but did not breach the upper Bollinger band. Thus, this qualifies as a Double top setup.
Trading in the bands
One strategy effective for the relatively low-risk individual who is content with low but safe returns on their investment is to trade by keeping the SMA as the signal to enter or exit the trade. Since the SMA is essentially an average and the price keeps swinging from one side of the SMA to the other, you are bound to end up with a profit. This strategy can also be used in times of very low volatility.

In the chart, you can see that on 6 February when the price reaches the SMA, it changes direction and reaches the lower Bollinger Band before reversing direction once again.

A variation on the earlier strategy is that instead of exiting when the price touches the SMA, we enter the trade when it is inside the band and trending, and exit when it touches the other band.
For example, if the closing price had touched the lower Bollinger Band before increasing again, and if we are confident that it will sustain the price increase, we buy the stock and exit when it touches the upper Bollinger band.
In the chart, you can see the price changing direction once it touches the upper Bollinger Band on 9 May and similarly changing its direction once again when it touches the lower Bollinger Band on 22 May.
Trading strategy with Bollinger Bands in Python
Developing a trading strategy with Bollinger Bands in Python involves leveraging this technical indicator to make informed buy and sell decisions in a systematic and automated manner.
Here's a step-by-step guide to creating a basic Bollinger Bands-based trading strategy using Python and popular libraries like pandas and matplotlib:
Step 1: Import Necessary Libraries
Step 2: Load Historical Price Data:
You'll need historical price data for the asset you want to trade. You can obtain this data from various sources, such as Yahoo Finance or a financial data provider. Ensure the data includes at least the date, open, high, low, and close prices.
Step 3: Calculate Bollinger Bands
Compute the Bollinger Bands by calculating the moving average and the standard deviation of the asset's prices. The upper band is the moving average plus a multiple of the standard deviation, and the lower band is the moving average minus the same multiple of the standard deviation.
Step 4: Create Trading Signals
Generate buy and sell signals based on the Bollinger Bands strategy. For example, you might buy when the price touches the lower band and sell when it touches the upper band.
Step 5: Backtesting and Visualisation
Backtest your strategy to assess it
historical performance and visualise the results.
Output:
Cumulative Returns: -2.52%
Returns Mean: -0.01%
Returns Standard Deviation: 0.29%
Sharpe Ratio: -0.03
Maximum Drawdown: -3.08%


Here are a few observations from the plots above:
- Volatility: The width between the Upper and Lower Bollinger Bands indicates the volatility of the asset. When the bands are closer together, it suggests lower volatility, and when they widen, it signifies higher volatility.
- Potential Reversals: The plot also helps to identify the potential reversal points. When the price touches or crosses the Upper Bollinger Band, for example, at 2022-11 and 2023-07, it indicates the overbought conditions, suggesting a potential downward correction. Conversely, when the price touches or crosses the Lower Bollinger Band, for example at 2023-03, it suggests oversold conditions and a potential upward reversal.
- Trading Signals: Traders often use the interaction between the price and the Bollinger Bands to generate buy and sell signals. For example, a buy signal occurs when the price touches the Lower Bollinger Band, and a sell signal occurs when the price touches the Upper Bollinger Band.
- Trend Identification: The position of the price relative to the SMA and Bollinger Bands can help traders identify the direction and strength of trends. Prices consistently above the SMA indicate an uptrend (between a bit after 2023-03 and somewhere around 2023-07), while prices consistently below the SMA indicate a downtrend (between 2022-11 to 2023-01).
- Cumulative returns over a period of time: In the second plot you can see how the cumulative returns have been fluctuating over the observed time period.
Also, it is observed from the strategy that the cumulative returns is -2.52%. Negative cumulative returns indicate that the strategy, based on the Bollinger Bands signals, has not been profitable during the observed period, and the overall performance has resulted in a loss.
To improve the strategy's performance and achieve positive cumulative returns, you may need to adjust the strategy's parameters, refine entry and exit criteria, or consider incorporating additional indicators or risk management techniques. Additionally, thorough backtesting and further analysis can help identify areas for improvement in your trading strategy.
This basic example outlines how to create a Bollinger Bands-based trading strategy in Python. One must ensure that the strategy is thoroughly tested and optimised, and risk management rules should be applied to control losses.
Additionally, consider incorporating other technical indicators and fundamental analysis to refine your strategy further. (You can learn all about in this course on technical indicators python.)
Common mistakes while using Bollinger Bands
While Bollinger Bands are a valuable tool in technical analysis, traders often make common mistakes when using them. Recognising and avoiding these pitfalls is essential for effective utilisation. Here are some common mistakes:
Overlooking Market Conditions
Failing to consider the broader market context can be a major mistake. Bollinger Bands should be used in conjunction with an understanding of prevailing market conditions, such as trending, ranging, or volatile markets. Using Bollinger Bands inappropriately during different market conditions can lead to poor decisions.
Neglecting Confirmation Signals
Relying solely on Bollinger Bands without confirming signals from other indicators or analyses can be risky. It's advisable to use Bollinger Bands in conjunction with other technical indicators or chart patterns to increase the accuracy of trading decisions.
Misinterpreting Squeezes
A Bollinger Band squeeze can lead to a breakout, but it doesn't specify the direction of the breakout. Some traders assume that a squeeze will result in an upward or downward movement, leading to premature entries. It's crucial to wait for confirmation of the breakout direction before taking a position.
Ignoring Risk Management
Failing to implement proper risk management techniques can result in substantial losses. Traders should always set stop-loss orders and position sizes based on their risk tolerance and the width of the Bollinger Bands. Overleveraging or neglecting stop-losses can lead to significant drawdowns.
Using Default Settings Blindly
Bollinger Bands have default settings, but these settings may not be optimal for all assets or timeframes. Traders should adjust the parameters (e.g., the moving average period and standard deviation multiplier) to better suit the asset and trading style they are using.
Chasing False Signals
Bollinger Bands can produce false signals, especially in choppy or sideways markets. Traders must exercise patience and discernment, avoiding the temptation to enter positions based on minor price fluctuations that don't align with the overall trend.
Overtrading
Trading too frequently based on minor price movements within the Bollinger Bands can lead to high transaction costs and reduced profitability. Traders should have a clear and disciplined trading plan that dictates when and how to enter and exit positions.
Lacking Flexibility
Rigidly adhering to a single trading strategy with Bollinger Bands can limit adaptability to changing market conditions. Markets evolve, and strategies should be adjusted accordingly. Traders should be willing to modify their approach when necessary.
Ignoring Fundamental Analysis
While Bollinger Bands provide valuable technical insights, they don't consider fundamental factors affecting an asset. Ignoring fundamental analysis can lead to missed opportunities or unexpected market reactions.
Over Reliance on Historical Data
Historical price data might not always accurately reflect current market conditions. Traders should incorporate real-time data and news events into their decision-making process.
In conclusion, while Bollinger Bands are a powerful technical tool, using them effectively requires a combination of technical analysis, risk management, and a nuanced understanding of market dynamics. Traders should be aware of these common mistakes and work to avoid them to enhance their trading success.
Limitations of using Bollinger Bands
Below are a few limitations of Bollinger Bands.
- Not Predictive of Future Prices: Bollinger Bands are based on historical price data and provide information about past volatility and price levels. They do not predict future prices with certainty, and trading decisions are subject to market risk.
- False Signals: Bollinger Bands can produce false signals, especially in choppy or sideways markets. Traders should exercise caution and use additional analysis to confirm signals.
- Lack of Directional Information: Bollinger Bands indicate volatility and potential price levels but do not provide information about the direction of price movements. Traders must rely on other tools or analyses to determine the likely direction of a breakout.
- Optimisation Challenges: Finding the optimal parameters for Bollinger Bands (e.g., the best period and standard deviation multiplier) can be challenging, as they may vary for different assets and timeframes.
- Market Conditions Matter: Bollinger Bands are more effective in certain market conditions, such as ranging markets, and may be less useful during strong trending periods or when markets are highly unpredictable.
- Subjectivity: Interpretation of Bollinger Bands can be subjective, and different traders may have varying interpretations of signals.
- No Guarantee of Profit: Using Bollinger Bands, like any trading strategy, does not guarantee profits. Successful trading involves risk management, discipline, and ongoing learning.
Hence, Bollinger Bands are a valuable tool when used thoughtfully and in conjunction with other analysis techniques. Understanding their limitations and applying them within a comprehensive trading plan is essential for effective utilisation.
Bibliography
Conclusion
This comprehensive guide has shed light on the power of Bollinger Bands in trading. We've explored their formula, calculation, and practical applications, with a focus on developing trading strategies in Python. By understanding the significance of Bollinger Bands, traders can measure volatility, identify trends, and manage risk effectively.
Additionally, we've highlighted common mistakes to avoid when using Bollinger Bands, emphasising the importance of combining technical indicators and staying adaptable in different market conditions. Remember that while Bollinger Bands are a valuable tool, they don't guarantee profits, and successful trading requires discipline and continuous learning.
As you delve into the world of Bollinger Bands and trading, keep these insights in mind to enhance your trading proficiency and navigate the financial markets with confidence.
If you wish to learn more about Bollinger Bands in detail, explore our course on Volatility Trading Strategies for Beginners. This course covers all about Bollinger Bands including the formula, phases, the volatility cycle of Bollinger Bands and much more!
File in the download:
Bollinger Bands - Python Notebook
Disclaimer: All data and information provided in this article are for informational purposes only. QuantInsti® makes no representations as to accuracy, completeness, currentness, suitability, or validity of any information in this article and will not be liable for any errors, omissions, or delays in this information or any losses, injuries, or damages arising from its display or use. All information is provided on an as-is basis.
