
Price action trading stands as a time-honoured methodology cherished within the thriving trading community. Both individual traders and institutional investors frequently embrace its techniques to anticipate and analyse short-term fluctuations in financial markets.
Delving into the essence of price action trading, this blog offers an insightful journey through its core principles, effective strategies, and subtle intricacies. We will be discussing everything from the introduction to price action trading, the reason it is popular and widely accepted to the price action trading strategies and Python based implementation.
So if you've ever wondered, "What is price action trading?" and “How to utilise price action trading?“ you're in the right place. This guide will take you on a journey through the fundamentals, strategies, and nuances of price action trading.
All the concepts covered in this blog are taken from this Quantra course on Price Action Trading Strategies Using Python. You can take a Free Preview of the courses by clicking on the green-coloured Free Preview button.
We cover:
- What is price action trading?
- Popularity of price action trading
- Price action trading strategies
- Different types of charts in price action trading
- Identifying support and resistance using Python
- Steps in Python for price action analysis
- Tools in Python for price action analysis
- Price action trading for Fibonacci Retracement strategy
- Pros of price action trading
- Cons of price action trading
- Risk management techniques for price action trading
- Common mistakes to avoid in price action trading
- FAQs about price action trading
What is price action trading?
The price action trading approach places a significant emphasis on analysing price dynamics and trends over a prolonged period. Instead of heavily relying on multiple technical indicators, traders practising price action trading focus primarily on understanding raw price movements. This methodology aims to understand price dynamics to forecast future trends and determine suitable long or short positions, distinguishing it from other trading strategies.
The direct approach of price action trading
Price action trading revolves around studying price behaviour and patterns directly from the market's movements, without the constant reference to indicators. This direct approach allows traders to gain insights into market sentiment and potential price movements. Optimize your trades by exploring these Algorithmic Trading books.
Traders integrate select indicators into their price action trading strategies to potentially refine their analysis and decisions. raders who want to build these supporting indicators from scratch can follow our guide on technical analysis using Python, which covers moving averages, Bollinger Bands, RSI, and ATR with complete Python code and charts. However, the essence of price action trading lies in its emphasis on pure price dynamics. The significance of observing and understanding price movements tends to overshadow the role of technical indicators in this system.
When diving into the realm of price action trading patterns, traders are primarily on the lookout for specific setups that promise a favourable risk-to-reward ratio. These setups often include emerging breakout patterns such as trendlines, flags, triangles, and wedges. Additionally, trend reversal patterns like head and shoulders, double tops, and double bottoms are also integral to the analysis concerning many price action trading strategies. ⁽¹⁾
Let us now find out what makes price action trading popular.
Popularity of price action trading
In recent years, the trading community has witnessed a surge in the popularity of price action trading. This rise in prominence can be attributed to several factors that resonate with both novice and experienced traders alike.
Let's delve into the reasons behind the growing allure of price action trading.
- Simplicity and Clarity: At its core, price action trading revolves around analysing raw price movements and patterns. This straightforward approach appeals to traders who prefer a clear and uncomplicated method devoid of excessive jargon or complex indicators.
- Versatility Across Markets: One of the standout features of price action trading is its universal applicability. Whether it's stocks, commodities, forex, or cryptocurrencies, the principles of price action trading remain consistent. This broad scope allows traders to diversify their portfolios and explore various financial markets using a unified strategy.
- Empowerment and Control: Price action trading places a significant emphasis on individual interpretation and analysis. Price action trading fosters a sense of empowerment and autonomy by encouraging traders to rely on their observations and insights rather than external signals or indicators.
- Flexibility in Strategy: Unlike rigid trading systems governed by strict rules, price action trading offers flexibility. Traders can adapt strategies, adjust position sizes, and refine risk management techniques based on evolving market conditions. This adaptability is invaluable in navigating the dynamic landscape of financial markets.
Price action trading stands as a testament to the adage that sometimes, simplicity holds the key to success in the complex world of trading. By focusing on price movements and embracing flexibility, price action trading offers a refreshing perspective, reshaping how traders perceive and navigate the ever-evolving financial markets.
Going forward, let us see some strategies that can be implemented in price action trading.
Price action trading strategies
Let's explore some popular price action trading strategies that traders employ:
Support and Resistance Levels
- Concept: Price action traders often identify key support and resistance levels, which represent zones where the price tends to reverse or consolidate.
- Strategy: Buy near support levels when prices are deemed to be low and sell near resistance levels when prices are perceived as high. Breakouts above resistance or below support can also be trading opportunities.

Trend Following
- Concept: This strategy capitalises on identifying and trading along with established market trends.
- Strategy: Trend-following strategies are strategies where you simply ride the trend, i.e. buy when the price is going up (uptrend) and sell when the price starts going down (downtrend), both for a prolonged time period. With trend-following strategies, one simply needs to keep an eye on the market for any emerging trends.
In the image below, Amazon’s stock is an example of trend-following strategies. There are two blue lines where the price of Amazon is showing two trends, that is, uptrend (connecting troughs) and downtrend (connecting peaks).

Candlestick Patterns
- Concept: Candlestick patterns offer insights into market sentiment and potential price reversals or continuations.
- Strategy: Traders monitor specific candlestick formations, such as doji, engulfing patterns, and hammer patterns, to make trading decisions. For instance, a bullish engulfing pattern at a support level might signal a potential upward reversal.
You can see below what the candlestick patterns look like.

Breakout Trading
- Concept: Breakout trading involves entering trades when the price breaks through a predefined support or resistance level.
- Strategy: Traders anticipate significant price movements following a breakout and position themselves accordingly. Stop orders are often used to manage risk, ensuring swift exits if the breakout proves to be false.
In the image below, breakout is shown where the price jumps to create a new resistance and support level. The clear buy signals and sell signals can be seen.
Few observations:
- There are a lot of support and resistance lines.
- The buy and sell signals get generated when there is a sudden change in the price to create a breakout.
- These breakouts are seen as “sell signals” at the peak of resistance and “buy signals” at the maximum level of support.
- The sudden upward and downward movement of price has generated the sell and buy signal seen circled.

Range Trading
- Concept: Range-bound markets exhibit horizontal price movements between established support and resistance levels.
- Strategy: Traders identify the boundaries of the range and execute buy and sell orders near these levels. They aim to capitalise on price oscillations within the defined range until a breakout occurs.

You can see in the image above that:
- The two horizontal lines are drawn representing support and resistance levels.
- The price has bounced off these levels several times in recent months, suggesting some validity to these levels.
- The price action appears to be somewhat contained within a channel formed by the horizontal lines and the recent price highs and lows.
- This channel could be used by range traders to identify entry and exit points for trades.
Multiple Time Frame Analysis
- Concept: Multiple time frame strategy involves analysing price action across various time frames to gain a comprehensive view of the market.
- Strategy: Traders assess long-term trends on higher time frames (longest period studied) and refine entry and exit points using shorter time frames (shortest time period studied). This approach helps in identifying strong trends and filtering out noise.
You can see the image below as an example of multiple time frame analysis where the daily price chart (shorter time frame) as well as the weekly price chart (longer time frame) has been taken into account for the analysis..

Examples of entry and exit techniques in price action trading
Efficient entry and exit techniques are crucial for maximising return and minimising losses in price action trading:
- Breakout Entries: Traders enter positions when the price breaks above resistance in an uptrend or below support in a downtrend. Stop orders can be placed below/above the breakout level.
- Candlestick Confirmation: Some traders wait for the close of a candlestick to confirm their entries. For example, entering a trade only if a bullish engulfing pattern is confirmed by a close above the pattern's high.
- Trailing Stops for Exits: To capture maximum profits, traders often use trailing stops that adjust with the market's movements, allowing them to stay in a trade as long as the trend persists. ⁽²⁾
There are several different types of charts in price action trading which we will discuss in the next section.
Different types of charts in price action trading
A simple line chart provides a summary of closing price data for an asset over a specified period. The following is an example of a simple line chart that displays Apple’s daily closing price data.

A drawback of the line chart is that other important data such as the opening price for the day, and the highest and lowest traded price are simply not included in the chart. Thus for better technical analysis, candlestick/bar charts are preferred over line charts as they include and represent this additional data that can be followed to precisely study the price movements during a specified time period.
To enhance your trading strategies, consider using automated trading with TradingView, which offers advanced charting techniques for more informed decision-making.
The following is a Candlesticks chart which also illustrates the Open, High, Low, and Close data at every interval.

A crisp understanding of how candlesticks are used to represent OHLC data is required to be able to spot and read price action in charts. If you wish to learn more about trading using candlestick patterns you can visit the Quantra course on "Candlestick Patterns based Automated Trading".
Now, let us see the steps in Python for implementing the price action analysis.
Steps in Python for price action analysis
Price action trading emphasises analysing the price movements and patterns of the data without relying on traditional technical indicators. Below are Python steps on how to approach price action trading without incorporating technical indicators:
Step 1: Data Acquisition
Use Python libraries such as yfinance or alpha_vantage to fetch historical price data. Here we will use yfinance.
Step 2: Data Preprocessing
Handle any missing or null values in the dataset.
Step 3: Plotting Price Data
Output:

Till the above step the steps remain the same for every tool while conducting price action trading analysis.
Let us now discuss the tools in Python for price action analysis further.
Tools in Python for price action analysis
Now, we will see which tools can be used for the price action trading analysis.
Support and resistance for analysis
Output:

Draw trendlines for trend direction
Now, we will draw trend lines connecting significant highs or lows to visualise the trend direction.
Output:

Candlestick patterns for market analysis
Let us find out the candlestick patterns using ta-lib. Here is how you do the candlestick analysis:
- Analyse candlestick patterns to derive insights into market sentiment and potential reversals or continuations.
- Use Python libraries like mplfinance for advanced candlestick charting.
Output:

Here are some candlestick patterns in the image above:
- Doji: There is a doji on January 18th and several others like that. Dojis represent indecision in the market, as the open and close prices are essentially the same. They can signal potential reversals, but they can also be meaningless on their own.
- Hammer: There is a hammer pattern between January 8th and January 13th. A hammer candlestick typically has a long lower shadow and a small body, suggesting that although the price fell during the trading period, buying pressure was able to push the price back up near the open. However, without seeing the following candlestick (the "confirmation candle"), it's difficult to say for sure if this is a valid hammer pattern.
- Bearish engulfing: There is a possible bearish engulfing pattern before January 3rd. A bearish engulfing pattern is formed when a long red candlestick completely engulfs the previous green candlestick, suggesting strong selling pressure. However, again, without seeing the following candlestick, it's difficult to say for sure if this is a valid bearish engulfing pattern.
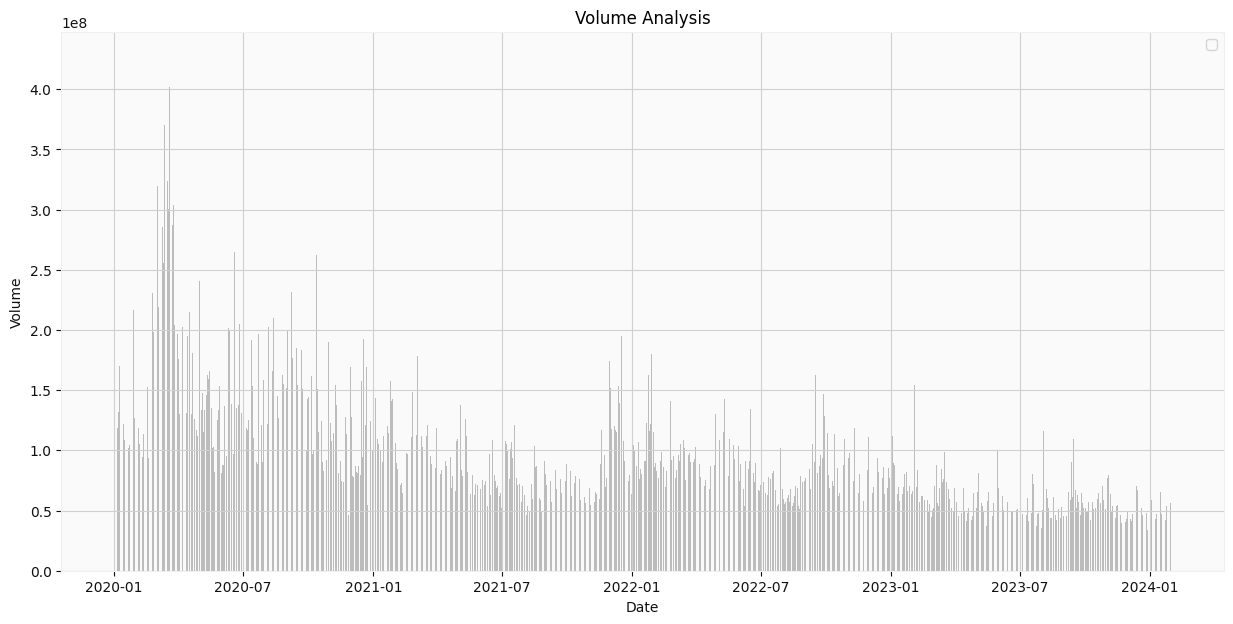
Volume analysis
Optionally, analyse volume alongside price action to validate the strength of price movements.
Output:
Summary
Based on the observed price action and identified levels, formulate trading strategies focusing on entries, exits, and risk management in trading techniques tailored to the specific market conditions and your risk tolerance.
By following these steps, you can perform a comprehensive price action analysis in Python, leveraging raw price data, chart patterns, and visualisations to make informed trading decisions without relying on traditional technical indicators. You can also use these tools combined for conducting price action analysis.
Here are some ideas to combine the tools:
- Trend: You can use trendlines and candlestick patterns to identify the overall trend and potential reversals.
- Support/Resistance: Refine support/resistance with trendlines, candlestick breakouts/rejections, and volume confirmation.
- Entry/Exit: Look for the confluence of support/resistance, trendline touches, candlestick signals, and volume confirmation for entries and exits.
We will now take a look at the Fibonacci Retracement strategy for applying the price action trading.
Price action trading for Fibonacci Retracement strategy
Let us move further and apply price action trading with a strategy. Here, let us take one of the most popular ones, which is, the Fibonacci Retracement strategy. Price action trading with Fibonacci Retracement is like using a ruler to find spots where the price might bounce or stop in the stock market. It's based on the idea that prices often follow predictable patterns, and Fibonacci Ratios (calculated as a part of the strategy) help us spot those patterns.
So, traders use these Fibonacci Ratios to figure out where to buy or sell stocks based on how the price has moved in the past.
Fibonacci Retracement levels are based on ratios derived from the Fibonacci Sequence, a mathematical sequence where each number is the sum of the two preceding ones (e.g., 0, 1, 1, 2, 3, 5, 8, 13, 21, etc.). These ratios are widely used by traders in technical analysis to identify potential support and resistance levels in financial markets.
The key Fibonacci Retracement levels include 23.6%, 38.2%, 50%, 61.8%, and 78.6%.
Here's a breakdown of each Fibonacci Retracement level and its significance in trading:
- 23.6%: This level is considered the first retracement level. It suggests a relatively minor pullback in price within the overall trend. Traders often view this level as a potential area of support or resistance, where a reversal in price direction may occur.
- 38.2%: This level represents a deeper retracement compared to the 23.6% level. It suggests a moderate pullback in price, often seen as a correction within the primary trend. Traders pay attention to this level for potential buying or selling opportunities, as it may indicate a retracement before the trend resumes.
- 50%: While not directly derived from the Fibonacci Sequence, the 50% level is included in the Fibonacci Retracement analysis due to its widespread use by traders. This level suggests a significant retracement, where the price retraces half of the previous move. Traders often consider the 50% level as a critical area of support or resistance.
- 61.8%: Also known as the "golden ratio" or "golden mean," the 61.8% level is one of the most significant Fibonacci Retracement levels. It suggests a strong retracement in price, often seen as a reversal point where the trend may change direction. Many traders consider this level as a potential entry or exit point for trades.
- 78.6%: This level represents an even deeper retracement than the 61.8% level. It suggests a substantial pullback in price, indicating a potential reversal or continuation of the trend. Traders closely monitor this level for signs of price rejection or confirmation of the trend direction.
In this Python code, we will find the Fibonacci Ratios for the AAPL prices to analyse each ratio as per the explanation of the ratios’ significance above.
The steps in this code are as follows:
- Step 1 - Import the libraries and download the data
- Step 2 - Calculate the maximum and minimum price
- Step 3 - Calculate Fibonacci Retracement levels
- Step 4 - Generate the chart
Note: If you want to find out more on Fibonacci Retracement strategy as well as other strategies utilising price action trading, check out our course titled “Price Action Trading Strategies using Python”.
Now, let us begin with our Python code:
Step 1 - Import the libraries and download data
Step 2 - Calculate the maximum and minimum price
Step 3 - Calculate Fibonacci Retracement levels
Output:
[*********************100%%**********************]  1 of 1 completed
Maximum Price: 194.93125915527344
Minimum Price: 180.9490966796875

FibonacciRatios and Corresponding Prices:
Fib Ratio: 1.0 -> Price: 194.93125915527344
Fib Ratio: 0.786 -> Price: 191.93907638549805
Fib Ratio: 0.618 -> Price: 189.5900730895996
Fib Ratio: 0.5 -> Price: 187.94017791748047
Fib Ratio: 0.382 -> Price: 186.29028274536134
Fib Ratio: 0.236 -> Price: 184.2488870239258
Fib Ratio: 0 -> Price: 180.9490966796875
Step 4 - Generate the chart
Output:

The chart above visualises the FibonacciRatios and the corresponding price for each ratio. It is visible that the price rises to reach the peak of the uptrend and then retraces. Only when the price begins to retrace during the uptrend, it is advisable to go long (buy). The trend weakens as the price reaches the deeper Fibonacci Levels.
As we discussed earlier, 0.236% is considered the first retracement level and in the above plot the price retraces further, to 0.5%, a significant retracement level. In this strategy, as a trader, you can decide the range of ratios in which you would like to trade.
For example, you can open a long position since the price reached a significant retrace element level of 0.5%. Risk management measures such as stop-loss at the next retracement level i.e. 0.618 which will be the exit point for your trade in case the price retraces to this level.
Also, continuing with the same example, some traders trade in a particular range such as, between 0.382% and 0.5%. You can use this range for potential buying, as it may indicate a retracement before the trend resumes.
Going further, if you want to find out more about the Fibonacci Retracement strategy with Price Action trading, such as variation in the strategy, performance analysis, backtesting etc. check out our course titled “Price Action Trading Strategies using Python”.
Let us now see some pros of price action trading.
Pros of price action trading
The pros of price action trading can be listed as follows:
- It is very easy to understand and practice price action trading strategies, even if you do not have much experience in trading.
- Price action trading strategies work well across most financial assets such as stocks, forex, crypto, etc. and are valid across all timeframes.
- You have the freedom to decide the entry and exit points for every trading setup based on your interpretation of the risk and reward.
After checking the pros, let us also find out the drawbacks of price action trading so that you can be aware of the same while applying price action trading.
Cons of price action trading
The cons of price action trading are as follows:
- You will have to spend a considerable amount of time studying charts, identifying patterns and scoping for various potential trading opportunities.
- At times, price action traders analysing the same chart may come up with contradictory interpretations.
- Automating price action trading strategies is difficult and hence, traders implementing it manually must have strong control over their emotions to be consistently profitable over a period of time.
Although there are drawbacks, there are some risk management techniques for price action trading which we will discuss now.
For automated trading for beginners, automation can help simplify these challenges by reducing emotional bias and improving trading efficiency. It offers a more systematic approach, making it easier to manage strategies.
Risk management techniques for price action trading
Risk management is a fundamental aspect of trading that ensures capital preservation and sustainability in the markets. In price action trading, while the focus is primarily on interpreting price movements and patterns, effective risk management techniques play a crucial role in enhancing profitability and minimising potential losses.
Here are some risk management techniques tailored for price action trading:

Position Sizing
- Determine the appropriate position size for each trade based on your risk tolerance and the specific setup's characteristics.
- Avoid risking more than a predetermined percentage of your trading capital on a single trade (commonly recommended between 1% to 3%).
Stop Loss Orders
- Always set stop-loss orders to define the maximum acceptable loss for each trade.
- Place stops based on logical price levels, such as beyond significant support or resistance levels, trendlines, or the pattern's invalidation point.
Take Profit Targets
- Set clear profit targets based on potential areas of resistance or support, previous swing highs or lows, or other relevant price action structures.
- Adjust take-profit levels as the trade progresses to lock in profits or based on evolving market conditions.
Risk-Reward Ratio
- Assess the potential reward relative to the risk of each trade.
- Aim for trades with a favourable risk-reward ratio, where the potential reward substantially outweighs the risk (e.g., 2:1 or higher).
Trailing Stops
- Implement trailing stops to protect profits and allow trades to capture additional upside potential as the price moves in the desired direction.
- Adjust trailing stops based on price action developments, such as significant support or resistance levels or trendline breaks.
Diversification
- Avoid overexposure to a single market, asset, or trade setup.
- Diversify your trades across different instruments, sectors, or strategies to mitigate the impact of adverse market movements or specific trade failures.
Risk Assessment and Adaptation
- Continuously assess and monitor the risk profile of your trading portfolio.
- Be prepared to adapt your risk management approach based on changing market conditions, volatility regimes, or performance metrics.
Now, we will see the common mistakes that should be avoided while applying price action trading.
Common mistakes to avoid in price action trading
Price action trading, while offering a powerful approach to understanding market dynamics, is not immune to common pitfalls and mistakes that traders may encounter. Recognising and avoiding these mistakes is crucial for maintaining consistency and maximising profitability in price action trading.
Here are some common mistakes to avoid:

- Overcomplicating Analysis: Avoid adding too many indicators, tools, or complex strategies to your price action analysis. Stick to the core principles of price action and focus on interpreting raw price movements and patterns.
- Lack of Patience: Price action trading requires patience to wait for high-probability setups and clear market signals. Avoid entering trades impulsively or forcing trades in the absence of favourable conditions.
- Ignoring Risk Management: Neglecting proper risk management techniques, such as setting stop-loss orders, defining position sizes, or assessing risk-reward ratios, can expose your trading capital to unnecessary risks.
- Over leveraging: Using excessive leverage can amplify both potential profits and losses. Avoid overleveraging your trades and ensure that your position sizes are appropriate relative to your trading capital and risk tolerance.
- Chasing the Market: Avoid chasing the market or entering trades late after significant price movements have already occurred. Focus on identifying early signs of potential trends or reversals based on price action structures.
- Ignoring Market Context: Context matters in price action trading. Avoid trading in isolation without considering broader market conditions, trends, or key support and resistance levels that may influence the price action.
- Emotional Decision-Making: Emotional decisions, such as revenge trading after a loss, exiting trades prematurely out of fear, or becoming overly confident after a series of wins, can undermine your trading discipline and consistency.
- Lack of Continuous Learning: The financial markets are dynamic, and continuous learning is essential for adapting to changing market conditions, refining your strategies, and expanding your knowledge of price action principles.
- Failing to Adapt: While it's important to have a structured approach to price action trading, avoid becoming rigid or unwilling to adapt your strategies based on evolving market dynamics or new insights.
- Impatience with Trade Management: Proper trade management is crucial in price action trading. Avoid becoming impatient with managing trades, such as moving stops prematurely, failing to adjust profit targets, or neglecting to monitor trades effectively.
- Neglecting Backtesting and Analysis: Neglecting to backtest your strategies, analyse your trades, or review your performance can hinder your ability to identify areas for improvement, validate your approach, and enhance your trading skills.
By avoiding these common mistakes and maintaining a disciplined, patient, and adaptive approach to price action trading, you can mitigate risks, improve your decision-making process, and increase your chances of achieving consistent success in the financial markets.
You can now check some frequently asked questions regarding price action trading and get all the required information.
FAQs about price action trading
Here are some frequently asked questions about price action trading.
Q. Is price action trading profitable?
A. Price action trading can be profitable for traders who effectively apply its principles and strategies. Success in price action trading often depends on a trader's skill in interpreting price movements, managing risk, and executing well-defined trading plans. However, like any trading approach, profitability can vary among individuals and is influenced by factors such as market conditions, risk management, and psychological discipline.
Q. How to learn price action trading?
A. Learning price action trading involves studying the principles of interpreting raw price movements and patterns without relying heavily on indicators.
Here are steps to consider:
- Educate Yourself: Read books, articles, and online resources focused on price action trading to understand its concepts and strategies.
- Practice: Apply price action principles on historical data or a demo trading account to develop skills and gain practical experience.
- Observe Markets: Regularly observe live markets to identify and analyse price action patterns, support and resistance levels, and other relevant structures.
- Seek Mentorship: Consider learning from experienced price action traders or joining communities where you can discuss and share insights about price action trading.
- Review and Refine: Continuously review your trades, analyse outcomes, and refine your approach to enhance your understanding and proficiency in price action trading.
For those eager to learn price action trading, grasping the ability to identify crucial levels like support and resistance zones is paramount. Moreover, gaining proficiency in various candlestick pattern analyses can significantly enhance one's price action trading strategy.
There's a wealth of knowledge available for enthusiasts keen on delving deeper into price action trading. As with any trading approach, consistent learning, practice, and adaptability are key to mastering the intricacies of price action trading.
Moreover, the price action trading community is vibrant and collaborative. Forums, discussion groups, and online communities provide platforms for traders to share insights, discuss strategies, and learn from one another's experiences. This sense of camaraderie and shared learning contributes to the widespread adoption of price action trading.
Conclusion
Price action trading offers a straightforward approach to understanding market behaviour through raw price movements and patterns. While its popularity grows due to its clarity and adaptability, success hinges on disciplined application, continuous learning, and effective risk management. Mastering this strategy can empower traders with a robust toolset for navigating dynamic financial markets.
If you wish to learn more about Price Action Trading Strategies Using Python consisting of downloadable strategies and codes that help you to tweak, fine-tune and implement the codes in the live markets. With this course, you can build a strong foundation in price action trading as well as learn how to spot and trade the most important trading patterns: double tops/double bottoms, triple tops/triple bottoms, head and shoulders.
Get acquainted with several trading strategies, and price action tools such as pivot points and the Fibonacci Retracement levels via a practical approach. Enroll now!
File in the download
- Price Action Trading in Python - Python notebook
Author: Chainika Thakar (Originally written by Kevin Patrao)
Note: The original post has been revamped on 11th March 2024 for recentness, and accuracy.
Disclaimer: All investments and trading in the stock market involve risk. Any decision to place trades in the financial markets, including trading in stock or options or other financial instruments is a personal decision that should only be made after thorough research, including a personal risk and financial assessment and the engagement of professional assistance to the extent you believe necessary. The trading strategies or related information mentioned in this article is for informational purposes only.
