
Data cleaning is time-consuming but the most important and rewarding part of the data analysis process. The process of data analysis is incomplete without cleaning data.
But what happens if we skip this step?
Suppose we had certain erroneous data in our price data. The incorrect data formed outliers in our dataset. And our machine learning model assumed that this part of the dataset (maybe the price of Tesla did jump from $50 to $500 in one day). You know what is the end result of the analysis now.
The machine learning model gives false results and no one wants that! Since the predictions are way off, you have to start the analysis from scratch, again! Thus, data cleaning is an important part of analysis which shouldn’t be skipped.
This blog will take you through the entire process of data cleaning and provide solutions to some of the challenges faced in this process.
- What is data?
- Various sources of data
- What does raw and processed data look like?
- Benefits of data cleaning
- Features of good quality data
- Terms used in data cleaning
- Steps to clean your data
- Understand your data
- Basic problems to be solved while cleaning data
- Data cleaning for trading
- Pre-existing softwares
- Resources to learn data cleaning
- Frequently Asked Questions
What is data?
Data Science is one of the most sought after professions in today’s time. So let me start by answering the age-old question - What is Data? Well, according to Wikipedia, ‘Data are a set of values of qualitative or quantitative variables about one or more persons or objects, that are collected through observation.’
Consider a dataset containing information about a shipment of different species of fruits.

Some of the variables in the dataset might be qualitative such as name, colour, destination and country of origin of the fruit, customer feedback (disappointed, content, pleased) or quantitative such as the cost of fruit, transport cost, the weight of the shipment, cost of shipment and number of fruits in the shipment.
Some of these variables may emanate from other lower-level ones. In this example, the cost of shipment is derived from the cost of fruit and transport cost variables.

These quantitative variables may also be classified into two types, continuous and discrete. Continuous variables as the name suggests are continuous on the number line and may assume any real value. Discrete variables may have only specific values, usually integers. The weight of the shipment will be a continuous variable whereas if I count the number of fruits in each shipment, it will be a discrete variable.
Qualitative variables can be bisected into nominal and ordinal variables. Nominal or unordered variables are a sort of label variable where those labels have no quantitative value. For example, the colour of the fruit or the destination of the shipment could be nominal variables. Ordinal or ordered variables are the ones whose labels have a quantitative value, i.e. their ordering matters. In the fruits’ database, customer feedback would be an ordered variable.
Most people think of data science as beautiful graphs and plots that convey very accurate and precise information. However, what most people do not realize is the process that is necessary to produce such figures.
The data analysis pipeline consists of 5 steps.
Raw data -> Processing script ->Tidy data -> Data analysis -> Data communication
Usually, the first three steps of the pipeline are overlooked. Beginners jump directly to the data analysis step. Any corporation or academic study will work on getting their data and pre-process it in-house. So you will want to know how to acquire the raw data and clean and pre-process it yourself.
This blog will cover all about cleaning and getting your data for analysis.
Various sources of data
First, let us talk about the various sources from where you could acquire data. Most common sources could include tables and spreadsheets from data providing sites like Kaggle or the UC Irvine Machine Learning Repository or raw JSON and text files obtained from scraping the web or using APIs. The .xls or .csv files from Kaggle may be pre-processed but the raw JSON and .txt files will need to be worked on to get the information in some readable format. Detailed methods of data extraction can be found here.
What does raw and processed data look like?
Ideally, this is what you would want your clean data to look like:
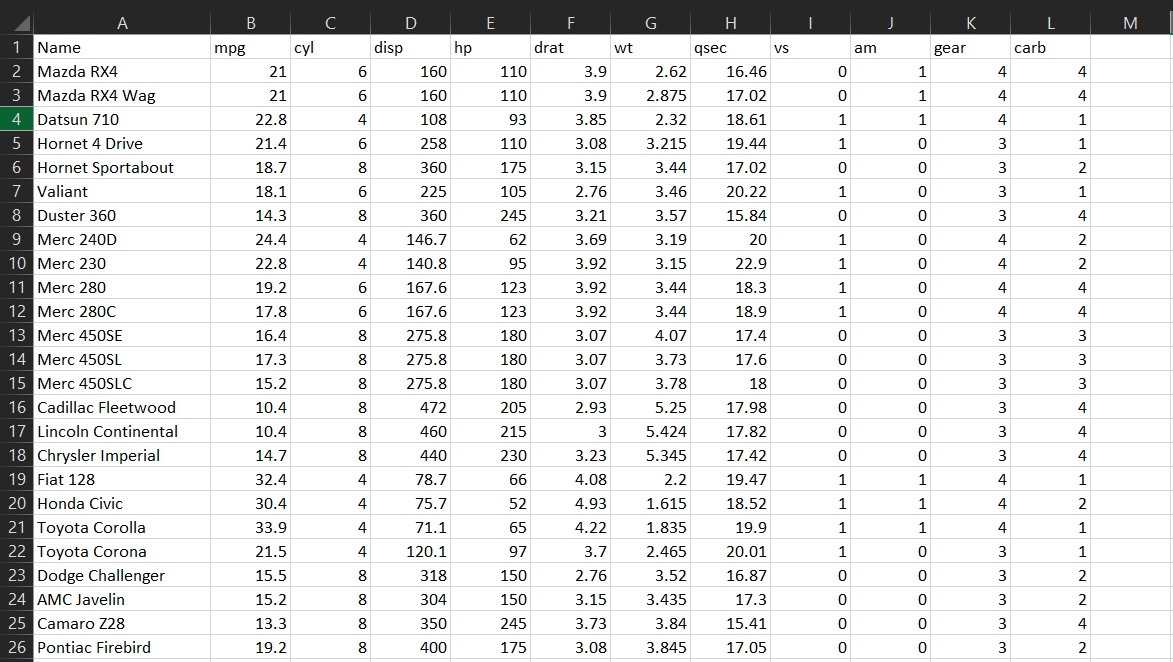
Each column has only one variable. In each row, you have only one observation. It is neatly organized in one matrix form which can easily be imported in Python or R to perform complex analysis. But usually, raw data does not look like this. It looks something like this -
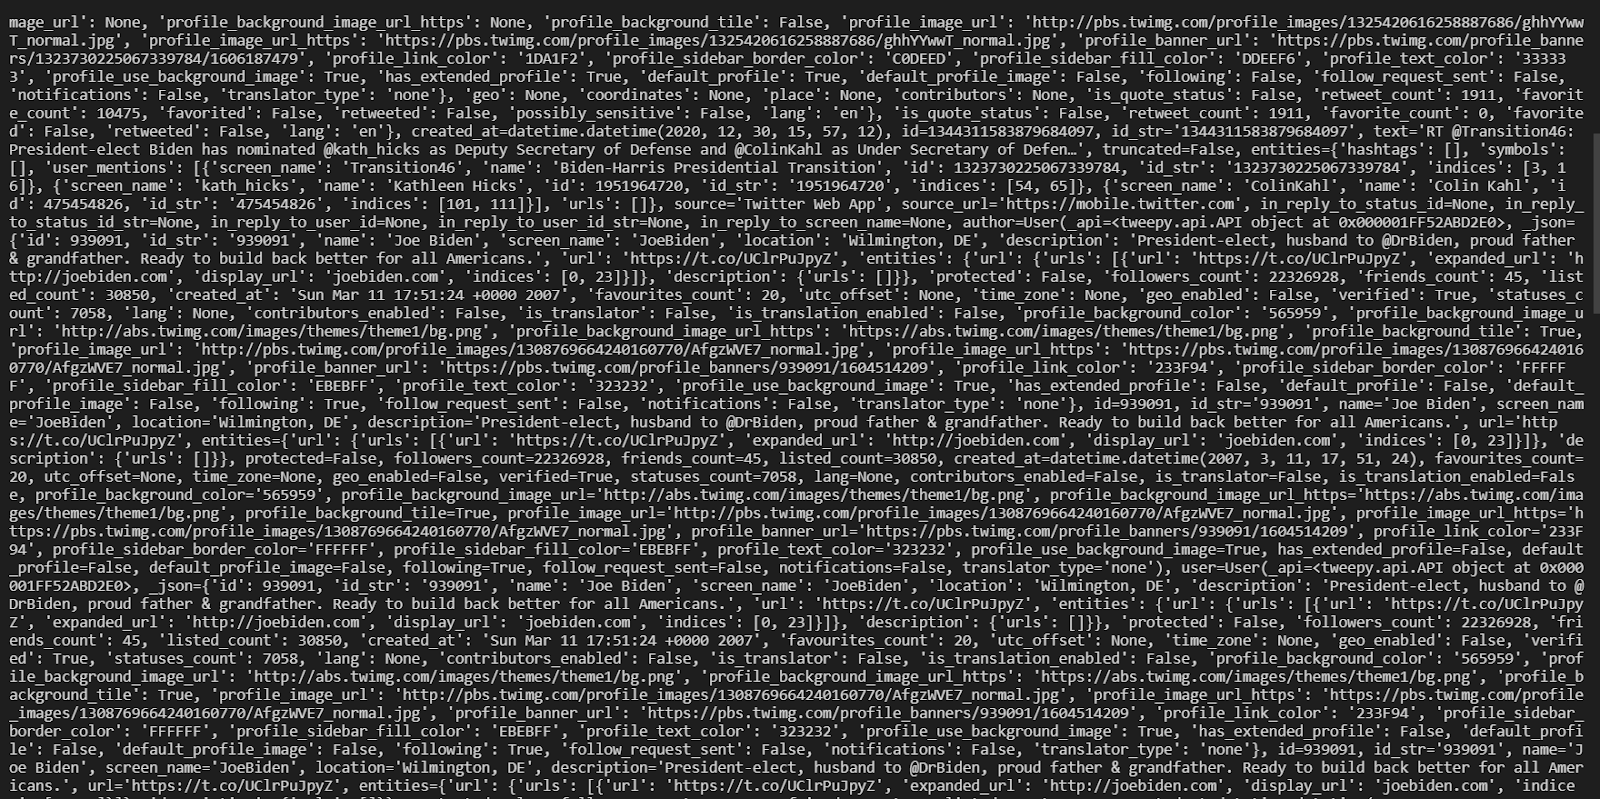
Makes you dizzy right?
This is the result of a query passed using Twitter API to get the past 20 tweets of Joe Biden. You cannot perform any form of analysis on such data (yet).
We will talk in detail in detail about the components of raw and tidy data later.
Benefits of data cleaning

As mentioned above, a clean dataset is necessary to produce sensible results. Even if you want to build a model on a dataset, inspecting and cleaning your data can improve your results exponentially. Feeding a model with unnecessary or erroneous data will reduce your model accuracy. A cleaner dataset will give you a better score than any fancy model. A clean dataset will also make it easier for others in your organization to work on it in the future.
Features of good quality data
After performing data cleansing, you should have at least these things -
- Your original raw data
- The clean dataset
- A codebook which describes all the variables in the dataset
- An instruction list that contains all the steps performed on the raw data which resulted in the clean data
We can say that the data is in its rawest form when it satisfies the following requirements -
- No software has been applied to it since it has been handed to it
- No manipulation has been performed on the data.
- No summarization has been performed
- No data points have been removed from the dataset
After processing the data, it should meet these requirements -
- Each row should have only one observation
- Each column should have only one variable
- If data is stored in multiple tables, make sure that there is at least one column that is common between the tables. This will help you to extract information from multiple tables at once if need be.
- Add a row at the top of each column containing the name of the variable.
- Try to make the variable names human readable. For example, use Project_status instead of pro_stat
- All steps used in processing should be recorded so the whole process can be reproduced from the beginning
The codebook is necessary for anyone who is looking at your data for the first time. It will help them to understand the basic form and structure of the dataset. It should contain -
- Information about the variables and their units. For example, if the dataset contains the revenue of a company, make sure to mention if it is in millions or billions of the currency.
- Information about the method of summary. For example, if yearly revenue is one of the variables, mention what method you used to arrive at the figure, whether it was the mean or median value of the revenue.
- Mention the source of your data, whether you collected it yourself using a survey or obtained it from the web. In that case, mention the website as well.
- A common format for this is a .doc, .txt or a markdown file (.md).
The instruction list is to make sure that your data and research is reproducible. Using the instruction list other data scientists in the data community can verify your results. This increases the credibility of your research. Make sure to include -
- The computer script
- The input to this script should be the raw data file
- The output should be the processed data
- There should be no user-controlled parameters in the script
Terms used in data cleaning
- Aggregate - Using multiple observations to provide a summary of some form of the variable. Commonly used aggregating functions are .sum(), .mean(), etc. Python provides the .aggregate() function which can perform multiple functions simultaneously.
- Append - Append implies to join vertically or stack two or more dataframes, lists, series etc. Use the .append() function to append dataframes.
- Impute - In general statisticians define imputation as the process of filling missing values. We will talk about imputation in more detail later in the blog.
- Deduping - Deduping is the process of removing duplicate observations from the dataset. It is discussed in greater detail later in this blog.
- Merging - Merging and appending are the most confusing terms in data cleaning. Merging two dataframes also involves joining them together. The only difference here is that we are joining them horizontally. For example, if we have two datasets, one having users’ Facebook data and the other contains users’ Instagram data. We can merge these two datasets based on the email id (common column in both datasets) used by the users as this will most likely be common for a certain user.
- Scaling - Scaling or normalization is the process of reducing the range of a feature and bringing it between 0 and 1. This is used to prepare the data for building a machine learning model on it. ML algorithms assign a higher weight to high values and lower weight to a low value. Scaling will take care of this high variation in values.
- Parsing - Parsing is the process of converting data from one form to another. Earlier in the blog, we looked at raw data from a Twitter API. That data is of no use in its raw form so we need to parse it. We can have each tweet as an observation and each feature of the tweet as a column. This will make the data presentable and readable in a table form.
Steps to clean your data
There are a few steps that, if followed properly, will ensure a clean dataset.
- Have a good look at your data and understand the basic problems that are occurring in it
- List all the basic issues and analyze each problem individually. Try to estimate the source of the problem
- Clean the dataset and perform exploratory analysis again
- Check for post-cleaning problems
Understand your data
One of the first steps to perform when you receive the data is to get to know what you have received. Understand what the dataset contains - the variables in it, their type, number of missing values and so on. Throughout this blog, we will be using the synthesized customer transaction data for a bank. The dataset is available here.
First, read the excel file and use the .head() and .info() methods to get a summary of the dataframe.
The .head() method will show you the first 5 rows of the dataframe.

df.info()
The .info() method will provide a concise summary of the DataFrame.

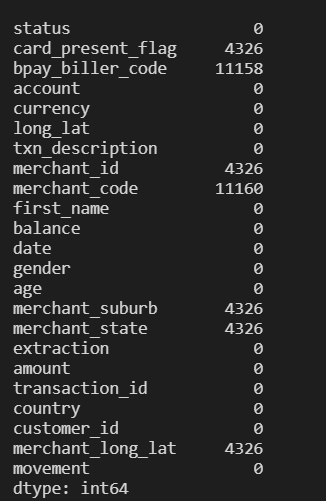
You will get an output that resembles something like this. This shows the column names, the number of non-null values in each column and the data type of each column.
Although this indirectly shows the null values in each column, you can also use .isna() and .sum() to get the number of null observations in each column.
.isna() will return a boolean array. 1 if the observation is null or 0 if the observation is not null.
df.isna().sum()
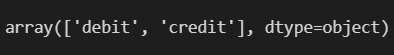
You can also find unique values in a particular column using .unique()
To observe unique values in the movement column, we use -
df.movement.unique()
These steps should give you a basic idea of what cleaning must be done on the data.
Basic problems to be solved while cleaning data
Some of the basic issues seen in raw data are -
Null handling
Sometimes in the dataset, you will encounter values that are missing or null. These missing values might affect the machine learning model and cause it to give erroneous results. So we need to deal with these missing values appropriately. This issue can be dealt in multiple ways -
- The easiest way to deal with this is to just ignore the observations having missing values. This is feasible only when the missing observations make up for a small fraction of the entire dataset. Neglecting a large number of observations might shorten your database and give false results. This can be by using the df.dropna() method.
- Another way is to impute the missing values. This means you can identify what value could have been the missing value. This can be done by taking the mean/ median values of the variables or find similar observations and impute the missing value accordingly. Mean should be used only when you have a normal distribution, i.e. the data is not skewed. Median should be used in case of skewed data. This can be done by using the df.fillna() method.
- Sometimes missing values may themselves indicate some data. For example, some people might prefer not to align themselves with any gender. These observations cannot be classified as missing. The best thing to do in this case is to just let these observations be as they are.
Duplicate values
There may be duplicate values in the dataset. This may happen due to human error while gathering the data or may occur while merging datasets from different sources. The best way to deal with it is to remove duplicate values. This can be done by using the df.drop_duplicates() method.
Outliers

Outliers are values which are unusually large or small for the column. Their deviation from the mean is much larger than the standard deviation of the variable. However, terms like ‘much larger and smaller’ are very vague and do not provide a universal value to consider an observation as an outlier.
Generally, a value is an outlier if it lies beyond 1.5*IQR. IQR stands for Inter-Quartile Range.
For example, if the IQR is 100 and Q1 and Q3 values are 50 and 150 respectively. Therefore an observation would be an outlier if it lies below Q1 - 1.5*IQR, i.e. below 50 - 1.5*100 = -100. A value lying above Q3 + 1.5*IQR would also be an outlier.
Some machine learning models, like regression, are susceptible to outliers. So they should be removed but only after thoroughly scrutinizing the cause of the outlier.
String cleaning
Irregularities can occur in a string variable. These can occur either due to human error or when data is collected from different sources. These cover an extensive range and can vary from data to data. Methods for solving this can also vary from user to user. It usually depends on the problem. Most common errors are spelling mistakes and different formats for writing the same observation. Spelling mistakes are difficult to solve. If they are small in number, do them manually by searching for that observation. If spelling errors cause a big issue, they can be found by using Fuzzy Matching. The second issue can be solved by using the regex library in python. It uses partial matching to find and replace. It can also be used in standardization to remove special characters and keep only alphanumeric characters in a string.
For example,
import regex as re
x='abc[#4 6a}'
x=re.sub(r"[^a-zA-Z0-9\s]","",x)
x
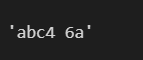
Here we can see that this expression re.sub(r"[^a-zA-Z0-9\s]","",x) removes all the characters which are not alphanumeric or white space. So we can use regex to perform pattern matching.
Standardization
Standardization of data implies making all the observations in one variable of the same kind. For a numerical variable make sure all the observations have the same units. Make sure to mention the unit of measurement in the column name or the codebook.
String variables must all be in uppercase or lowercase as this makes them easier to search at any point.
Dates should be of the DateTime format. It is the universally used and preferred format for dates and times. For human interpretation, the dates should either be mentioned in dd/mm/yyyy format or mm/dd/yyyy format and the format used must also be mentioned.
Data cleaning for trading
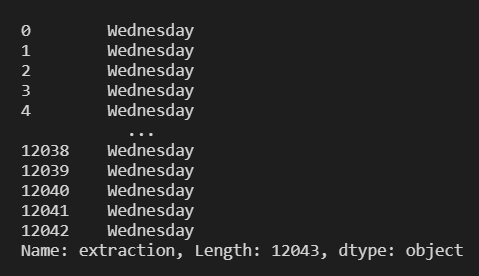
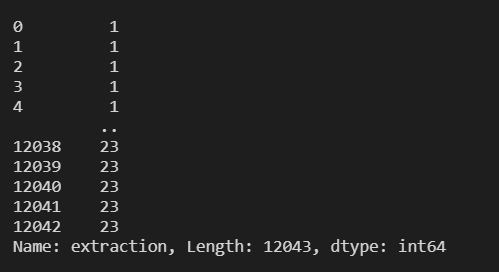
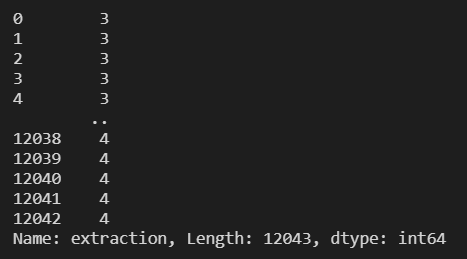
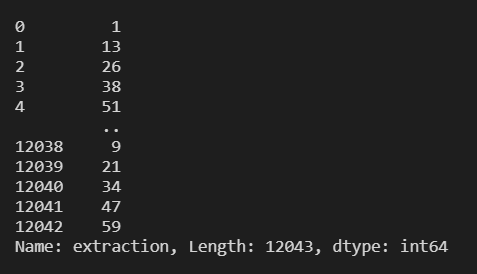
One of the major issues in the trading data is DateTime irregularities. Your dates and time in the data should be in the datetime format in Python. It makes it easier to extract individual date and time from the column if needed. In the bank transaction dataset, the date column is already in the datetime format. So, we will work with the extraction column in the dataset. To convert the column to datetime, use the pandas.to_datetime() function.
import datetime as dt
df.extraction=pd.to_datetime(df.extraction)
df.extraction

Here you can see that the data type is datetime64.
You can do a lot of manipulation with datetime objects.
Here are a few examples -
df.extraction.dt.day_name() #will return day of the week
df.extraction.dt.hour #returns the hour of the day
df.extraction.dt.quarter #returns which quarter of the year is it
df.extraction.dt.minute # returns minute of the hour
The datetime library is extensive and useful, especially while working with time series. The detailed functions of datetime can be found here.
Pre-existing softwares
All these steps might also become quite tedious to work on when you have a recent deadline looming over your head. In such situations, there are certain software and websites that will perform all this for you!! Here is a comprehensive list of websites that you can access to make your work easier.
Resources to learn data cleaning
For more in-depth information about data cleaning methods and practices, here are some useful links -
- Data Cleaning: Problems and Current Approaches
- The Ultimate Guide to Effective Data Cleaning (Free eBook)
- R Programming for Data Science (free eBook)
- Jeff Leek’s GitHub Repositories
- Financial Data Science & Feature Engineering | Dr. Ernest P. Chan | Quantra by QuantInsti
Frequently Asked Questions
What is the difference between data cleaning, data mining and data wrangling?
Data cleaning is the process of removing or correcting inaccurate or incomplete data. Different techniques discussed above can be used to perform data cleaning. Data mining on the other hand is the process of extracting valuable information from the clean data to derive inferences from. The entire process of data cleaning and data mining, when performed together, is called data wrangling.
What is reproducible data and why is it important?
Reproducible data implies that your data processing method must be recorded in such a way if someone else uses the same process on the same data, they must come to the same conclusion. For this, you must not make any changes to the raw data manually. A copy of raw data must be kept as it is for use by others. Doing this will ensure that your dataset is credible and can be trusted by others for their use.
What are some reliable and free data sources?
One of the methods to collect data is from websites, getting their raw text data and then cleaning it. Another way is to get data from websites like Kaggle, UCI Machine Learning repository and official government websites. A very useful article here contains a comprehensive list of dataset. Additional websites include -
- FiveThirtyEight
- BuzzFeed News
- Socrata
- Awesome-Public-Datasets on Github
- Google Public Datasets
- Academic Torrents
- Quandl
- Jeremy Singer-Vine
References
- https://pandas.pydata.org/pandas-docs/stable/index.html
- https://en.wikipedia.org/wiki/Data
- https://github.com/jtleek/datasharing
- https://github.com/jtleek/data
- https://www.ibm.com/developerworks/library/ba-cleanse-process-visualize-data-set-1/index.html
- https://github.com/jtleek/ads2020/blob/master/docs/01-week.md https://www.interviewqs.com/blog/free-online-data-sets
Conclusion
In conclusion, data cleaning is an important part of the data processing pipeline. Without it, the analysis and machine learning modelling will fail and give misleading results. We have discussed what makes a dataset ‘clean’ and the do's and don’t s while processing data. We now know how to impute null values, handle duplicates and outliers, standardise data and deal with misleading strings. You can also automate your data cleaning using pre-existing softwares! As the popular saying goes, ‘Cleanliness is next to Godliness’, keep your data clean and your results cleaner. To improve your data cleaning and preprocess price data to resolve outliers, duplicate values, multiple stock classes, survivorship bias, and look-ahead bias issues and many more techniques, have a look at the Data & Feature Engineering for Trading course on Quantra today!
Disclaimer: The views, opinions, and information provided within this guest post are those of the author alone and do not represent those of QuantInsti®. The accuracy, completeness, and validity of any statements made or the links shared within this article are not guaranteed. We accept no liability for any errors, omissions or representations. Any liability with regards to infringement of intellectual property rights remains with them.
