
By Mario Pisa Peña
In this post, we will review the well-known technical analysis pattern called Head and Shoulders and we will analyze the trading rules that will allow us to take advantage of this price configuration to take a position in the market.
Candlestick patterns are one way to interpret the price trend of a particular asset.
The main points we will review in this post are:
- What is the Head and Shoulders pattern?
- Anatomy of Head and Shoulders pattern
- Formation of the Head and Shoulders pattern
- The relevance of the neckline
- The role of Volume
- The Head and Shoulders chart
- Trading the Head and Shoulders pattern
- Head and Shoulders pattern recognition
- Technical Analysis - Head and Shoulders pattern
- Conclusion
What is the Head and Shoulders pattern?
The Head and Shoulders pattern is one of the best-known patterns in technical analysis. For the quantitative side of confirming this pattern, our guide on technical analysis using Python demonstrates how to code volume-based and momentum indicators like RSI and ATR that traders use alongside chart pattern signals. It’s a complex and subjective pattern formed on market top or bottom.
The formation is considered a trend reversal pattern because, after an uptrend/downtrend, the price begins to get congested and ends up turning around.
People all over the world know and pay attention to this price formation and there are many attempts to systematize the detection and exploitation of this figure - the Head and Shoulders pattern in Trading.
Anatomy of Head and Shoulders pattern
We are going to describe here the Head and Shoulders Top pattern, the bottom pattern must be considered a mirror of this and inverting the criteria too.
The formation of a Top Head and Shoulders pattern is a price configuration that requires a rising trend.
The formation of a Top Head and Shoulders pattern is a price configuration that requires a rising trend.
- Initially, a peak is formed, like any other in the rising trend,
- A second peak higher than the first is formed and finally,
- A third peak is formed lower than the second peak.
The first and third peaks are shoulders and the second peak, the highest, is the head.
Formation of the Head and Shoulders pattern
Let's see step by step how the head and shoulders pattern is formed. Here we can see the iShares Silver Trust (SLV) chart.
Step 1
Initially, we have an uptrend, at this moment it’s not possible to distinguish or even intuit the pattern we are looking for. At the moment we only have a rising trend. In the below picture, we can see a new recent peak with retracement. 
Step 2
In the second step, the price makes a new peak higher than the previous one and again with retracement that penetrates the ground of the previous peak or support level. This is interesting, as if the retracement were greater than the first peak, we would still consider it a rising trend.
Anyway, we can only observe that the rising trend is in doubt, although we can not assume that the figure of head and shoulders is forming, we can draw a support line between the two bottoms.
Anyway, we can only observe that the rising trend is in doubt, although we can not assume that the figure of head and shoulders is forming, we can draw a support line between the two bottoms.
Step 3
In the last step, a third peak is formed, smaller than the previous one, this one can surpass the first peak or not and also has retracement. Finally, we can distinguish a possible figure of head and shoulders, although it is not complete until the retracement of the third peak, breaks the support line that we had drawn that, now, we can call it neckline. 
The relevance of the neckline
It is necessary to wait for the pattern to be completed with the neckline breakout because sometimes the price remains to consolidate for a while or continues its course upwards.
If the price breaks the neckline, we can estimate a price target for a short position; the target is estimated by measuring the height from the neckline to the peak of the head and projected from the break point down. This objective should be considered an estimate and is very useful for calculating the hypothetical risk/benefit of operation with this figure.
Sometimes a pullback to the neckline occurs offering new opportunities for short selling and a stop-loss can be placed above the neckline.
The role of Volume
The volume is an aspect to take into account although it is not determinant.
- In the first peak, the volume is high, as usually corresponds with a rising trend.
- In the second peak, the head, the volume is usually lower than in the first, this is a clear indicator that the new peak is not supported by many purchases, at least not as many as in the first peak and finally,
- In the third peak, the volume is lower than in the second peak, again indicating that neither the price has been able to overcome the previous peak, nor the volume has been strong enough for the price to continue rising.
- In the breakout, the volume usually grows again although it is not a necessary requirement but a good signal.
The Head and Shoulders pattern chart
Below we can see the complete figure with the annotations that reflect the described steps. 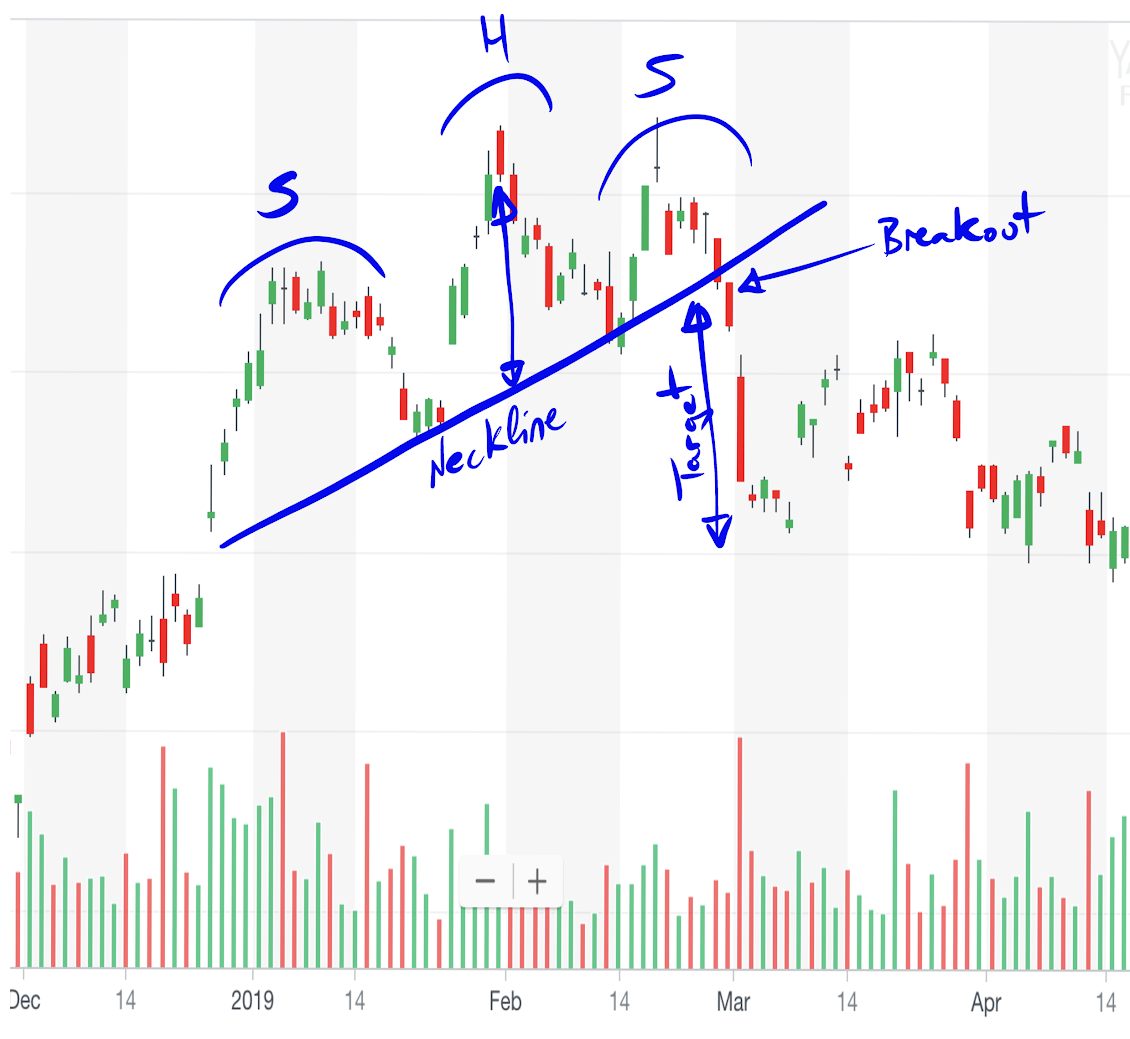
It can be clearly seen how the first peak (the right shoulder) is formed from the end of December 2018 until the middle of January 2019 approximately.
Then the head begins to form to its maximum just at the beginning of February, to begin to fall and form the second bottom in mid-February.
At this point, a hypothetical neckline could be drawn as a support line, which would only be confirmed if the third shoulder is formed.
Finally, from February 15 to the end of February the second shoulder is formed and we can confirm the neckline, when the breakout occurs, we can take short positions with a price objective equal to the height that goes from the base to the peak of the head.
It is also interesting to note the volume, which in the first shoulder is greater than the volume that occurs in the head and the third shoulder, then shoot in the breakout.
Trading the Head and Shoulders pattern
This price formation has a good success rate according to Bulkowski studies, the pattern is completed when the bottom of the third peak crosses the neckline. It’s common for the price to present a pullback and offer a second opportunity to trade the formation.
The target for the take-profit can be estimated by measuring the vertical from the neckline to the peak of the head. This distance is projected from the breakout point and marks a fairly approximate target price.
It is usual to adjust a stop-loss above the neckline and if the price exceeds the second shoulder (third peak) it is worth taking upward positions.
Head and Shoulders pattern recognition
The Head and Shoulders formation is a very subjective figure and therefore it’s difficult to characterize mathematically, which would give us the possibility of systematizing operations when this price configuration occurs.
Even so, there is no doubt that there are many eyes on this configuration and many traders eager to see the figure completed.
Bulkowski has statistically characterized the behaviour of the figure, but it is under his expert judgment that determines whether or not the Head and Shoulders pattern exists, that is to say, it is a subjective interpretation.
Technical Analysis - Head and Shoulders pattern
There have been numerous other attempts to mathematically characterize the figure and therefore systematically check the ability of the figure to generate positive returns.
The most notable examples are:
The most notable examples are:
- the Foundations of Technical Analysis: Computational Algorithms, Statistical Inference, and Empirical Implementation study by Andrew W. Lo, Harry Mamaysky and Jiang Wang, who use a kernel regression estimator, and
- the A New Recognition Algorithm for “Head-and-Shoulders” Price Patterns study by Terence Tai Leung Chong and Ka-Ho Poon, makes an improvement to the previous one using a noise filter to improve accuracy.
These studies still need to geometrically characterize the figure, and this is the biggest problem.
On the other hand, Shengnan Li’s Searching for Head and Shoulders Bottom Patterns under Directional Changes study uses the Directional Changes technique to determine the price configuration. Yet, it also faces the problem of geometric characterization of the figure.
Discovering patterns in price in a systematic way for Head and Shoulders configuration or other patterns of technical analysis remains a relevant study area where Machine Learning and Digital Signal Processing (DSP) techniques probably offer the most promising techniques.
Conclusion
The Head and Shoulders pattern is a widely known pattern and deserves the attention of numerous traders around the world. Like all price configurations, they are difficult to characterize and therefore systematically exploit.
A source of information to take into account for the technical analysis patterns is the library of patterns of Bulkowski, who defines them strictly and has characterized them statistically.
In order to systematize the exploitation of technical price configurations, there are numerous studies and it is an open research field, the mentioned studies must be taken into account.
Apart from understanding patterns to make effective decisions, you can build indicators to perform a better analysis of the trends in the market which will only help in making you a better trader.
You can learn to use 15+ trading strategies including Statistical Arbitrage, Machine Learning, Quantitative techniques, and Options pricing models and more. This learning track is perfect for traders and quants who want to learn and use Python in trading.
References
- Technical analysis: The complete resource for financial market technicians by Charles D. Kirkpatrick II and Julie R. Dahlquist.
- The pattern site by Thomas N. Bulkowski.
Disclaimer: All investments and trading in the stock market involve risk. Any decisions to place trades in the financial markets, including trading in stock or options or other financial instruments is a personal decision that should only be made after thorough research, including a personal risk and financial assessment and the engagement of professional assistance to the extent you believe necessary. The trading strategies or related information mentioned in this article is for informational purposes only.
