
By Vibhu Singh
If you are new to trading, you might have heard of technical indicators. Technical indicators such as moving average, relative strength index are some of the most common and popular technical indicators that traders use on a daily basis to predict the price movement of a security. Technical indicators are widely used in quant trading as objective, rule-based inputs that remove emotion from buy and sell decisions. Once you understand how each indicator works, the next step is coding them yourself our guide on technical analysis using Python walks through the implementation of moving averages, Bollinger Bands, RSI, and more with full code examples. In this article, we will use such technical indicators to create and backtest a trading strategy on the Blueshift platform.
But before that, we will cover the following topics to understand the technical indicators better.
- What is Technical Analysis?
- Difference Between Technical Analysis and Fundamental Analysis
- What Are Technical Indicators?
- Why Do We Need Technical Indicators?
- What is the Best Combination of Technical Indicators?
- Technical Analysis Library (ta-lib)
- Trading Strategy Using Ichimoku Cloud and RSI
- Limitations of Technical Indicators
- Popular Books on Technical Indicators
What is Technical Analysis?
Technical analysis is a method used to forecast the future price movement of a security by analysing the past trading activity and historical data such as price and volume.
It is based on the assumption that all relevant information about a security is already present in its price. Based on these assumptions, technical analysts use various technical indicators and chart patterns to gauge the trend, momentum and overall sentiment behind the movement of a security.
On the other hand, fundamental analysis is a method to access the intrinsic value of a security by analysing various micro and macroeconomic factors. The intrinsic value of a security is then compared with the current market price of a security. This helps in determining whether the security is overvalued, undervalued or fairly valued.
For example, to analyse the performance of an individual stock, fundamental analysts concentrate on various factors such as company’s earnings, price to earnings ratio, profit margin and other financial metrics. And to analyse the overall health of an economy, fundamental analysts rely on the macroeconomic factors such as GDP, interest rates, inflation.
Difference Between Technical Analysis and Fundamental Analysis
| Technical analysis | Fundamental analysis |
|---|---|
| Technical analysis uses chart patterns, historical price, volume and open interest (only derivatives) to predict the future price movement of a security. | Fundamental analysis uses micro and macroeconomic factors to find the intrinsic value of a security. |
| Technical analysis is typically used for short-term trading | Used for long-term investment |
| Trading decisions are based on the technical indicators such as moving averages, oscillators, and momentum-based indicators. It also uses Trading Candlestick Patterns: Doji, Morning star. | Factors such as revenue, earnings, P/E ratio, profit margin are used to make an investment decision. |
You can also check out this video that thoroughly explains the difference between technical analysis and fundamental analysis.
What are Technical Indicators?
We have used technical indicators many times in the previous parts of this article.
But what exactly are technical indicators?
Technical indicators are mathematically derived representations of price, volume, to detect price movement of a security. One of the examples of technical indicators is the moving average which is used to identify the trend of securities.
Moving average is the average of the specified data field such as price for a given set of consecutive periods. As new data becomes available, the average of the data is computed by dropping the oldest value and adding the latest one.
Let’s say you have the daily price data of a security and you need to calculate the moving average with period 5.
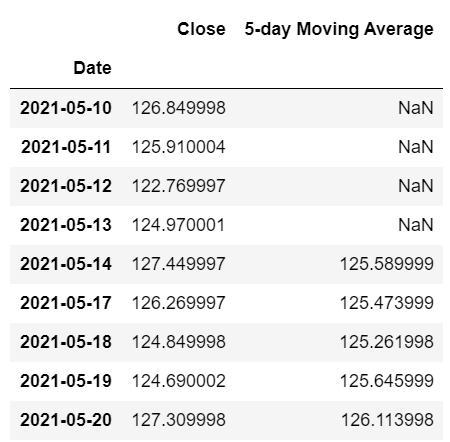
The first four values are NaN as you are calculating the moving average for the 5-day moving period. The first moving average is calculated for the ‘2021-05-14’, which is the average of the last five day prices from ‘2021-05-10’ to ‘2021-05-13’. Similarly, the moving average for ‘2021-05-17’ is the average of prices from ‘2021-05-11’ to ‘2021-05-14’.
The purpose of demonstrating the calculation of moving average is that we have used the price of a security and did some simple mathematical computation. Similarly, all technical indicators are calculated using simple to complex mathematical formulas using the price and volume of securities. You can learn all about in this course on technical indicators python.
Why Do We Need Technical Indicators?
There are various benefits of technical indicators that make the life of traders easier.
Smoothing of the prices
The stock prices fluctuate rapidly and it is difficult to make a track. The technical analysis indicators such as simple or exponential moving averages smooth out the data. You can plot the moving averages of the prices which provides a better understanding of the movement of the prices.
Direction of the prices
Technical indicators provide an idea about the direction and strength of the prices of the securities. It tells the movement of the prices, upward or downward trend and also establishes whether the trend is stronger or weaker. This is important for the traders as it helps to determine the future price of the securities.
Support and resistance level
Technical analysis indicators help to determine the support and resistance levels. Support and resistance are specific levels in a price chart at which it is thought that the price will tend to stop and reverse.
Predict volatility
Technical indicators such as Average True Range (ATR) helps to identify the volatility in the market.
You can read more about Five Indicators To Build Trend Following Strategies.
Different Types of Technical Indicators
Technical indicators are broadly divided into the leading and lagging indicators.
Leading indicators
Leading indicators try to predict the price of a security by generating signals when the trend is about to start. These indicators use a shorter time period in their calculation, therefore leading the price movement. Some of the popular leading indicators are RSI indicator and stochastic oscillators.
Lagging indicators
Lagging indicators follow the price of the security and give signals after the reversal of the trend has started. Moving average is the most common lagging indicator.
Further, technical indicators can be divided based on the trend, momentum, volume and volatility. And these can be categorised as leading or lagging.
Trend Indicators
- Parabolic Stop and Reverse (Parabolic SAR): Parabolic SAR is a lagging indicator used to determine the direction and reversal of trend.
- Ichimoku cloud: Ichimoku cloud indicator serves as both momentum and trend indicator, and helps in determining the direction, momentum and support-resistance levels.
Momentum Indicators
Momentum indicators are used to identify the direction and the speed of price movement. Most of the momentum trading indicators use some kind of baseline or average to identify the direction of trend.
For example, price appearing below the average or baseline can be thought as bearish or bullish, depending on the type and calculation of the indicator.
- Moving Average Convergence Divergence (MACD): MACD shows the relationship between two moving averages of security’s price and can primarily be used to identify the trends.
- Stochastic Oscillator: It is a leading indicator used to identify oversold and overbought conditions.
- Relative Strength Index (RSI): RSI is a leading indicator used to measure the speed and change of price movements. It is used to identify the oversold and overbought conditions.
Volatility Indicators
These technical indicators measure the rate of price movement, regardless of direction.
- Bollinger bands: Bollinger band is a simple moving average of the price plotted above or below some standard deviation of the moving average. It is used to identify the trend and volatility of a security.
- Average True Range: Shows the degree of price volatility.
Volume Indicators
These technical indicators measure the strength of a trend based on traded volume.
- Chaikin Oscillator: Monitors the flow of money in and out of the market, which can help determine tops and bottoms.
- On-Balance Volume (OBV): Attempts to measure level of accumulation or distribution, by comparing volume to price.
What is the best combination of technical indicators?
Knowing which indicator belongs to which category is not enough, you must know how to combine indicators in a meaningful way to make better trading decisions. Combining various indicators in the wrong way can lead to misleading signals.
For example, combining indicators belonging to the same class such as MACD, RSI leads to redundancy and doesn’t add any value in the price prediction. Essentially both indicators provide the same signal because they examine momentum in price behaviour.
Therefore, it is important to combine technical indicators prudently to generate good trading signals. For example, a combination of RSI indicator and Ichimoku cloud is a better choice.
The RSI measures and identifies momentum plays and the Ichimoku cloud helps in identifying the direction of the trend.
We will use these indicators to create a trading strategy using the TA-Lib library.
Technical Analysis Library talib
Ta-Lib is one of the most famous technical analysis Python libraries developed by Mario Fortier library. It includes 150+ indicators such as MACD, RSI, Bollinger Bands and candlestick pattern recognition.
The installation of TA-Lib in Python is a bit tricky. But it is explained in a step-by-step manner in this article.
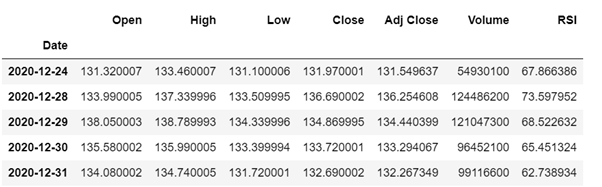
Calculating technical indicators using talib library is very simple. You just need to call a function and pass the required arguments. Let’s calculate the relative strength index in talib using a single line of code.
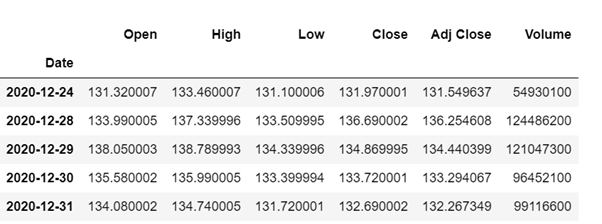
The price data of ticker ‘AAPL’ is stored in aapl_stock_data dataframe as shown below.
Trading Strategy Using Ichimoku Cloud and RSI
In this section of this blog, we will create a trading strategy using Ichimoku cloud and RSI. RSI has already been discussed in the above section. The Ichimoku cloud consists of five lines that help in determining the direction, momentum and support-resistance levels.
You can also read about the Ichimoku cloud to know more about it.
The steps involved in creating the strategy are:
- Step 1 - Get the price data
- Step 2 - Calculate RSI and Ichimoku cloud
- Step 3 - Generate trading signals
- Step 4 - Plot equity curve
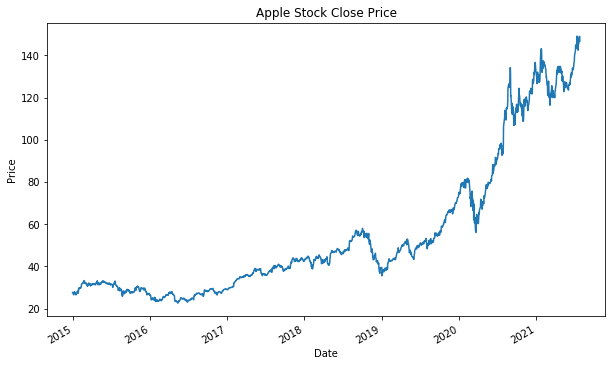
Step 1 - Get the price data
In this example, we have used the yfinance package to import the prices of Apple stock.
Step 2 - Calculate technical indicators
We will use the TA-Lib library to calculate the RSI values and the Ichimoku Cloud is calculated as follows.
Ichimoku cloud consists of five lines which are calculated as follows:
- Tenkan Sen or Conversion Line: (9-period-high + 9-period-low)/2
- Kijun Sen or Base Line: (26-period-high + 26-period-low)/2
- Senkou Sen A or Leading Span A: (Base line + Conversion Line)/2
- Senkou Sen B or Leading Span B: (60-period-high + 60period-low)/2
- Chikou Span or Lagging Span: (Close of 30 periods ago)
The lookback periods for different lines can be changed according to the asset you are using.
Step 3 - Generate trading signals
When the Tenkan-sen Line is above the Kijun-sen Line and the candle is above the Senkou span A line and RSI is above 50, we will take a long position. When the Tenkan-sen Line is Below Kijun-sen Line and the candle is below Senkou span B line and RSI is below 50, we will take a short position.
Step 4 - Plot equity curve
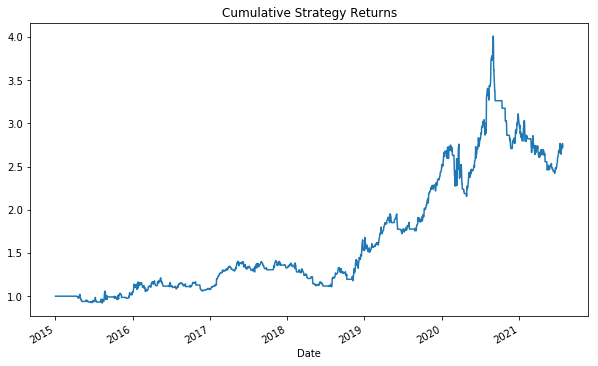
You can try this strategy on Blueshift by clicking the button below!
The strategy returns since 2015 are as follows.

Limitations of Technical Indicators
There are no techniques that use past prices to predict the future movement with certainty. Technical analysis and technical indicators are also not flawless and error-free. Therefore it is important to be aware of its limitations.
Delayed Signals
Lagging indicators such as MACD provide trading signals with a certain delay in relation to actual price changes. Therefore they serve more to confirm a movement rather than to predict it.
Accuracy
Technical indicators are used to predict the price movements of the prices. However, the predicting accuracy is not 100%. In some cases, indicators signal to buy the asset but asset price may decrease after the entry.
Mixed Signals
When you are using multiple indicators, it is possible that one of the technical indicators will show a buy signal and another indicator will show a sell signal. This will lead to confusion and might end up making the wrong decisions.
Frequently Asked Questions about Technical Indicators
Can technical indicators be used only for intraday trading?
Answer: Technical indicators can be used on all time frames from 1-min to monthly chart. However, depending on the time frames you need to optimise the parameters of the technical indicators. For example, the lookback period for RSI for intraday trading might be different from the longer time frame strategy.
How many technical indicators are there?
Answer: On a broad level, there are four types of indicators which are trend, momentum, volume and volatility. We have discussed these indicators in this article. The comprehensive list of all indicators can be found here.
How to learn about technical analysis?
Answer: There are lots of free and paid resources available on the technical analysis which you can find on the web.
Popular Books on Technical Indicators
- Getting Started in Technical Analysis by Jack Schwager
- Technical Analysis Explained by Martin Pring
- Technical Analysis Using Multiple Timeframes by Brian Shannon
Conclusion
Technical indicators are one of the widely used techniques among traders to generate trading signals. Python libraries like Pandas and TA-Lib made it easier to calculate technical indicators. You can calculate the value of any technical indicators in a single line of code in Python and backtest the trading strategies using that.
In this blog, we have covered the difference between technical and quantitative analysis and learned different types of technical indicators. We also created a trading strategy by combining two technical indicators.
You can explore Quantra’s Python for Trading and Swing Trading courses to dive deeper into the concept of technical indicators, backtesting trading strategies in Python.
Disclaimer: All data and information provided in this article are for informational purposes only. QuantInsti® makes no representations as to accuracy, completeness, currentness, suitability, or validity of any information in this article and will not be liable for any errors, omissions, or delays in this information or any losses, injuries, or damages arising from its display or use. All information is provided on an as-is basis.
