By Prachi Joshi
“The goal is to turn data into information, and information into insight.” - Carly Fiorina.
Have you wondered how Spotify prepares your daily playlists overnight based on your liking? Or how does Google complete your search before you even type the complete sentence? How does Netflix or Amazon Prime predict all the shows of your preference? How do they do it? What could be the process behind this? These are a few questions we all ponder upon from time to time. This is not magic, it’s data science!

To give you a quick brief about data science, it is nothing but the study of data. Data Science is a field of exploring. It combines domain knowledge, programming, statistics, communication, and problem-solving skills to extract valuable insights from data. Data science is changing the world around us and it is affecting and influencing our everyday decisions from what you add to your shopping cart to who you vote for. With the mad explosion in data, the odds of integrating data science with any industry are really in our favor. In this data-driven world, opportunities and applications are growing and will continue to expand.
“There were 5 exabytes of information created between the dawn of civilization through 2003, but that much information is now created every 2 days.”
Eric Schmidt, Google’s CEO.

Over 90% of the data that we have today has been generated in the last two years. Data is increasing exponentially with about 2.5 quintillion bytes of data being created every day. The dramatic surge in data has created endless opportunities in data science paving ways for the unexpected.
This blog on ‘Steps in Data Science’ will walk you through a helpful framework to understand the process of data science. Using a case study on a food delivery app, we will try to break down the steps to help you learn the life cycle of any data science project.
In this blog, we will cover the following topics:
Understanding Data Science
Before we jump right into the case study, let’s watch this video on ‘Steps in Data Science’ to understand data science better.

The Rise of Food Delivery Markets

The shape of Food delivery market today is changing the meal eating habits of people all around the world. With just one download on your Iphone or Android, you can easily choose from a variety of cuisines, discount offers, order size, and save time, all this at the convenience of sitting at your home. At the moment, the food delivery industry is at its best. These kinds of services are not necessarily available in your local neighbourhood restaurants.
According to a research firm Cohen and Company, there will be a 12% rise in the food delivery apps in the coming 4 years. The downloads of these apps have already seen a 380% increase in the last 3 years. The effect is so large than some new restaurants are choosing to start as ‘cloud kitchens’, a restaurant with no kitchen and no waiting staff, operating 100% online.
What could be the possible problems faced by this industry, you ask? Managing timely delivery, maintaining food quality, coping with voluble requests, responding to customer queries and customer retention are a few challenges.
Let’s try to understand the 6 steps in data science using the example of ‘Zomato’ online food delivery app.
Defining the problem statement
The first step in data science is defining the problem statement. If you have a business problem that needs to be addressed, then it becomes important to ask a lot of questions. Recognize appropriate questions that could help solve your problem. It is important to understand and define an objective for the problem that needs to be tackled. When you ask relevant questions, you build a stronger problem statement. Curiosity is a key skill for any data scientist. He or she must have the curiosity to recognize relevant questions and the curiosity to find insights from data.
Skills required: Critical thinking, Curiosity, Domain Knowledge and Problem-Solving Skills.

A five star rated Chinese restaurant ‘ Tom’s Diner’ wants to continue being the best amongst its competitors. Tom’s Diner is listed as one of the best restaurants on Zomato, the food delivery app. Data science analysts working for Tom’s Diner would need specific information to help understand the structure of the restaurant and how it can be improved.
Analysts ask relevant questions to build a problem statement.
Questions like:
- What is the average time of delivery?
- Which area has the highest order rate?
- What is the most bought and the least bought food item?
- Are the customers satisfied with the quality and quantity of food?
- Are we addressing the negative reviews on the app?
- Is there a need to update the food menu and if there is, what do we add?
Similar questions can be asked to form a strong problem statement. The problem statement for this case study could be: What measures ‘Tom’s Diner’ should take to increase and improve its customer service and ratings?
Imagine this, you had a tiring day at work. You came back home only to find that there is no dinner because your cook hadn’t come today. You decide to order Chinese food from Zomato.
With so many options available, you choose to order chilli garlic noodles and a soft drink from Tom’s Diner. You chose Tom’s Diner restaurant because of its 5-star rating and it's in your budget. You select the quantity, add cooking instructions, and add your address for the restaurant’s reference. Then you make the payment and wait for the delivery.

Data Collection
The second step in data science is data collection. After defining the problem statement, it becomes important to fetch the right data. Data can be scraped and gathered from a variety of open data source platforms. There are also lots of data science projects available on open-source websites such as Github, Kaggle and Gapminder.
This can be collected through primary and secondary methods. The first method is Primary data collection. Primary method is well suited for empirical research. When there is no prior research done for a specific subject, then new data has to be collected. Secondary method uses the readily available data for any kind of research. Such data has already been used or collected by someone else. You can find such data on the internet, magazines, articles and almost anywhere. This method is called secondary data collection.
Skills required: Web scraping, Attention to Detail, Data handling etc.
Similar to you, there are a number of people who placed their order with the same restaurant. This creates a large pool of orders. This is called data collection.
A snapshot of the data collected for the 10 most recent orders in the last 5 minutes is shown below:

Data Quality and Remediation
The third step in data science is data quality and remediation. Due to the explosion of data, there is a lot of data on the internet. But these datasets are mostly imperfect. You can find missing values, inconsistent datatypes and misspelt attributes. Hence, the acquired data requires cleaning as it will improve the accuracy and quality of information. If the data isn’t cleaned properly, then analysis or insights drawn will be inaccurate.
Skills required: Attention to Detail etc
The restaurant receives your order. An employee starts working on your order. He checks your order and checks for the food item, the quantity of food, cooking instructions if any, and the delivery address. If he spots any unusuality or any missing information, he contacts the person of concern and confirms the information. This person can be the customer or the delivery agent. He then updates this information in the system. The cleaned data then can be used to perform analysis. This step helps you to build familiarity with data. This is data quality and remediation.


Data Analysis and Interpretation
The fourth step in data science is data analysis and interpretation. After this dataset is cleaned, we perform data analysis. It is a crucial step as it helps you to build familiarity with the data and extract useful insights. If you skip this step then you might end up generating inaccurate models and choosing the insignificant variables in your model. All the analysis which you perform in this step fall under Exploratory data analysis. Select and choose all the variables and parameters that can help you understand the structure of the dataset. Understanding what you could do with the data is really important. Here, you can play with data, create your own graphs and learn to derive inferences.
Skills Required: Programming, Statistics, Plotting skills etc.
Your order is allotted the required preparation and delivery time. A delivery executive delivers your order in no time. But always remember your reviews are valuable. The clean data set now gets segmented into various categories for better analysis. The appointed analyst creates a few parameters he considers important to increase restaurant’s productivity.
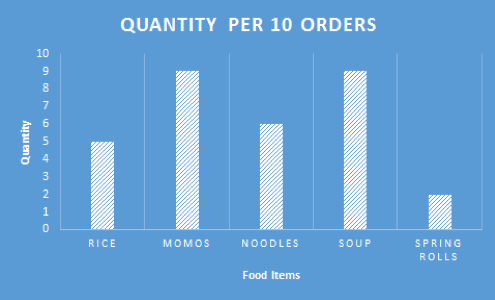
The categorized data is plotted to understand the relationships between the chosen parameters. Parameters like ‘current year sales’ against ‘previous year sales’ for noodles, momos and soup. This will help us understand if there is any improvement in sales. This is exploratory data analysis. This step is called data analysis and interpretation.
Now, below is a very small scale analysis using the 10 order data that was generated in the last 5 minutes. Similarly, you can do your own data analysis taking a large dataset. You can compare previous year sales with the current year sales. You can also analyse if the average delivery time has been improved from the previous year’s delivery time.
Average delivery time for the 10 most recent order: 38.1
Data Modelling
The fifth step in data science is data modelling. Data modelling focuses on how to organize the data. It uses flowcharts to represent the way data needs to flow. Modelling improves the structure of analysis and makes it easy for anyone to understand. Data modelling helps in identifying the flow of calculations. You could either use Statistics or Machine Learning to get the desired results based on the requirement. There are three basic styles of data model:
- Conceptual data models: Used to explore domain concepts with project stakeholders. This type of data model is a precursor to the other two.
- Logical data models: Used to explore and understand the relationship between the domain concept and problem domain.
- Physical data models: Used to design and understand the internal schema of the database between the columns and tables.
Required skills: Statistics, Machine Learning, Domain knowledge, Ability to draw flowcharts, Analytical skills etc.
On the basis of logical methods and analytical techniques, the analyst creates and adds a few columns and tables. He compares previous year sales and comes up with a model to create better strategies to market potential customers. The analyst examines by what margin has the sales shot up or plummeted. For this analysis, we will be using statistics and machine learning can also be used. This is data modelling and it helps in building business strategies.

Communicating the Results
The sixth step in data science is communicating the results. All these insights and numbers need to be communicated well. You create easy to understand reports & dashboards using graphs and charts to communicate your findings. These empower any viewer to communicate the business findings easily and give meaning to their decision making. Dashboards and reports give access to important metrics and form an effective foundation for further dialogue.
Skills Required: Matplotlib, Tableau, R, Shiny etc.

And you’ve successfully managed to complete your analysis. This is the final step in Data Science. The analyst uses graphics to visualize his findings. He uses graphs to explain parameters like most bought and least bought food items, time of food delivery, quality and quantity of food on the basis of the review. Finally, the analyst puts forward and communicates his findings for the owner of the restaurant to understand. Using the interpretation, the restaurant now decides to work on adding new food items, improving the food quality, food delivery time and also, revises the price of a few items. This is communicating the results.
Conclusion
Thus, we have covered the six steps in data science, along with the skills required in each step and how to perform these steps for any data science project. Now, using these steps you can voluntarily take up projects in your choice of domain and start practising. The more you practice, the better you’ll get at data science. Work on your skills. Improve your programming and statistics.
To learn these steps in further detail, you can enrol for the Intro to Data Science [Free Course] on Quantra where the learner gets acquainted with how to perform exploratory data analysis on the English Premier League which is a professional football league contested between 20 world-famous clubs. Imagine how much fun it would be to learn data science and draw insights on one of the most engaging and loved sports. Don’t you all want to find out 2019 EPL winner?
Happy learning!
Disclaimer: All data and information provided in this article are for informational purposes only. QuantInsti® makes no representations as to accuracy, completeness, currentness, suitability, or validity of any information in this article and will not be liable for any errors, omissions, or delays in this information or any losses, injuries, or damages arising from its display or use. All information is provided on an as-is basis.