
Selling volatility on indices is a proven profitable strategy. But, the return profile is skewed with fat loss tails. The COVID-19 crisis saw heightened volatility in the market and resulted in a drawdown for this popular strategy.
It’s a backtest of mechanically selling straddles on SPY ETF every week and holding till expiry. No delta hedging or loss management. DTE was between 45-60.
The aim is to see how bad it got during this time, plus the recovery phase if any. Coding it in python was straightforward but involved creating the correct dataframe which was the main challenge in the project.
This article is the final project submitted by the author as a part of his coursework in the Executive Programme in Algorithmic Trading (EPAT) at QuantInsti. Do check our Projects page and have a look at what our students are building.
About the Author

Siddharth Bhatia has been working since 2006 initially in Mumbai and currently Dubai, with specific trading experience since 2011. Starting off as a trader for a local UAE prop firm active in US and EU bond futures, he has experience in scalping and spread trading futures.
He then moved on to trading at a prestigious family office and managed a volatility trading book active in options on global indices and futures. He then worked for a wealth management firm and oversaw pricing and trading structured products and various protected/ tail risk strategies for the firm’s clients. Here, he also looked after portfolio management of a complex book containing structured products and funds.
Starting off on his own in 2018, he founded a proprietary trading and investment research firm called Third Group. Third Group is active in volatility trading and applies advanced quantitative analysis to develop and deploy trading strategies.
Siddharth is a CFA charterholder attaining charter status in 2012. He is a QuantInsti alumnus having passed out of batch 50 in 2021. He holds a keen interest in algorithmic trading, mainly in exploring all types of machine learning and Artificial Intelligence (AI) to gain an edge in the markets.
Strategy idea
- Choose the top 8 most liquid option chains on US stocks and futures
- Choose DTE: 35 – 25
- Short ATM Straddle plus long OTM strangle at 16-20 delta
- The quantity of Long OTM strangle should make the ATM vega neutral at the start of trade.
- Delta neutrality will be maintained by delta hedging once at open and once at close.
- Let positions expire.
Possible optimizable parameters
The possible optimizable parameters are as follows:
- Entry DTE
- Delta of the OTM wings
- Delta hedging frequency
- Vega neutrality weekly adjustments or not?
- Exit DTE(exit before expiry?)
- Extend to more markets like global futures, stocks and indices?
Data set to be used
As of today roughly these are the most liquid US options markets on a daily volume traded basis
- ES1 - Emini S&P futures
- AAPL - Apple
- TSLA - Tesla
- NIO - Nio ADR
- CL1 - WTI Crude futures
- GC1 - Gold futures
- ZC1 - US Corn
- AMD - Advanced micro devices
I will need past 3 years daily spot and option price. I have a funded IBKR account with paid subscriptions for these market data. I will attempt to retrieve using API.
Motivation for choosing
I have been trading this live for 2 years now with positive PNL. Want to check if this is a valid strategy to scale up and continue in long term, also to optimize for the best risk-adjusted outcomes.
Project outline
There are numerous studies and various commercial websites that talk about a famous strategy involving mechanically selling straddles and strangles on stock indices mainly the SPX. It’s deemed to be profitable in the long run due to a persistent market risk premium called the variance risk premium.
Strictly speaking this exists as an overpricing of implied volatility above the actual realized volatility of the index. Market participants over pay for options due to fear/demand hence options especially slightly longer term ones are overpriced (during normal market regimes marked by a downward sloping term structure).
I wanted to test a very simple strategy of mechanically selling straddles every week on the SPY ETF. For the avoidance of doubt, a straddle is an option position where one sells the At the money Call and Put option together for a net credit into the account.
It works when the underlying doesn’t move around too far from the chosen ATM strike at initiation. At expiry, if the underlying is at the original ATM strike price, then the straddle yields maximum profit.
Hence it can be seen that this position is a direct way to play volatility of the underlying because if the underlying moves farther away (shows more volatility) than what is priced in the straddle – that’s when we lose money.
Since the underlying can move, in practice, much more than normally measured standard deviations - this strategy carries a lot of risk. Its upside is limited to the credit received on initiation, but the downside risk is unlimited especially on the upside.
The strategy
Sell a 60 DTE( days to expiry) straddle on Monday. We have used premium options data from ORATS. These prices are essentially the close price (captured 5 minutes before close) of US markets. The data source uses endpoint REST URLs to retrieve all sorts of required data.
We chose around 60 days expiry as this falls on the point of the term structure with the most contango. Each straddle would be held till expiry, and simultaneous entries would occur every week.
Since the chosen DTE was around 8 weeks, there could be maximum of 8 straddles held each entered a week apart. 12.5% of capital would be dedicated to each straddle.
Coding the strategy in Python
The actual coding in python is straightforward.
- Create a dataframe with weekly entry dates.
- Using those entry dates as input to the REST URL we retrieve the expiry dates that correspond to each of those entry dates. It would be usually 45-60 days out.
- We then create a routine to retrieve the strike prices on the entry date. These strike prices are then entered into other REST URL to retrieve the option prices on any date needed after the entry date.
- In our case, we are holding till expiry so we retrieve the straddle price for the entry date and expiry date itself.
- Two columns are created cell by cell using the above routine to populate the straddle entry and exit price corresponding to the entry and expiry dates of the same row.
Note:
- Each cell here must be populated individually since the API doesn’t produce time series data but rather only individual data points.
- This does take some time to do hence the backtesting using this data source is a time-consuming affair.
- We have submitted along with code, the exported dataframe as a CSV file so one can just import it instead of retrieving all option prices from API all over again.
Results
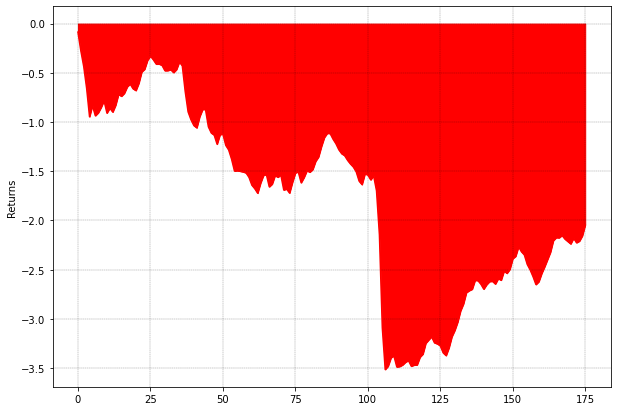
Finally, simple percentage returns are calculated using exit and entry prices. Cumulative returns are calculated and lastly, drawdowns are calculated.

Turns out this strategy performed very poorly. This dataset spanned the Coronavirus crash where the SPX fell 30% within a month and shot back up equally faster. All straddles entered in this regime suffered and rightly so, as the index was displaying serious volatility.
Conclusion
Mechanically selling straddles can be very risky, with a downside risk profile much worse than upside possible gains. Further research can be done on timing entries based on implied volatility levels or the shape of the term structure.
The complete Python code and related information is provided in the Python code below. You can download and refer to it.
If you want to learn various aspects of Algorithmic trading then check out this algo trading course which covers training modules like Statistics & Econometrics, Financial Computing & Technology, and Algorithmic & Quantitative Trading. EPAT equips you with the required skill sets to build a promising career in algorithmic trading. Enroll now!
File in the download
- Complete Python Code of the project
- Dataframe as a csv file
- Excel file
Disclaimer: The information in this project is true and complete to the best of our Student’s knowledge. All recommendations are made without guarantee on the part of the student or QuantInsti®. The student and QuantInsti® disclaim any liability in connection with the use of this information. All content provided in this project is for informational purposes only and we do not guarantee that by using the guidance you will derive a certain profit.
