Algorithmic Trading Stages Explained Simply

11 min read

By Sunil Guglani (Assistant Vice President at NCDEX)

Are you new to Algo trading? Confused about how to start, where to start?

There are lots of courses and content available on backtesting, technical indicators, Python for finance on the web.

Also, there is a good amount of stuff available on the benefits of Algo trading over manual trading. But if you want to develop your first algo, what are the stages you have to go through, there is limited information on this.

Note: These stages are purely based on my experience, it may/may not differ from standard procedures (which I could not find ☺).

Python Basics Handbook

I will try to explain this by taking a real trading strategy. Here are the stages I will cover:

Formulate the Trading Concept/Logic

First thing first, algo trading is not - rocket science..yes.. it is really not…it is just a puzzle, which you need to solve more effectively, efficiently than a few other people. And we know the puzzle..Buy at low and sell at high.

Not necessary to follow any existing theory or indicators or strategy. You don’t need to be a market expert. You can make your own if you are comfortable. (my first algo was an arbitrage across the exchange. I was an amateur and I didn’t even know the meaning of arbitrage at that time. ☺)

You need to answer following in this stage:

  1. What will be my logic to achieve my goal(Buy at Low and Sell at High)?
  2. What will be the frequency of my trades?
  3. Which segment will it work most effectively(Equity/Commodity/FX/Crypto..)
  4. How much should be backtesting period?
  5. Which automation tools/languages will be most useful for this logic?

Example: I think FMCG (Fast moving consumer goods) stocks are generally less volatile in nature and they revolve around the same price range. It makes me think that they are range bound and so they are mean reverting. Therefore I will try to apply some mean reversion technique in my strategy. Also, intraday prices are highly volatile therefore I will choose daily closing prices for calculation and trade.

Considering my above idea, my answers to the following are :

What will be my logic to achieve my goal (Buy at Low and Sell at High)?

I will be using mean reversion trading strategy. For this, I will use Bollinger band. Buy: if Close price goes below -2 standard deviation from the mean. square off position: if Close price goes above +2 standard deviation from the mean.

What will be the frequency of my trades?

Daily.

Which segment will it work most effectively (Equity, Commodity, FX or Crypto)?

I will use the equity cash segment.

How much should be backtesting period?

3 years (longer the better).

Which automation tools/languages will be most useful for this logic?

I am comfortable with Python. We should use the tools where we are most comfortable with.

Filtering criteria to choose the scripts

Great. You have achieved a big milestone. You have penned down the core logic and did high level planning for your algo.

If you observe, your logic will work best on some specific conditions and specific scripts. Remember you have already decided the segment in first stage.

The selection/filtration of scripts can be done before or during the trading hours (real-time). It all depends on your core logic.

Example:

As we have decided, we will use FMCG scripts and high liquid stocks only, therefore filtering criteria to be used as follows: a. Industry(FMCG). b. Volume>100000

Verification of Logic (at High Level)

Algo development is an expensive process, it requires a lot of effort and time. It is better to verify your Core logic at High level using a Visualization tool or excel.

It will save a lot of time later. You can use Tableau, power BI or just excel to write the logic and verify your logics. You can also use charting tools like trading view, investing.com or something similar.

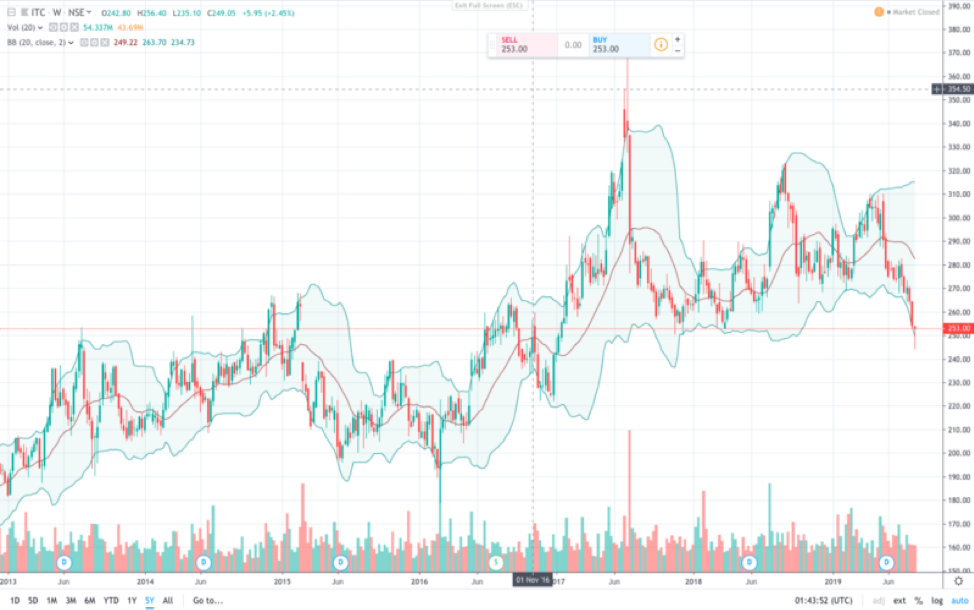
It is a 5 year graph of ITC Ltd on daily frequency. And SMA, STD(-2,+2) is applied on the 20 days lookback period. (Courtesy: tradingview.com). The visual below gives us confirmation about our logic.

Backtesting

Backtesting is the way of verification of your logic using historical price information. This stage helps in understanding how well the logic would have worked if you used this in the past. This stage gives an indication about the performance of your logic. It also gives you the opportunity to optimise the logic and its parameters.

One should consider the following parameters in this stage:

Various performance parameters

  • Returns
  • Max drawdown
  • Max continuous drawdown
  • Max profit
  • Max continuous profit
  • Number of transactions
  • Average returns per transaction
  • Transaction charges
  • Slippages,etc.

Few more points to focus are:

  • Stop loss/Trailing stop loss
  • Target price
  • Entry Criteria
  • Exit criteria

A very common mistake algo traders do is using the current price information in generating the trading signals. We should always use historical data in our logic and next price information for buy and sell signals.

Activities to perform are:

We need to perform the following activities in this stage:

  1. Import the necessary libraries
  2. Fetch the historical OHLC data for an instrument.
  3. Write the supporting functions to achieve our logic
  4. Generate the buy/sell signals using candlestick patterns
  5. Visualize the output
  6. Checking returns of the strategy

Analysis and visualisation of backtesting output data to understand the scope of optimisation in your algorithm.

Note: To review steps used in backtesting please refer to my article

https://medium.com/@sunil.guglani/how-to-develop-your-first-trading-bot-using-python-by-recognising-candlestick-patterns-a755f7fa6674

Example:

Import the necessary libraries

import pandas as pd
import numpy as np
from nsepy import get_history
import datetime
import seaborn as sns
import matplotlib.pyplot as plt
import plotly
import plotly.graph_objs as go
from plotly.offline import download_plotlyjs, init_notebook_mode, plot, iplot
------------------------------------------------------
'''
Function to fetch data from nsepy
'''
def Fetch_Historical_Data_nsepy(script,script_cat,fromdate,todate,mode):
    if mode=='nsepy':
        if (script_cat=='NSE_EQ')|(script_cat=='BSE_EQ'):
            try:
                df_stock_data = get_history(symbol=script, 
                                    start=fromdate, 
                                    end=todate)
            
            except (RuntimeError,ConnectionError):
                print ("Fetch_Historical_Data function, nsepy function: ",RuntimeError)
                df_stock_data = get_history(symbol=script, 
                                    start=fromdate, 
                                    end=todate)
            return df_stock_data
            
        elif script_cat=='NSE_INDEX':
            try:
                df_index_data = get_history(symbol=script, 
                                    start=fromdate, 
                                    end=todate,
                					index=True)
            
            except (RuntimeError,ConnectionError):
                print ("Fetch_Historical_Data function, nsepy function: ",RuntimeError)
                df_index_data = get_history(symbol=script, 
                                    start=fromdate, 
                                    end=todate,
                					index=True)
            return df_index_data

'''
Function to fetch data for the algorithm 
'''

def fetch_data(script) :
    todate=datetime.datetime.now().date()
    fromdate=todate-datetime.timedelta(days=365*4)
    script_cat='NSE_EQ'
    script=script

    mode='nsepy'
    df=Fetch_Historical_Data_nsepy(script,script_cat,fromdate,todate,mode)
    return df

------------------------------------------------------

'''
Function to fetch data from nsepy
'''
def Fetch_Historical_Data_nsepy(script,script_cat,fromdate,todate,mode):
    if mode=='nsepy':
        if (script_cat=='NSE_EQ')|(script_cat=='BSE_EQ'):
            try:
                df_stock_data = get_history(symbol=script, 
                                    start=fromdate, 
                                    end=todate)
            
            except (RuntimeError,ConnectionError):
                print ("Fetch_Historical_Data function, nsepy function: ",RuntimeError)
                df_stock_data = get_history(symbol=script, 
                                    start=fromdate, 
                                    end=todate)
            return df_stock_data
            
        elif script_cat=='NSE_INDEX':
            try:
                df_index_data = get_history(symbol=script, 
                                    start=fromdate, 
                                    end=todate,
                					index=True)
            
            except (RuntimeError,ConnectionError):
                print ("Fetch_Historical_Data function, nsepy function: ",RuntimeError)
                df_index_data = get_history(symbol=script, 
                                    start=fromdate, 
                                    end=todate,
                					index=True)
            return df_index_data

'''
Function to fetch data for the algorithm 
'''

def fetch_data(script) :
    todate=datetime.datetime.now().date()
    fromdate=todate-datetime.timedelta(days=365*4)
    script_cat='NSE_EQ'
    script=script

    mode='nsepy'
    df=Fetch_Historical_Data_nsepy(script,script_cat,fromdate,todate,mode)
    return df

Fetch the historical OHLC data for an instrument.

'''
Function to fetch data from nsepy
'''
def Fetch_Historical_Data_nsepy(script,script_cat,fromdate,todate,mode):
    if mode=='nsepy':
        if (script_cat=='NSE_EQ')|(script_cat=='BSE_EQ'):
            try:
                df_stock_data = get_history(symbol=script, 
                                    start=fromdate, 
                                    end=todate)
            
            except (RuntimeError,ConnectionError):
                print ("Fetch_Historical_Data function, nsepy function: ",RuntimeError)
                df_stock_data = get_history(symbol=script, 
                                    start=fromdate, 
                                    end=todate)
            return df_stock_data
            
        elif script_cat=='NSE_INDEX':
            try:
                df_index_data = get_history(symbol=script, 
                                    start=fromdate, 
                                    end=todate,
                					index=True)
            
            except (RuntimeError,ConnectionError):
                print ("Fetch_Historical_Data function, nsepy function: ",RuntimeError)
                df_index_data = get_history(symbol=script, 
                                    start=fromdate, 
                                    end=todate,
                					index=True)
            return df_index_data

'''
Function to fetch data for the algorithm 
'''

def fetch_data(script) :
    todate=datetime.datetime.now().date()
    fromdate=todate-datetime.timedelta(days=365*4)
    script_cat='NSE_EQ'
    script=script

    mode='nsepy'
    df=Fetch_Historical_Data_nsepy(script,script_cat,fromdate,todate,mode)
    return df

Write the supporting functions to achieve our logic

'''
# Function to backtest any strategy by using parameter         
    #Dataframe, 
    #strategy_type(long/short),entry_criteria,exit_criteria
    #positional_field ,price_field(example Close price),stoploss_pct(stop loss pct),target_pct,only_profit(should wait for trade to be in profit True/False)
'''
def backtest_strategy_stoploss(df, strategy_type,lst_entry_criteria,lst_exit_criteria, positional_field,price_field,stoploss_pct,target_pct,only_profit):
    df['buy_price']=0.0000
    df['sell_price']=0.0000
  
    df['buy_time']=None
    df['sell_time']=None
    exit_reason_field=positional_field+'_exit_flag'
    df[positional_field]=0
    df[exit_reason_field]=''
    pos=0

    last_buy_price=0.00
    last_sell_price=0.00
    
    for d in range(0,len(df)):
        entry_flag=lst_entry_criteria[d]
        exit_flag=lst_exit_criteria[d]
        curr_price=df[price_field].iloc[d]
        curr_time=df.index[d]
        stoploss_exit=False
        target_exit=False
        only_profit_exit=False
        exit_reason=''
        
        if stoploss_pct!=0:
            if (strategy_type=='long')&(last_buy_price>0):
                if ((curr_price-last_buy_price)*100/last_buy_price)0):    
                if ((last_sell_price-curr_price)*100/curr_price)0):
                if ((curr_price-last_buy_price)*100/last_buy_price)>target_pct:
                    target_exit=True
                    exit_reason='TRM'
            elif (strategy_type=='short')&(last_sell_price>0):    
                if ((last_sell_price-curr_price)*100/curr_price)>target_pct:
                    target_exit=True
                    exit_reason='TRM'

        if only_profit==True:
            if (strategy_type=='long')&(last_buy_price>0):
                if ((curr_price-last_buy_price)*100/last_buy_price)>0:
                    only_profit_exit=True
            elif (strategy_type=='short')&(last_sell_price>0):    
                if ((last_sell_price-curr_price)*100/curr_price)>0:
                    only_profit_exit=True
        else:
            only_profit_exit=True

        if exit_flag:
            exit_reason='ECM'
            
        if entry_flag&(pos==0) :
             if strategy_type=='long':
                df['buy_price'].iat[d]= df[price_field].iloc[d]
                last_buy_price=df[price_field].iloc[d]
                df[positional_field].iat[d]=1
             elif strategy_type=='short':
                df['sell_price'].iat[d]= df[price_field].iloc[d]
                last_sell_price=df[price_field].iloc[d]
                df[positional_field].iat[d]=-1
             pos=1
        elif (exit_flag|stoploss_exit|target_exit)& only_profit_exit & (pos==1) :
             df[exit_reason_field].iat[d]=exit_reason
             
             if strategy_type=='long':
                df['sell_price'].iat[d]= df[price_field].iloc[d]
                last_sell_price=df[price_field].iloc[d]
                df[positional_field].iat[d]=-1
             elif strategy_type=='short':
                df['buy_price'].iat[d]= df[price_field].iloc[d]
                last_buy_price=df[price_field].iloc[d]
                df[positional_field].iat[d]=1
             pos=0

    df_temp=df[df[positional_field]!=0].copy()
    
    df_temp['buy_time']=df_temp.index
    df_temp['sell_time']=df_temp.index

    df_buy=df_temp[df_temp.buy_price>0][['buy_price','buy_time']]
    df_buy.reset_index(drop=True,inplace=True)
    
    df_sell=df_temp[df_temp.sell_price>0][['sell_price','sell_time']]
    df_sell.reset_index(drop=True,inplace=True)
    
    long= pd.concat([df_buy,df_sell],axis=1,copy=True)
    
    if len(long)>0:
        if ~(long['sell_price'].iloc[-1]>0):
            long['sell_price'].iat[-1]=curr_price
            long['sell_time'].iat[-1]=curr_time
            
    
    long["returns"]=(long["sell_price"]-long["buy_price"])*100/long["buy_price"]
    long['cum_returns']=(long['sell_price']/long['buy_price']).cumprod()
    long['investment_period']=(long['sell_time']-long['buy_time'])

    short= pd.concat([df_buy,df_sell],axis=1,copy=True)
    
    if len(short)>0:
        if ~(short['buy_price'].iloc[-1]>0):
            short['buy_price'].iat[-1]=curr_price
            short['buy_time'].iat[-1]=curr_time
            
    short["returns"]=(short["sell_price"]-short["buy_price"])*100/short["buy_price"]
    short['cum_returns']=(short['sell_price']/short['buy_price']).cumprod()
    short['investment_period']=(short['buy_time']-short['sell_time'])
    
    if strategy_type=='long':
        return df,long
    else:
        return df,short

'''
# Function to generate backtest reports
'''
def backtest_reports_local(df_summary,lot_size,trx_charge):
    #print("investment period", df_summary['investment_period'].sum())
    #print("number of transactions", df_summary['investment_period'].count())
    print("Sum of returns in %", df_summary['returns'].sum())
    print("Average returns per transaction in %", df_summary['returns'].mean())
    print("Absolute returns", df_summary['returns_abs'].sum())
    print("Absolute returns per trx", df_summary['returns_abs'].sum()/df_summary['returns_abs'].count())
    print("Max drawdown for a trx", df_summary[df_summary.returns_abs<0]['returns_abs'].min())
    print("Max returns for a trx", df_summary[df_summary.returns_abs>0]['returns_abs'].max())
    print("Losing trx", df_summary[df_summary.returns_abs<0]['returns_abs'].count())
    print("Winning trx", df_summary[df_summary.returns_abs>0]['returns_abs'].count())
    print("Win/Lose ratio ", (df_summary[df_summary.returns_abs>0]['returns_abs'].count())/(df_summary[df_summary.returns_abs<0]['returns_abs'].count()))

    df_summary.index=df_summary.buy_time
    df_summary['returns2']=np.round((np.int64(df_summary['returns']/.5))*.5,0)
    
    g1=df_summary[['returns2']].cumsum().plot(figsize=(12,8))
    #fig.autofmt_xdate()
    #ax.fmt_xdata = mdates.DateFormatter('%Y-%m-%d')
    
    plt.tight_layout()

    plt.show(g1)
    
    g2=df_summary[['returns_abs']].cumsum().plot(figsize=(12,8))
    
    plt.tight_layout()
    
    plt.show(g2)    
    '''    
    df_summary['investment_period2']=(np.int64(df_summary['investment_period']))
    
    plt.title("Investment period vs Count of transactions")

    g2=sns.countplot(x="investment_period2",
    data=df_summary)
    plt.show(g2)
    
    #print ('Total returns', df_summary[['returns_abs']].cumsum())
    '''
    plt.title("Percentage Returns vs Count of transactions")
    
    g3=sns.countplot(x="returns2",
     data=df_summary)
    
    plt.show(g3)

Collecting everything

'''
main Function 
'''

def bb_backtest_positional(script,lot_size,trx_charges,slippages):

    summary_min_grand=pd.DataFrame()
    df=fetch_data(script)
        
    draw_cndl_chart(df)

    for strat_type in ['long']:
        df_temp=df.copy()
        price_field='Close'
        
        strategy_type=strat_type
        df_temp,boll_entry,boll_exit=bb(df_temp,price_field,strategy_type)

        if strategy_type=='long':
            final_entry=boll_entry
            final_exit=boll_exit
        elif strategy_type=='short':    
            final_entry=boll_entry
            final_exit=boll_exit
        
        positional_field='pos_bb'
        price_field='Close'
        stoploss_pct=0
        target_pct=200
        only_profit=True
        
        df_temp,summary_min=backtest_strategy_stoploss(df_temp, strategy_type,list(final_entry),list(final_exit), positional_field,price_field,stoploss_pct,target_pct,only_profit)
        
        summary_min['returns_abs']=(summary_min['sell_price']-summary_min['buy_price'])*lot_size
        summary_min['returns_abs']=summary_min['returns_abs']-trx_charges
        summary_min['strat_type']=strat_type
        
        summary_min_grand=summary_min_grand.append(summary_min)
    return summary_min_grand

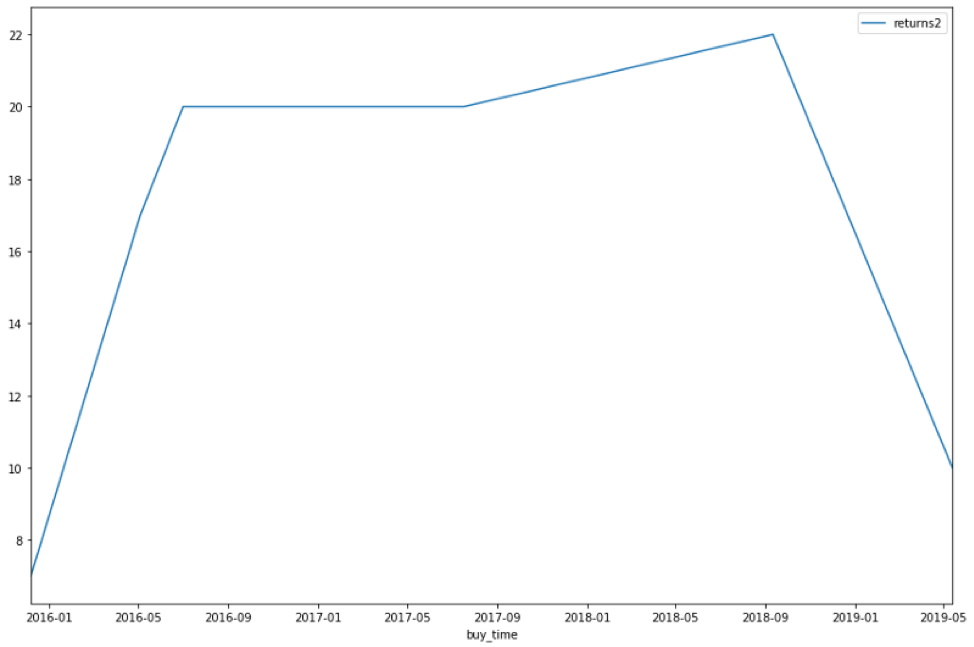
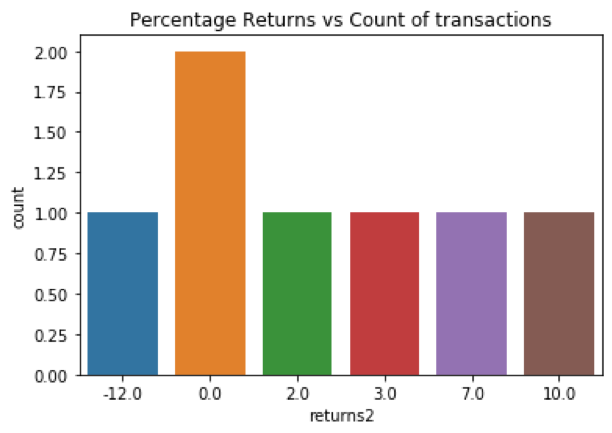
Output is as follows:
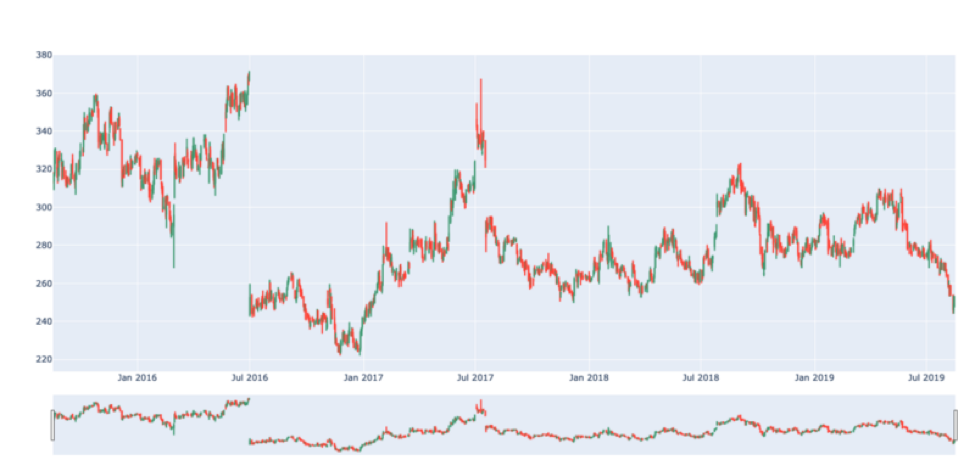
Candlestick chart

**************BACKTEST RESULTS OF : ITC ************************

Sum of returns in % 12.582204198954024
Average returns per transaction in % 1.7974577427077176
Absolute returns 39.50000000000003
Absolute returns per trx 5.642857142857147
Max drawdown for a trx -36.30000000000001
Max returns for a trx 34.200000000000045
Losing trx 1
Winning trx 6
Win/Lose ratio 6.0

Optimization of Parameters

We should keep optimizing our algo parameters on a regular basis. By using historical data and using various methods like ML/backtesting performance.

Things to consider are :

Avoid overfitting of parameters. Overfitting that you optimize the logic and parameters to the extent that the program will work best in some specific situations and scenarios. But it may go bad if the scenario changes.

Paper Trading or Forward Testing or Simulation Trading in the real environment

Paper trading is the way of verification of your logic in the real environment. One doesn’t need to invest actual money in this stage. And It gives very accurate and precise results. One can expect same/similar results in the real environment. But it is time-consuming activity. One can do this by using the feature provided by his/her broker, or you can also develop your framework to test the same. 

Deployment in the real environment

Deployment in the real environment requires multiple facets to be managed, which are generally not being considered in backtesting

Functionally following aspects are required to be managed:

  1. Order management
  2. Risk Management
  3. Money/Fund Management
  4. Diversification of assets
  5. Portfolio management
  6. User Management
  7. Slippages

Technically following aspects are required to be managed:

  • Establish Connection with the broker API.
  • Passing the buy/sell orders using the broker connection,
  • Establish Connection with the data API (if data vendor is different from broker)
  • Accessing the real time and historical data using data API connection.

This concludes the article. If I missed out on anything, feel free to share your thoughts. I will try to incorporate it.

Conclusion:

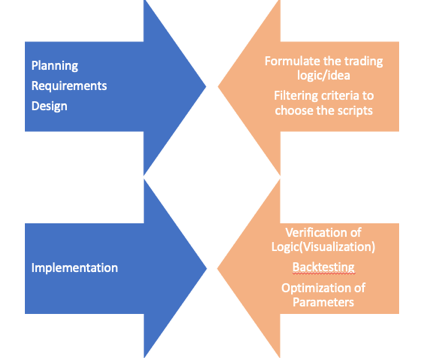
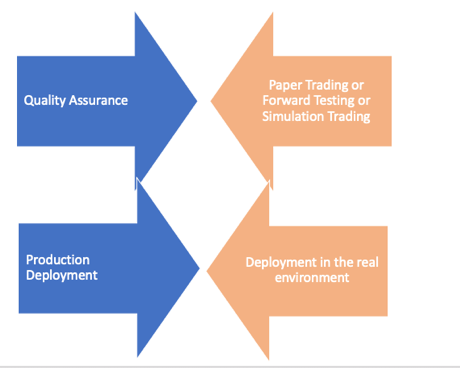
To summarize the following algo trading strategies, Algo can be considered as a software product and all the stages can be easily mapped with “Software Product Development Life Cycle”

All the stages have their own importance and are critical to the success of the algo.

  • Formulate the trading logic/idea
  • Filtering criteria to choose the scripts
  • Verification of Logic( Visualization)
  • Backtesting
  • Optimization of Parameters
  • Paper Trading or Forward Testing or Simulation Trading
  • Deployment in the real environment

Disclaimer: All investments and trading in the stock market involve risk. Any decisions to place trades in the financial markets, including trading in stock or options or other financial instruments is a personal decision that should only be made after thorough research, including a personal risk and financial assessment and the engagement of professional assistance to the extent you believe necessary. The trading strategies or related information mentioned in this article is for informational purposes only.

 Advanced Momentum Trading: Machine Learning Strategies Course