By Ishan Shah
Success in the trading journey requires the trader to know the key concepts before starting trading and one of them is mastering the stock market data analysis. For conducting the data analysis, the trader first needs to fetch the data and visualise it for the “identification of historical price trends and patterns”.
You must be wondering “What is the benefit of this identification”?
The answer is that forecasting future price movements becomes possible with this analysis of historical movements in price. For instance, an analysis of the historical performance of S&P 500 stock tickers can be done to predict future movements of the same. If you are looking to fetch the stock market data and analyse the historical data in Python, you have come to the right place.
After reading this blog, you will be able to:
- Get historical data for stocks
- Plot the data and analyse the performance
- Get the fundamental, futures and options data
For easy navigation through the blog, we have mentioned below what this blog covers, and that is:
- Importance and techniques of data analysis in stock trading
- Steps for obtaining stock market data in Python
- How to fetch stock market data in Python?
- How to get stock market data for different geographies?
- Real-life example of stock market data fetching and analysis in Python
- Data visualisation techniques
Importance and techniques of data analysis in stock trading
Data analysis is fundamental to stock trading as it transforms previous market data into actionable insights for the future.
Through rigorous analysis, traders can identify historical patterns, forecast future price movements, and make informed decisions. It helps in understanding market trends, volatility, and potential risks, thereby enhancing the ability to devise robust trading strategies.
Here are some key techniques:
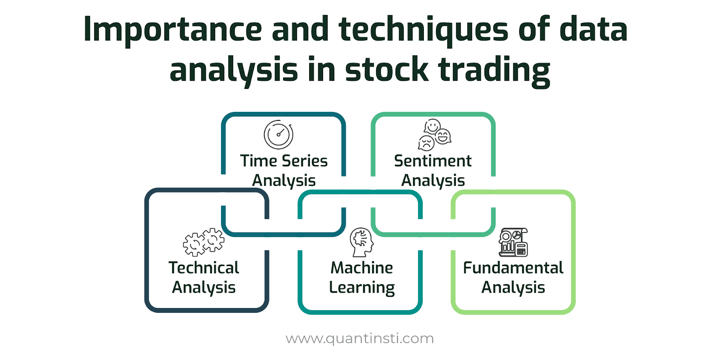
- Technical Analysis: Uses historical price and volume data to identify patterns and trends, helping to forecast future price movements.
- Time Series Analysis: Analyses stock price data over time to identify trends, cycles, and seasonal effects, providing insights into future performance.
- Machine Learning: Employs algorithms to model and predict stock prices based on historical data, improving the accuracy of predictions.
- Sentiment Analysis: Gauges market sentiment by analysing news articles, social media, and other sources, offering insights into market psychology.
- Fundamental Analysis: Examines a company’s financial statements, health, and industry position to determine its intrinsic value and potential for future growth.
Effective data analysis reduces emotional bias and enhances precision, leading to improved trading performance and gainful returns. In an era driven by vast amounts of data, leveraging analytical tools is indispensable for gaining a competitive edge in stock trading.
Let us now see the steps for obtaining the stock market data.
Steps for obtaining stock market data in Python
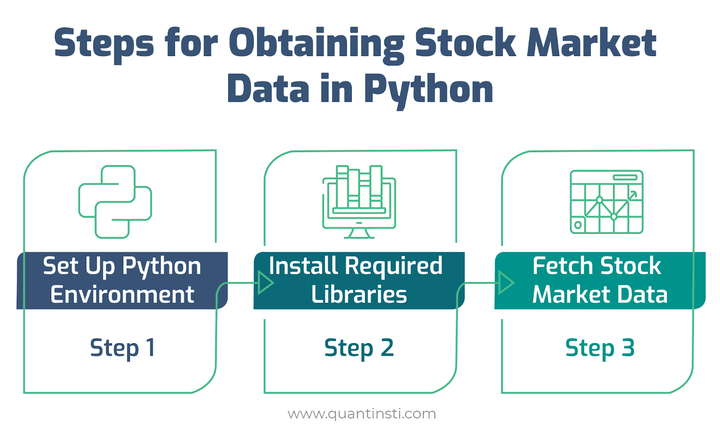
Step 1: Set Up Python Environment: Ensure Python is installed on your system. Create a virtual environment using Anaconda or virtualenv to isolate project dependencies and maintain a clean workspace.
Step 2: Install Required Libraries: Use pip or conda to install essential libraries such as Pandas, NumPy, and yfinance. These libraries will help in data manipulation, numerical operations, and fetching stock market data.
Step 3: Fetch Stock Market Data: Utilise the yfinance library to download historical market data. This can be done using the yf.download() function, specifying the stock ticker, start and end dates, and data interval.
Now, we will discuss how to fetch the stock market data in Python by installing and importing the libraries.
How to fetch stock market data in Python?
Yahoo Finance
One of the first sources from which you can get historical daily price-volume stock market data is Yahoo finance. You can use pandas_datareader or yfinance module to get the data and then can download or store it in a CSV file by using pandas.to_csv method. Additionally, you can explore Yahoo Finance futures data to analyze market trends and incorporate it into your trading strategies.
If yfinance is not installed on your computer, then run the below line of code from your Jupyter Notebook to install yfinance.
!pip install yfinance
Output:
Installing two other libraries to be used later:
Output:
To visualise the adjusted close price data, you can use the matplotlib library and plot method as shown below.
Output:
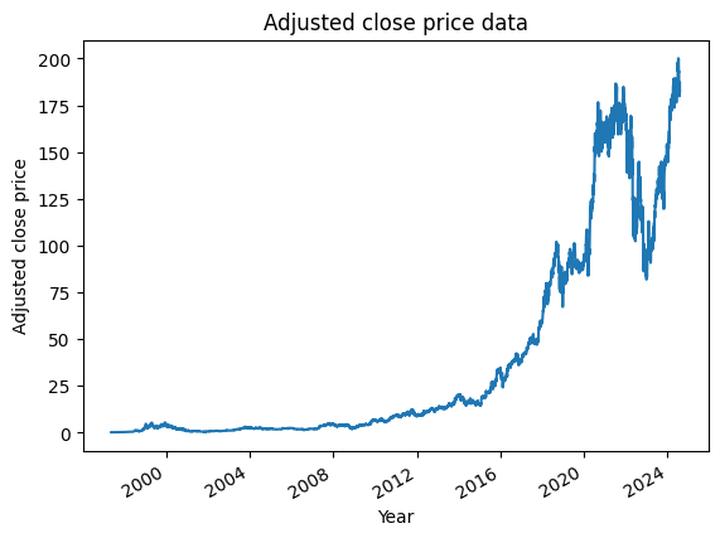
Data Source: Yahoo Finance
Let us improve the plot by resizing, giving appropriate labels and adding grid lines for better readability.
Output:
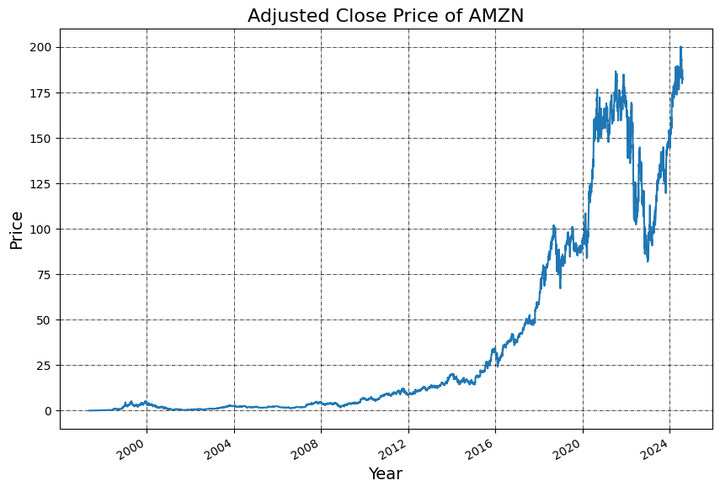
Data Source: Yahoo Finance
Advantages of Yahoo Finance
- Adjusted close price stock market data is available
- Most recent stock market data is available
- Doesn't require an API key to fetch the stock market data
Below is an interesting video by Nitesh Khandelwal (Co-Founder and CEO, of QuantInsti) that answers all your questions related to getting Data for Algo Trading.
Now we will discuss how we can get the stock market data for various geographies.
How to get stock market data for different geographies?
To get stock market data for different geographies, search the ticker symbol on Yahoo finance and use that as the ticker.
To get the stock market data of multiple stock tickers, you can create a list of tickers and call the yfinance download method for each stock ticker.
For simplicity, I have created a dataframe data to store the adjusted close price of the stocks.
Output:
Output:
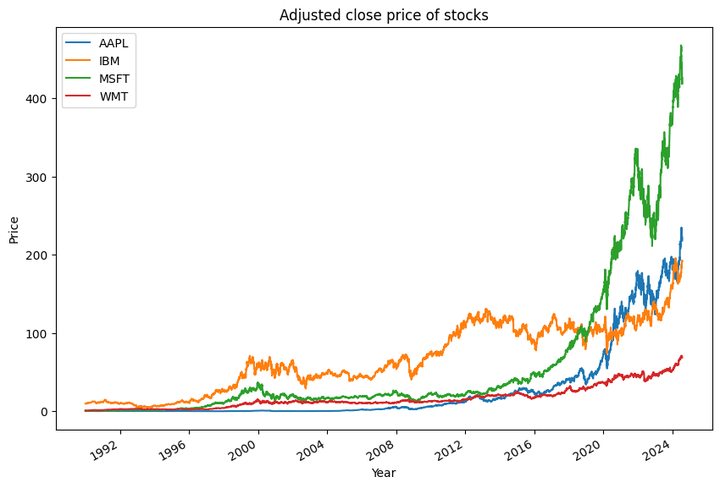
Data Source: Yahoo Finance
Let us now check the real life example of stock market data fetching as well as the analysis.
Real-life example of stock market data fetching and analysis in Python
If you want to analyse the stock market data for all the stocks which make up S&P 500 then the below code will help you. It gets the list of stocks from the Wikipedia page and then fetches the stock market data from yahoo finance.
Output:
  Symbol     Security             GICS Sector               GICS Sub-Industry  \
0    MMM           3M             Industrials        Industrial Conglomerates
1    AOS  A. O. Smith             Industrials               Building Products
2    ABT       Abbott             Health Care           Health Care Equipment
3   ABBV       AbbVie             Health Care                   Biotechnology
4    ACN    Accenture  Information Technology  IT Consulting & Other Services

     Headquarters Location  Date added      CIK      Founded
0    Saint Paul, Minnesota  1957-03-04    66740         1902
1     Milwaukee, Wisconsin  2017-07-26    91142         1916
2  North Chicago, Illinois  1957-03-04     1800         1888
3  North Chicago, Illinois  2012-12-31  1551152  2013 (1888)
4          Dublin, Ireland  2011-07-06  1467373         1989
Output:
Ticker               A    AAL        AAPL       ABBV        ABNB         ABT  \
Date
2021-01-04  115.980736  15.13  126.830078  90.489517  139.149994  102.054939
2021-01-05  116.928986  15.43  128.398163  91.425232  148.300003  103.317635
2021-01-06  120.135468  15.52  124.076103  90.635437  142.770004  103.102524
2021-01-07  123.332176  15.38  128.309967  91.605507  151.270004  104.103333
2021-01-08  124.212006  15.13  129.417419  92.086227  149.770004  104.393295

Ticker           ACGL         ACN        ADBE         ADI  ...         WTW  \
Date                                                       ...
2021-01-04  34.900002  243.104004  485.339996  137.128555  ...  193.992218
2021-01-05  35.040001  244.488007  485.690002  139.579590  ...  192.373245
2021-01-06  36.580002  247.161118  466.309998  140.208817  ...  193.992218
2021-01-07  36.240002  249.493027  477.739990  146.134598  ...  195.468338
2021-01-08  36.439999  250.403015  485.100006  147.195770  ...  193.935120

Ticker             WY        WYNN        XEL        XOM         XYL  \
Date
2021-01-04  28.068600  105.544136  58.838470  35.737568   95.697838
2021-01-05  28.333797  108.792404  58.264946  37.459873   95.582634
2021-01-06  28.479235  109.444038  59.555340  38.415745   99.614441
2021-01-07  28.752991  108.357986  58.390411  38.717148  104.135826
2021-01-08  28.556225  107.647118  58.928070  39.147720  103.079872

Ticker             YUM         ZBH        ZBRA         ZTS
Date
2021-01-04   99.240074  144.795792  378.130005  158.854553
2021-01-05   99.249474  147.301117  380.570007  159.961548
2021-01-06   99.793404  151.498596  394.820007  162.311508
2021-01-07   99.033760  150.600479  409.100006  162.165833
2021-01-08  100.487404  150.269592  405.470001  163.243683

[5 rows x 503 columns]
Intraday or minute frequency stock data
The below code fetches the stock market data for MSFT for the past 5 days of 1-minute frequency.
Output:
Resample stock data
Convert 1-minute data to 1-hour data or resample stock data
During strategy modelling, you might be required to work with a custom frequency of stock market data such as 15 minutes or 1 hour or even 1 month.
If you have minute level data, then you can easily construct the 15 minutes, 1 hour or daily candles by resampling them. Thus, you don't have to buy them separately.
In this case, you can use the pandas resample method to convert the stock market data to the frequency of your choice. The implementation of these is shown below where a 1-minute frequency data is converted to 10-minute frequency data.
The first step is to define the dictionary with the conversion logic. For example, to get the open value the first value will be used, to get the high value the maximum value will be used and so on.
The name Open, High, Low, Close and Volume should match the column names in your dataframe.
Convert the index to datetime timestamp as by default string is returned. Then call the resample method with the frequency such as:
- 10T for 10 minutes,
- D for 1 day and
- M for 1 month
Output:
Suggested read:
Fundamental data
We have used yfinance to get the fundamental data.
Below is a video that covers fundamental data analysis in detail.
The first step is to set the ticker and then call the appropriate properties to get the right stock market data.
If yfinance is not installed on your computer, then run the below line of code from your Jupyter Notebook to install yfinance.
Key Ratios
You can fetch the latest price to book ratio and price to earnings ratio as shown below.
Output:
Price to Book Ratio is:  11.540634
Price to Earnings Ratio is:  35.321186
Revenues
Output:
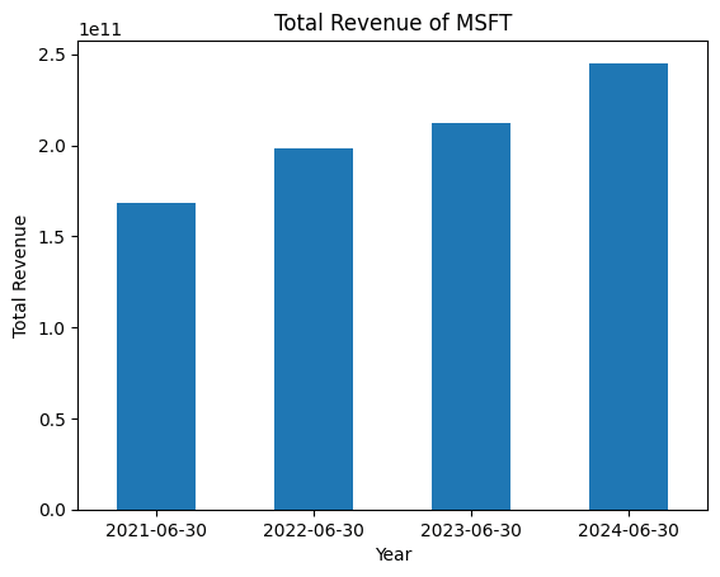
Data Source: Yahoo Finance
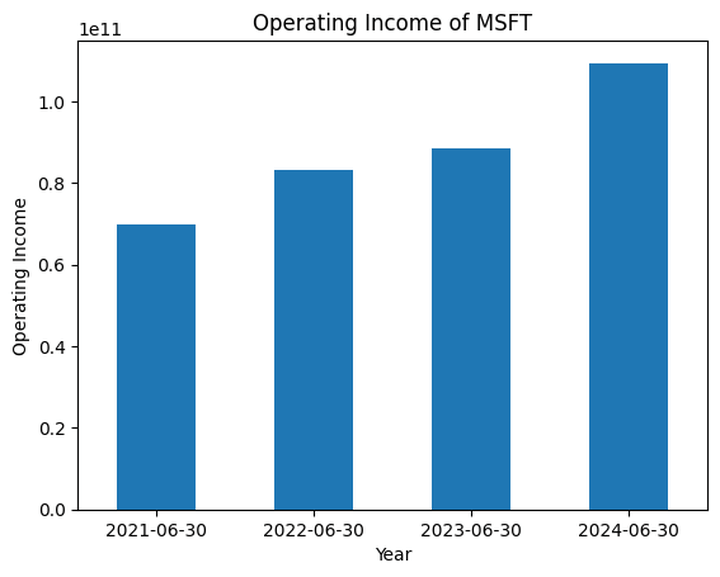
Earnings Before Interest and Taxes (EBIT)
First, we import the EBIT data:
Then we plot the EBIT data
Output:

Data Source: Yahoo Finance
Balance sheet, cash flows and other information
Output:
Stock market data analysis
After you have the stock market data, the next step is to create trading strategies and analyse the performance. The ease of analysing the performance is the key advantage of Python.
We will analyse the cumulative returns and different ratios such as
- Sharpe ratio,
- Sortino ratio, and
- Calmar ratio.
I have created a simple buy-and-hold strategy for illustration purposes with four stocks namely:
- Apple
- Amazon
- Microsoft
- Walmart
Install pyfolio if not already installed, as shown in the first line of the code, following which we will analyse the performance using the pyfolio tear sheet.
Output:
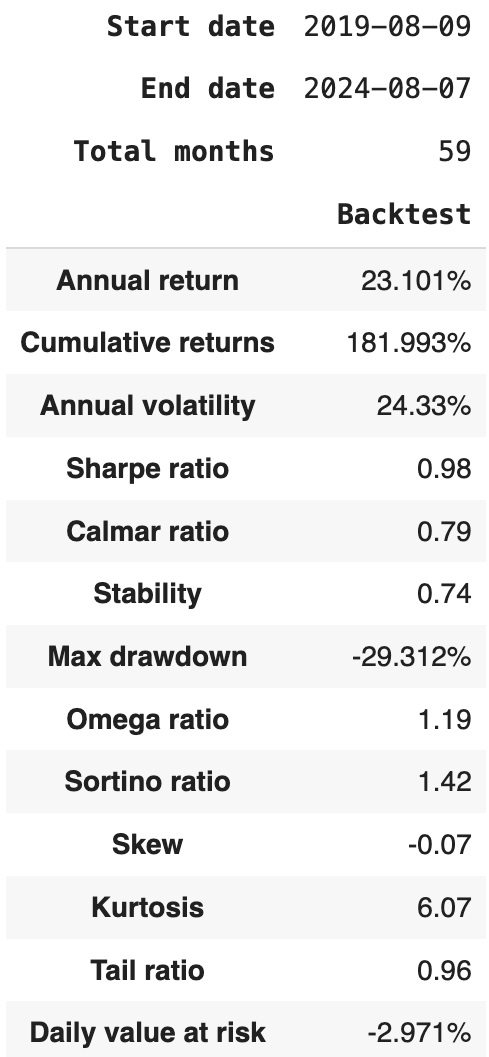
Above in the output you can see the tear sheet which includes all the analysed backtested figures for a total of 59 months.
It is important to note that backtesting results do not guarantee future performance. The presented strategy results are intended solely for educational purposes and should not be interpreted as investment advice. A comprehensive evaluation of the strategy across multiple parameters is necessary to assess its effectiveness.
Now we will see the various techniques used for data visualisation for you to be able to use any one.
Data visualisation techniques
Data visualisation techniques help interpret and communicate insights from stock market data. Here are some common techniques and their uses:
1. Line Charts: Line charts plot stock prices over time, showing trends and patterns. They are ideal for visualising price movements and historical performance.
Code Example:
Output:
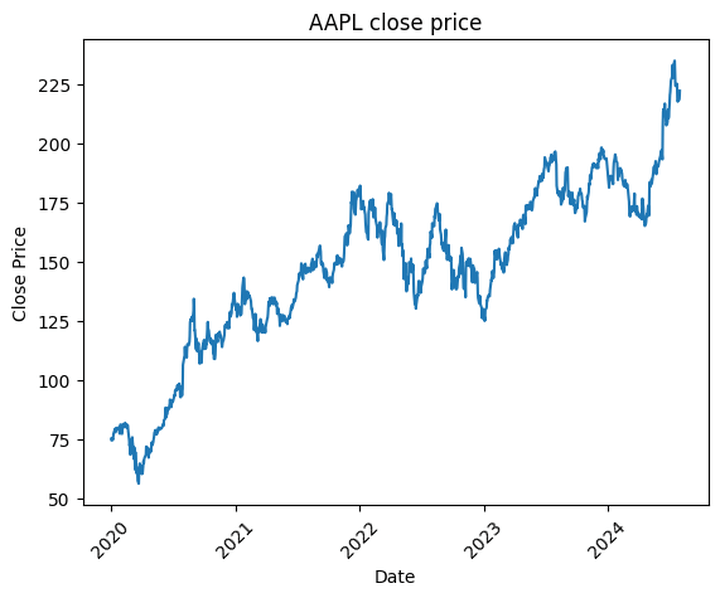
The above plot shows the line chart displaying close price of AAPL over a period of time.
2. Candlestick Charts: Candlestick charts display the open, high, low, and close prices for a given period, revealing market sentiment and trends. They are commonly used for technical analysis.
Code Example:
Output:
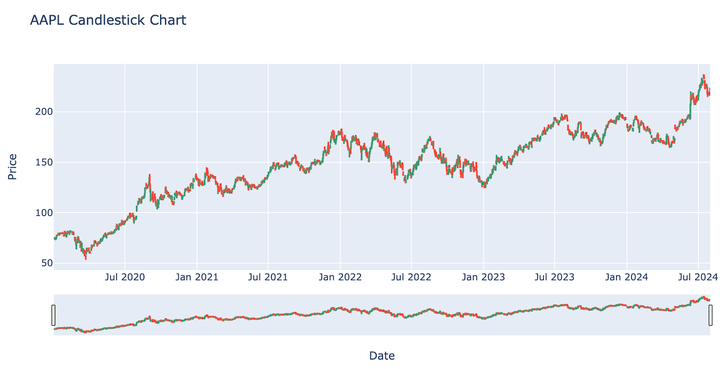
Above plot shows a candlestick chart using Plotly for the specified date range and a line chart below the for the closing prices.
3. Bar Charts: Bar charts compare different stock metrics such as trading volume or price changes. They are useful for visualising discrete data points.
Code Example:
Output:
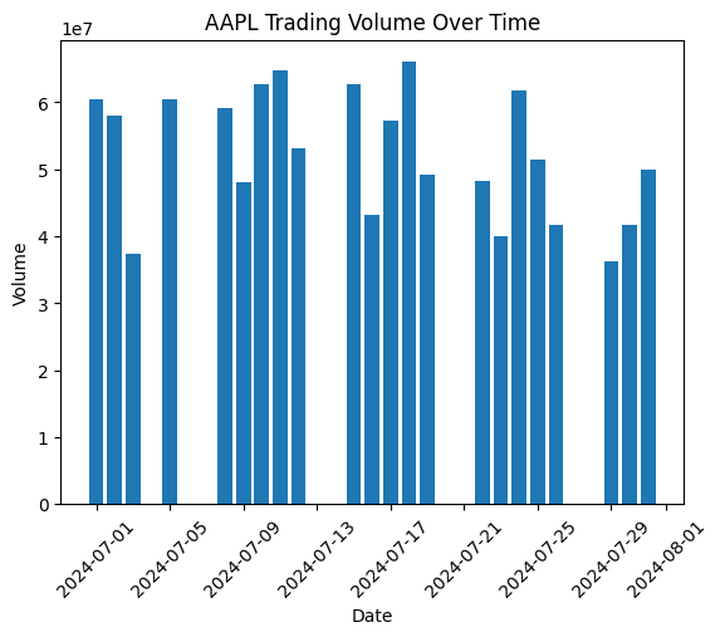
Above plot is a bar chart displaying the trading volume for Apple Inc. over the specified date range.
4. Histogram: Histograms show the distribution of stock returns or other numerical data. They help understand the frequency distribution of returns.
Code Example:
Output:
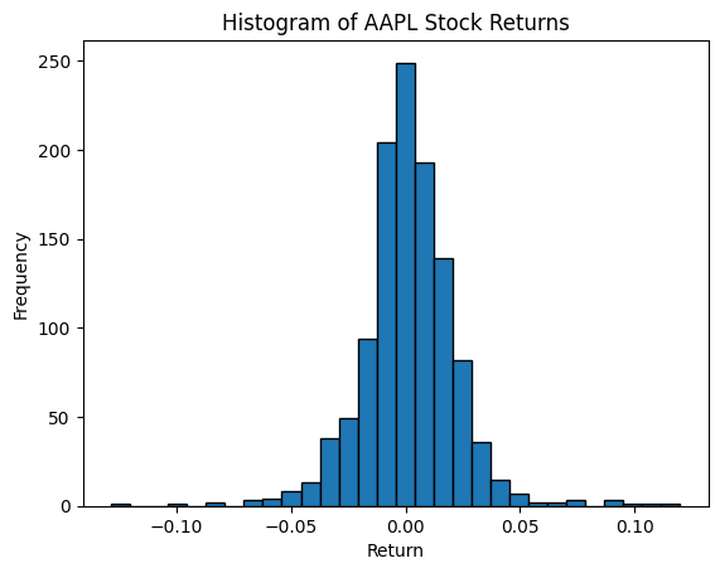
The above histogram shows the distribution of daily returns for Apple Inc. over the specified period.
5. Scatter Plots: Scatter plots visualise the relationship between two variables, such as stock price and trading volume, helping to identify correlations.
Code Example:
Output:
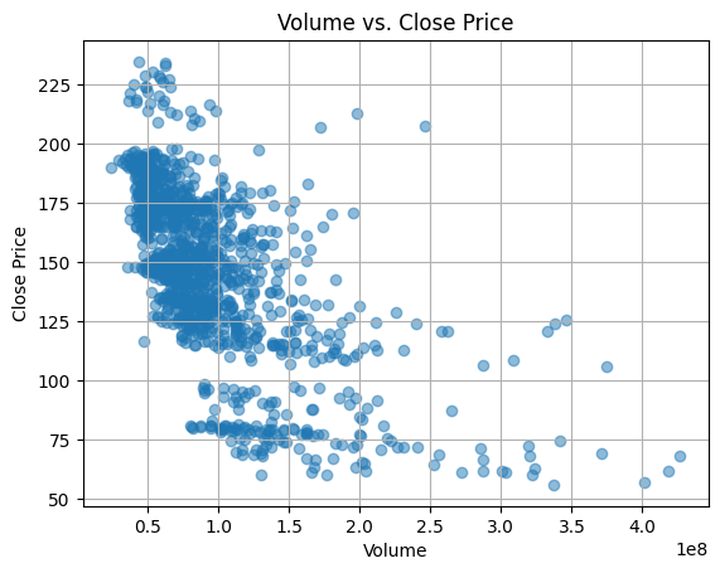
The above scatter plot shows the relationship between the trading volume and the closing price of the stock. Each point on the scatter plot represents a single trading day's volume and closing price.
6. Heatmaps: Heatmaps display data intensity through colour variations, useful for visualising correlations between different stocks or metrics.
Code Example:
Output:
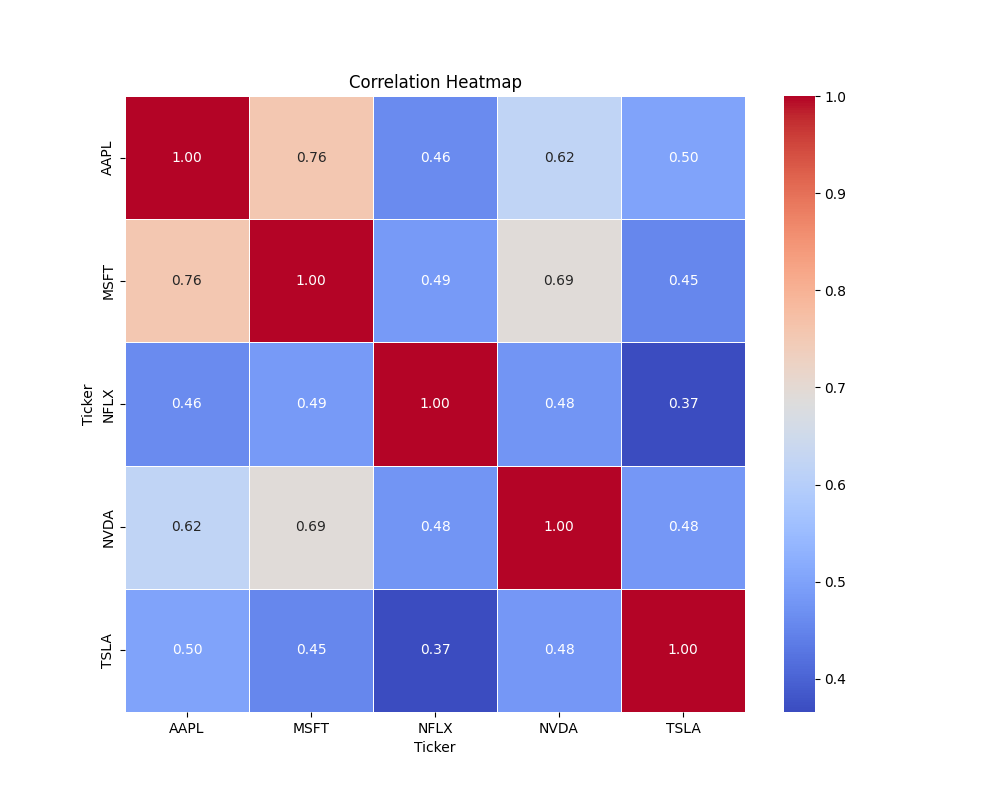
The heatmap above visualises the correlation between the selected stocks' close price data, with a colour map that highlights the strength of the correlations.
7. Box Plots: Box plots summarise the distribution of stock returns, showing median, quartiles, and outliers. They are useful for understanding volatility and return distributions.
Code Example:
Output:
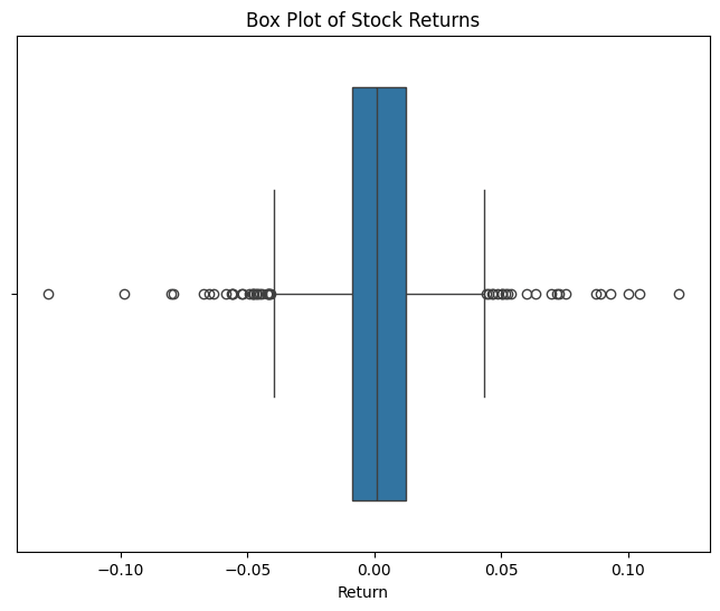
The box plot above visualises the distribution of daily stock returns, showing key statistical summaries such as the median, quartiles (one of the quantiles), and potential outliers (an important part of data cleaning).
Each technique provides unique insights into stock market data, helping to uncover trends, relationships, and anomalies in the market.
Suggested reads on Data Visualisation using Python:
- Seaborn for Python Data Visualization
- Plotly Python for an Interactive Data Visualization
- Bokeh for Data Visualization in Python
You will find it very useful and knowledgeable to read through this list consisting of some of our top blogs on:
- Python for Trading
- Machine Learning
- Sentiment Trading
- Algorithmic Trading
- Options Trading
- Technical Analysis
Conclusion
Data analysis is vital in stock trading, transforming raw data into actionable insights that inform trading strategies and decisions. Setting up a robust Python environment and following systematic steps to obtain and visualise stock market data are essential for effective analysis. Also, utilising various visualisation techniques helps in identifying trends, patterns, and correlations within the data.
Fetching stock market data in Python can be done using libraries like yfinance, which allows for the retrieval of historical data across different geographies. We also discussed real-life examples, such as analysing S&P 500 stock tickers, intraday data, and resampling, to demonstrate the practical applications of these techniques.
Additionally, incorporating fundamental data enriches the analysis, providing a comprehensive view of market conditions. By mastering these tools and techniques, traders can enhance their ability to make informed, data-driven decisions in the stock market.
Moreover, Getting market data is a comprehensive course to help with learning how to fetch various data like pricing data of stocks, fundamental data and news headlines data. This course is available FREE of cost and can be accessed to gain a thorough knowledge for fetching data, performing quality checks, visualisation as well as the analysis of the data with Python language.
With this course, you will learn all the abovementioned essentials of stock market data with the help of various formats such as videos, documentation, codes, etc. Also, you can take the quiz to confirm the gained information.
File in the download
- Stock market data analysis in Python - Python notebook
Note: The original post has been revamped on 30th August 2024 for recentness, and accuracy.
Disclaimer: All investments and trading in the stock market involve risk. Any decision to place trades in the financial markets, including trading in stock or options or other financial instruments is a personal decision that should only be made after thorough research, including a personal risk and financial assessment and the engagement of professional assistance to the extent you believe necessary. The trading strategies or related information mentioned in this article is for informational purposes only.