In the dynamic world of financial markets, we all know how crucial it is to gain that competitive edge. We're constantly looking for ways to enhance our trading skills and boost our returns. Backtesting is yet another integral skill required for your trading journey.
The Global Backtesting Software Market is expected to reach $5 billion by 2027, growing at a CAGR of 12.5%.
Source: Verified Market Reports
In this blog, we dive headfirst into the world of backtesting and show you how it can completely revolutionise your trading journey. Whether you're a seasoned trader or just starting out, this guide gives you the knowledge and tools to harness the full power of backtesting.
All the concepts covered in this blog are taken from this Quantra course on Backtesting Trading Strategies. You can take a Free Preview of the course.
It's time to embrace backtesting and take your trading strategy to a new level. Let's dive in and explore more with this blog that covers:
- What is backtesting?
- Importance of backtesting
- Prerequisites for backtesting
- Steps on how to backtest a trading strategy
- How to backtest trading strategy with Python
- Time period for backtesting a trading strategy
- Performance metrics for backtesting a trading strategy
- Interpreting and analysing backtesting results
- Backtesting vs walk forward trading testing
- Backtesting vs Scenario analysis
- Common mistakes while backtesting
- Selecting a backtesting software or backtesting platform
- Backtesting vs Paper Trading vs Live Trading
- Steps after backtesting - Paper trade or Live trade
- Backtesting benefits and drawbacks
- FAQs about backtesting
What is backtesting?
Backtesting is a technique used in trading and investing to evaluate the performance of a trading strategy or investment approach using historical market data. It involves applying predetermined rules and parameters to past price data to simulate how the strategy would have performed in the past.
It's a powerful tool that lets you simulate your trading strategy using historical market data. By testing your strategies against past price movements, you can gain incredible insights into how they would have performed and whether they have the potential for profitability. In other words, it's like a crystal ball that helps you fine-tune your approach, spot weaknesses, and optimise your decisions before you even risk a single dollar.
By going through the backtesting process, you can gain valuable insights. You'll see how profitable your strategy could have been, what risks you might face, and how it compares to other approaches. It helps you make more informed decisions and increases your chances of success when you start trading with real money.
In short, backtesting aims to evaluate the strategy's performance, understand its strengths and weaknesses, and make improvements. It's a way to learn from historical data and fine-tune your approach before entering the live markets.
This video describes what is backtesting in short:
Importance of backtesting
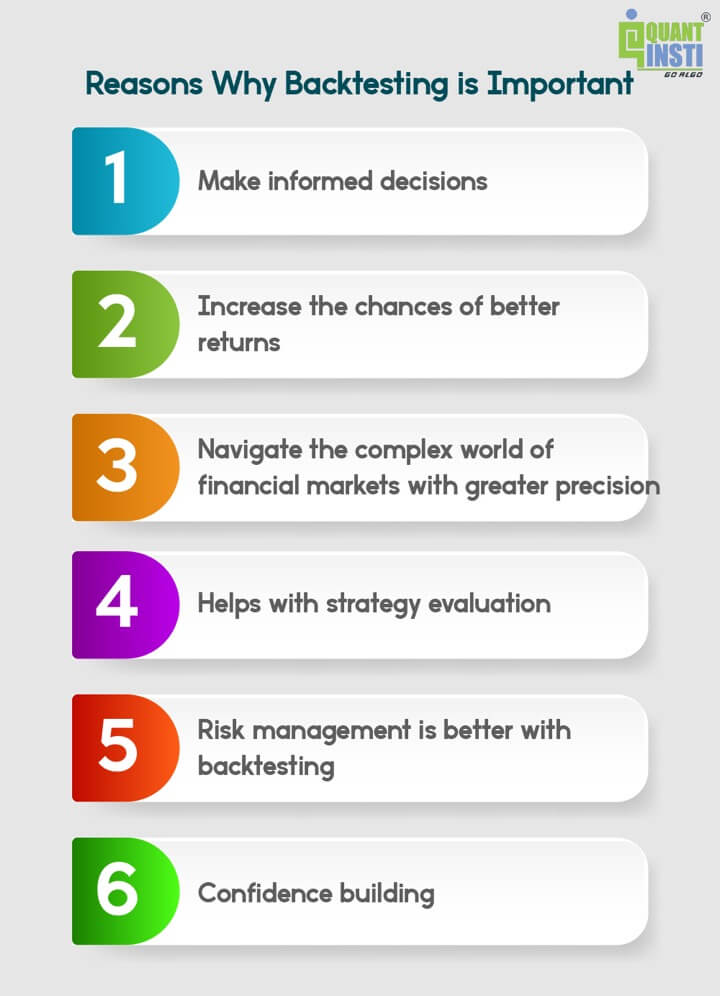
The first and main reasons to backtest is that it empowers traders to:
Make informed decisions
- Gathering and analysing relevant information helps you make decisions based on facts, reducing reliance on emotions or speculation.
- Conduct thorough research, understand market trends, evaluate financial statements, and stay updated on events that impact the markets.
Increase the chances of better trading
- To diversify investments across asset classes, sectors, and regions.
- Conduct research, analyse performance, and understand underlying factors.
- Seek professional advice, stay disciplined, and maintain a long-term investment horizon.
Greater precision
- Understand investment instruments, market forces, and economic indicators. Stay updated with financial news, market trends, and regulations.
- Build financial literacy, utilise technology and analytical tools, and access reliable information sources.
The other reasons why backtesting is important are:
Helps with strategy evaluation
Backtesting allows traders to assess the performance and viability of their trading strategies objectively. By simulating trades using historical data, traders can gain insights into profitability, risk-adjusted returns, and other metrics. This evaluation helps identify strengths and weaknesses in strategies, facilitating informed decision-making.
Better Risk management
Backtesting aids in effective risk management by providing a realistic assessment of strategy risks. By evaluating drawdowns, volatility, and potential losses based on historical data, traders can establish suitable risk parameters and position sizes. This analysis supports the design of robust risk management techniques and optimal risk-reward ratios.
Confidence building
Backtesting instils confidence in traders before engaging in live trading. By observing a strategy's performance in various market conditions and scenarios, traders develop a deeper understanding of its potential and build trust in its ability to generate profits. This confidence strengthens discipline and decision-making during live trading.
Prerequisites for backtesting
Before you start backtesting a trading strategy, you need to consider some of the factors:
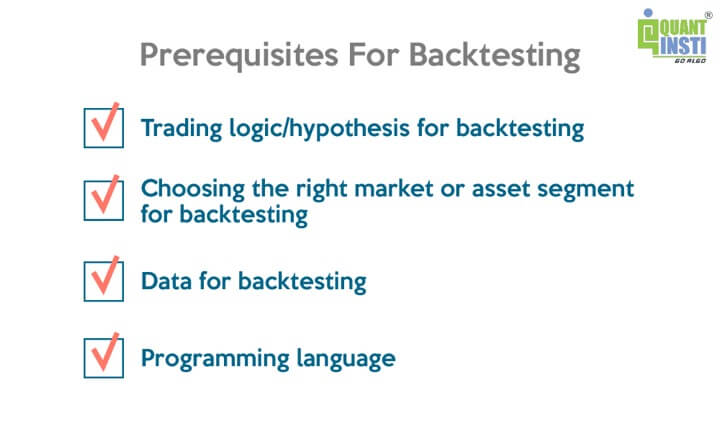
Trading logic/hypothesis for backtesting
You decided to backtest a trading strategy, but before you backtest, you need to have a clear picture in your mind of what you are going to backtest. That is what is the trading logic or hypothesis of this backtest. If you are clear with the trading logic, then only you can backtest the trading strategy, and therefore this is the most crucial step in backtesting.
For example, in a moving average-based trading strategy, we will have buy signal and sell signal. We will use two moving averages: a short-term moving average (e.g., 50-day moving average) and a long-term moving average (e.g., 200-day moving average).
Now, according to the trading logic:
- Buy signal: When the short-term moving average (e.g., 50-day moving average) crosses above the long-term moving average (e.g., 200-day moving average).
- Sell signal: When the short-term moving average crosses below the long-term moving average. It implies that it might be a good time to exit a long position or consider taking a short position in security.
Choosing the right market or asset segment for backtesting
There are various factors that you can look at to decide which market or assets will be best for the kind of trading you are looking to conduct. The factors can be risks you are willing to take, the profits you are looking to earn, and the time you will be investing, whether long-term or short-term.
For example, trading in cryptocurrencies might be riskier than other asset classes but can give higher returns and vice versa. Hence, it is a crucial decision to select the right market and asset class to trade-in.
Data for backtesting
Once you have shortlisted the assets, you would want to backtest your trading strategy. The next step is to choose historical data of the asset. You can get the data from the data vendor or from your broker. It is important to select high-quality data, that is, data without any errors. If you choose poor-quality data, then the output analysis from backtesting will be incorrect and misleading.
You can check out this free course on Quantra to get the market data for different asset classes.
Choosing the programming language for backtesting
You were clear with the trading logic, selected the right asset for the trading and got the required data of the asset. The final step is to decide the programming language you will use to backtest a trading strategy. Actually, it is a matter of personal choice and the language you are comfortable with. There are a lot of programming languages available such as C, Python, R, etc.
It is important to note that if you are not comfortable with any programming languages for backtesting, that’s not an issue. It doesn’t hinder you from backtesting your trading strategy.
You can learn Python for trading with ease if you stay determined and dedicated to learning. It is not that difficult if you persevere.
Steps on how to backtest a trading strategy
Let us now see the general steps to backtest below.
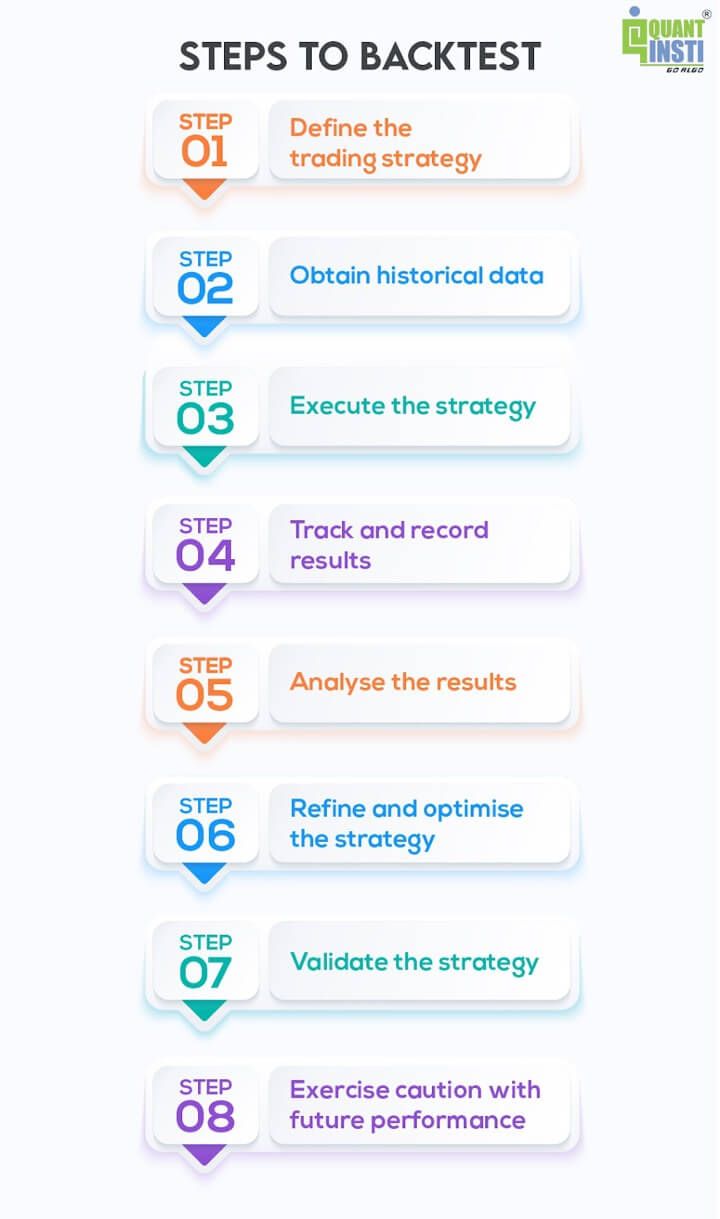
Step 1: Define the trading strategy
Clearly articulate the rules and criteria that will govern your trading strategy. Specify the entry and exit conditions, position sizing, risk management rules, and other relevant parameters.
Step 2: Obtain historical data
Gather accurate and reliable historical data for the financial instruments or markets you intend to backtest. This data should include relevant price, volume, and other necessary information.
Set the testing period, determine the time period you want to use for the backtesting analysis. This can range from a few months to several years, depending on the strategy and desired level of confidence.
Step 3: Execute the strategy
Apply the defined trading strategy to the historical data, simulating the trades as if they were executed in real-time. Follow the specified entry and exit rules to determine the hypothetical trade outcomes.
Step 4: Track and record results
Keep track of the trades executed during the backtesting process, including entry and exit points, trade duration, profit or loss, and other relevant metrics. This data will be crucial for evaluating the strategy's performance.
Step 5: Analyse the results
Evaluate the performance of the trading strategy based on the recorded results. Calculate key performance metrics such as profitability, risk-adjusted returns, win rate, drawdowns, and any other relevant statistics.
Step 6: Refine and optimise the strategy
Identify areas for improvement and optimisation based on the analysis of the backtesting results. Adjust the strategy parameters, rules, or risk management techniques as necessary to enhance its performance.
Step 7: Validate the strategy
Once the necessary adjustments have been made, validate the strategy by conducting additional tests on different data sets or time periods to ensure its robustness and consistency.
Iterate and repeat
Backtesting is an iterative process, and it may require multiple rounds of refinement, testing, and validation. Continuously refine and iterate on the strategy based on new insights and market conditions.
Exercise caution with future performance
While backtesting provides valuable insights, it does not guarantee future performance. Be mindful that market conditions and dynamics may change, and live trading involves additional factors such as slippage, liquidity, and execution delays that can impact backtesting results.
This video explains the complete process briefly:
How to backtest trading strategy with Python
We will conduct a backtest on a trading strategy that utilises moving averages. Moving averages are calculated by taking the average of a specified data field, such as the price, over a consecutive set of periods. As new data becomes available, the moving average is recalculated by replacing the oldest value with the latest one.
The trading logic for this strategy is straightforward:
- We will buy the security when the short-term moving average (e.g., 50-day moving average) crosses above the long-term moving average (e.g., 200-day moving average). This is commonly known as a "golden crossover".
- We will sell the security when the short-term moving average crosses below the long-term moving average. This is referred to as a "death cross".
You can check out this informative video on backtesting a trading strategy:
We will now backtest this trading strategy to evaluate the effectiveness of this, and for this, we will follow these steps:
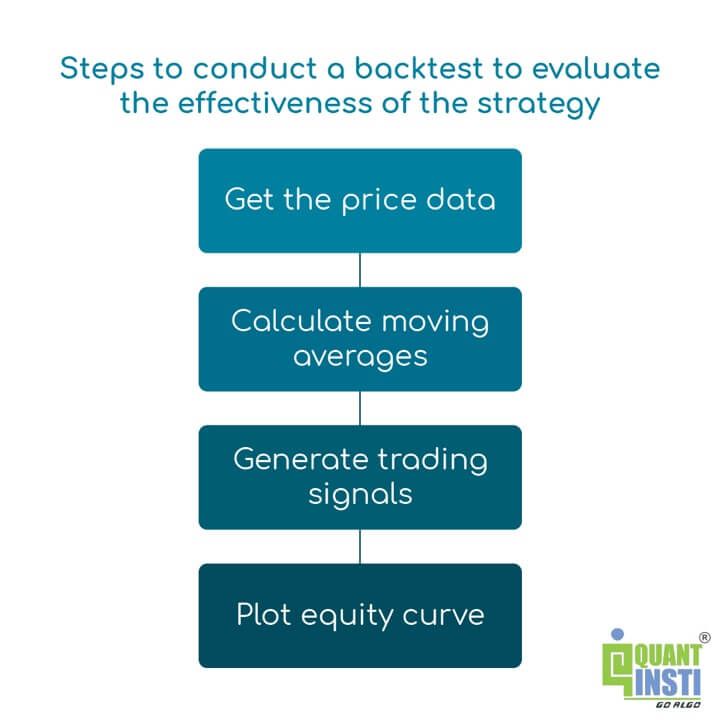
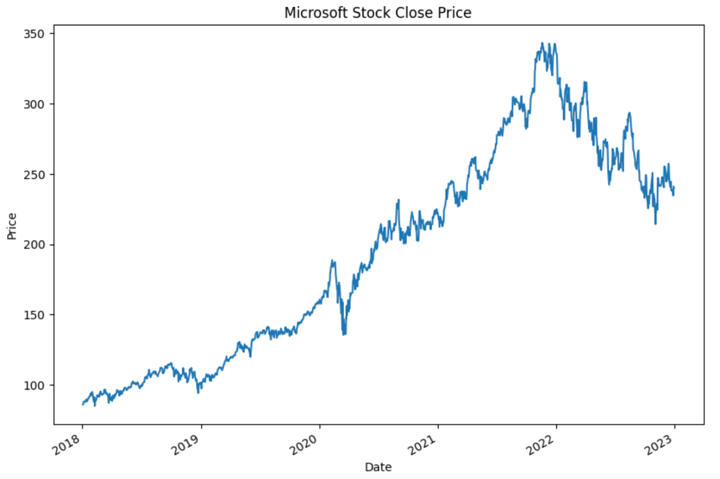
Getting the price data for backtesting
We will do the backtesting on the Microsoft stock. To do that, you need to get the price data of Microsoft stock. We will use Yahoo! Finance to fetch the data.
Output:
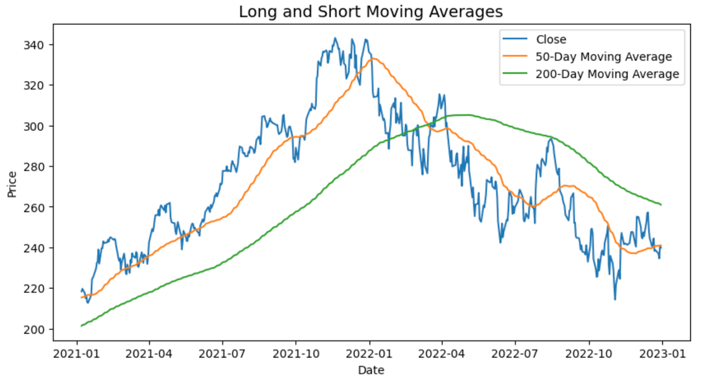
Calculating the moving averages
We will calculate the moving 50-day and 200-day moving averages of the closing price. We will use pandas, rolling and mean methods to calculate a moving average.
Output:
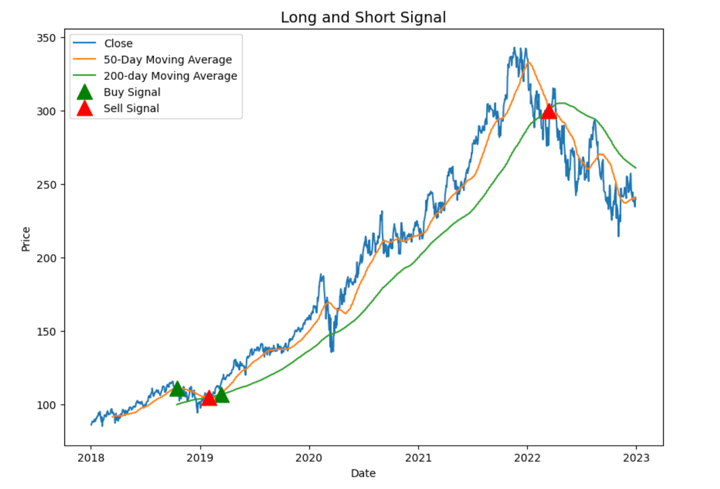
Generating trading signals
As discussed earlier, we will buy when the 50-day moving average is greater than the 200-day moving average and short when the 50-day moving average is below the 50-day average.
Output:
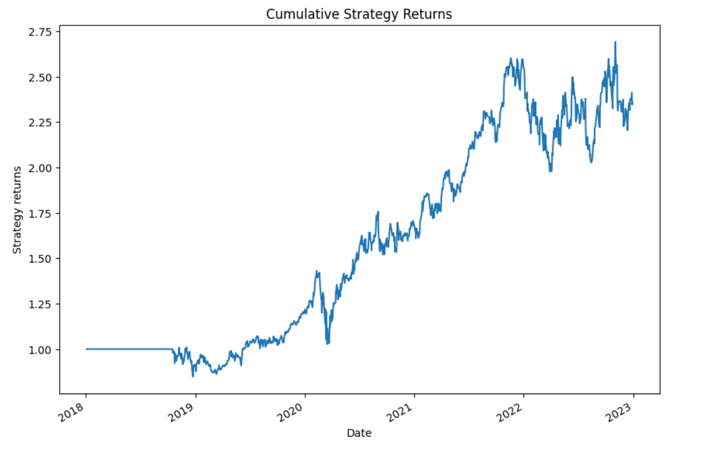
Plotting the equity curve
We will calculate and plot the cumulative strategy returns.
Output:
Before we move and analyse the strategy's performance, let's answer two questions that must come to your mind.
- Since we backtested the trading strategy only for six years, what would be the ideal backtesting period?
- How many stocks should be used for backtesting a trading strategy?
Time period for backtesting a trading strategy
The time period selected for backtesting a trading strategy depends on two key factors: the average holding period and the strategy type employed.
Average Holding Period
- Long-Term Strategies: If the strategy involves holding positions for more than a month, it is advisable to use a long backtesting period of around 15 years. This extended time frame allows for a comprehensive assessment of the strategy's performance across different market cycles.
- Short-Term Strategies: For strategies with holding periods of less than a week, a backtesting period of 10 years is generally sufficient. This time frame provides enough data to evaluate the strategy's effectiveness within shorter timeframes.
- Intraday Strategies: For strategies with holding periods of less than a day, a backtesting period of 3-4 years is often appropriate. This duration enables the analysis of the strategy's performance and outcomes under various intraday market conditions.
Strategy Type
- Trend-Following Strategies: Since trends can persist for extended periods, it is crucial to have a significant amount of historical data to assess the strategy's performance across different market cycles. In such cases, a backtesting period of 10 years or more is recommended.
- Mean Reversion Strategies: The required backtesting duration for mean reversion strategy varies based on the chosen timeframe. Shorter timeframes may only require a few years of data, while longer time frames might necessitate a more extensive historical period to capture the mean-reverting behaviour adequately.
- Volatility-Based Strategies: Strategies relying on market volatility, such as volatility breakouts or volatility-based position sizing, may require a different approach. The selection of the backtesting time period depends on the stability of volatility regimes in the market. If volatility regimes change frequently, it is beneficial to include a longer historical period that covers various market conditions.
However, it's important to note that the choice of backtesting time period can be subjective and dependent on the specific strategy being tested.
High-frequency trading (HFT) strategies, for instance, may sometimes only require a few days of data. Additionally, for certain strategies focused on nowcasting, more recent data may be more relevant. Ultimately, the backtesting period should align with the characteristics and objectives of the trading strategy being evaluated.
How many stocks should be used for backtesting a trading strategy?
There is no fixed answer to this question. But the strategy includes a diversified set of stocks that belong to different sectors. This is because if you only keep stocks from a particular sector, say technology. Then in scenarios like the Dot-com bubble, your strategy will be doomed. Such situations can be avoided if you have a diversified portfolio.
Performance metrics for backtesting a trading strategy
Before analysing and interpreting the results of backtesting, it's important to familiarise ourselves with common performance metrics used to evaluate strategy performance on historical data or for backtesting portfolio.
Cumulative returns
Cumulative returns, also known as absolute returns, measure the total gain or loss of an investment over a specific period, regardless of the time taken. It is expressed as a percentage.
Cumulative returns formula
Cumulative returns = (Final value of investment - Initial value of investment) / Initial value of investment * 100
Cumulative returns calculation with an example
For example, let's say you invested $10,000 in a company, and after three years, your investment grows to $18,000. The cumulative return of your investment would be 80%.
Cumulative returns = (18000 - 10000) / 10000 * 100
Thus, the cumulative returns would be 80%.
Annualised returns
Annualised returns represent the average compounded rate of return earned by an investment each year over a specific time period. This metric helps determine what the strategy would have earned if the returns were compounded on an annual basis.
Annualised returns formula
Annualised returns = ((1 + Cumulative returns)^(365 / Number of days)) - 1
Annualised returns calculation with an example
For example, let's consider the previous scenario where the cumulative returns on your investment were 80% over three years, which translates to 365*3 days.
To calculate the annualised returns, you would use the formula as follows:
Annualised returns = ((1 + 0.80)^(365 / (365*3))) - 1
i.e. Annualised returns = 21.64%
This means that if the strategy's returns were compounded annually, it would have achieved an average annual return of 21.64% over the specified time period.
By annualising the returns, investors can better compare the performance of different investment strategies on a consistent basis and assess their long-term profitability.
Annualised volatility
Annualised volatility is a measure of risk and is defined as the standard deviation of the investment's returns. To calculate annualised volatility, you multiply the daily volatility by the square root of the number of trading days in a year.
Sharpe ratio
The Sharpe ratio is a metric that calculates the excess return of a portfolio compared to the risk-free rate of return per unit of standard deviation. The risk-free rate is typically represented by the return on assets such as government bonds. While backtesting portfolio, the Sharpe ratio is used to evaluate how well a strategy compensates for the risk taken on the investment and can be compared to a benchmark.
Sharpe ratio formula
Sharpe ratio = (Portfolio returns - Risk-free returns) / Standard deviation of the portfolio returns
Sharpe ratio calculation with an example
For example, let's consider a portfolio with annualised returns of 10% and a standard deviation of 4%. Assuming the risk-free return is 4%, the Sharpe ratio for the strategy would be 1.5.
Sortino ratio
The Sortino ratio is a variation of the Sharpe ratio that replaces the total standard deviation with the downside deviation. The downside deviation focuses on the standard deviation of negative asset returns only, distinguishing harmful volatility from overall volatility. It is a useful measure to assess returns per unit of downside risk.
Sortino ratio formula
Sortino ratio = (Portfolio returns - Risk-free returns) / Standard deviation of the negative portfolio returns
Beta
Beta is a measure that captures the relationship between the volatility of a portfolio and the volatility of the market. It indicates how much the portfolio is expected to increase or decrease when the market moves by a certain percentage. A beta less than 1 implies the portfolio moves less than the market, while a beta greater than 1 means the portfolio moves more than the market. A beta of 1 indicates the portfolio has the same volatility as the market.
The formula for beta is:
Beta = Covariance(Portfolio returns, Market returns) / Variance(Market returns)
Maximum drawdown
Maximum drawdown measures the maximum loss experienced by a portfolio from its peak value to its lowest point during a specific period. While backtesting portfolio, it is expressed as a percentage and is calculated by dividing the price difference at the trough and the peak by the price at the peak.
Maximum drawdown calculation with an example
For example, if an investment of $10,000 reaches a peak value of $12,000 but subsequently falls to $7,000, the maximum drawdown would be calculated as:
Maximum drawdown = (7,000 - 12,000) / 12,000
i.e., Maximum drawdown = -41.6%
This indicates a maximum drawdown of 41.6% for the portfolio.
You can check out this video to get clarity on the various biases, data, equity curve and performance metrics:
Interpreting and analysing backtesting results
Now you understand the common metrics used in evaluating the strategy's performance, it's time to use some of the metrics to evaluate our moving average crossover strategy.
Output:
The annualised returns of strategy is 18.73%

The annualised_volatility is 29.446091387679964

The risk free rate is 3.968253968253968e-05

The sharpe ratio is 0.6970916517530565

The maximum drawdown is -28.23529392738188
The annualised return of the strategy is 18.73%, which means that over the period of backtesting, the strategy generates a return of around 18% each year. The Sharpe ratio of the strategy is below 1. Therefore we can say that the strategy is sub-optimal, and there is a lot of scope for improvement.
There are lots of performance and risk indicators that can be used for evaluation purposes. But among them which one should you choose? So the next question is:
How should you define risk metrics for yourself?
Volatility and maximum drawdown are the standard measures of risk.
- If you are concerned about the maximum loss a strategy can incur over a period of time. Then you can use maximum drawdown.
- If you want to invest in a less risky strategy, Beta is the most suitable risk metric. You can calculate the Beta of the strategy to compare it with the market volatility.
Generally, traders use the Sharpe ratio as it provides information about the returns per unit risk. So, it is using both factors, risk and returns.
Backtesting vs walk forward trading testing
While backtesting provides historical performance insights, walk forward testing offers a more dynamic and forward-looking assessment of a trading strategy's potential. Walk forward testing helps to reduce the risk of overfitting, provides a more realistic evaluation of a strategy's adaptability, and offers greater confidence in its future performance.
Let us learn more about the walk forward test process.
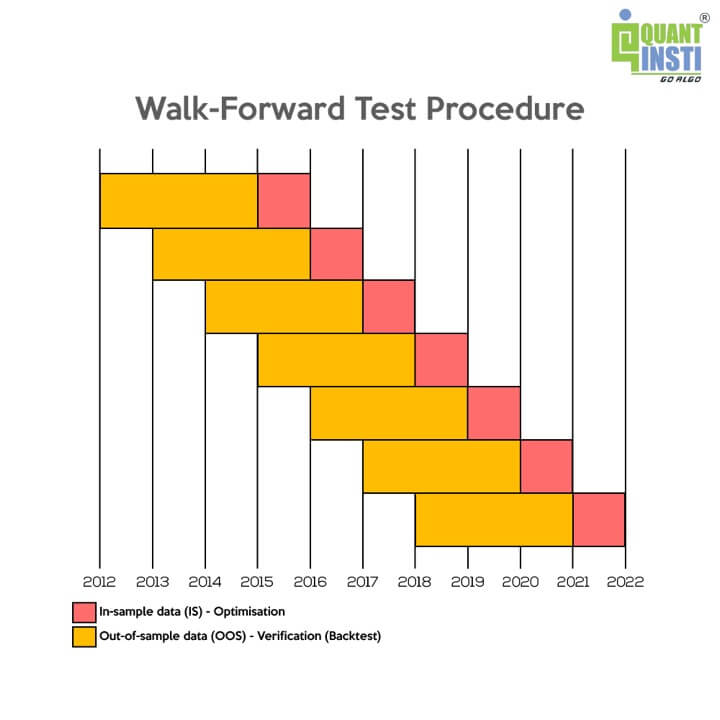
Let us consider a strategy based on moving average crossover, where we need to determine the optimal moving average periods. Suppose we have ten years of historical data. The walk forward testing process can be summarised as follows:
- Select an initial period, such as the first three years of data.
- Calculate moving averages using different periods and identify the most optimal combination, e.g., 50 and 200 moving days.
- Validate the strategy's performance by applying it to the fourth year's data and assessing various performance metrics.
- Repeat the optimisation process using data from years 2 to 4, and validate the strategy using the fifth month's data.
- Continue this iterative process, gradually moving the training and testing periods forward until reaching the end of the data.
- Collate the performance results from all the out-of-sample data, which encompasses years 4 to 10. This aggregated performance represents the out-of-sample performance.
By following this walk-forward testing approach, you can better understand the strategy's performance as it adapts to changing market conditions. It helps to avoid overfitting to past data and provides a more reliable assessment of how the strategy may perform in the future.
Now, we can see the clear difference between backtesting and walk-forward trading testing.
|
Backtesting |
Walk forward trading testing |
|
Backtesting involves testing a trading strategy using historical data to assess its performance and profitability. |
Walk forward testing is an advanced method that combines elements of backtesting and out-of-sample testing. It aims to address the limitations of backtesting by incorporating ongoing optimisation and validation steps. |
|
Backtesting relies on historical price and market data to simulate trades and calculate performance metrics. It allows traders and investors to simulate trades and analyse how the strategy would have performed in the past. |
Walk forward testing divides the historical data into multiple segments, such as in-sample (training) and out-of-sample (testing) periods. |
|
Traders often fine-tune the strategy's parameters during backtesting to achieve the best possible results for the selected historical period. |
The strategy is optimised using the in-sample data, and its performance is evaluated on the out-of-sample data. This process is repeated over multiple segments of data, gradually moving forward in time. |
|
Backtesting does not provide a reliable indication of future performance, as it only assesses how the strategy would have performed in the past. |
Walk forward testing allows for ongoing adjustments and refinements to the strategy based on changing market conditions and performance feedback from out-of-sample testing. |
Backtesting vs Scenario analysis
Let us first of all discuss a bit about scenario analysis and find out what it is.
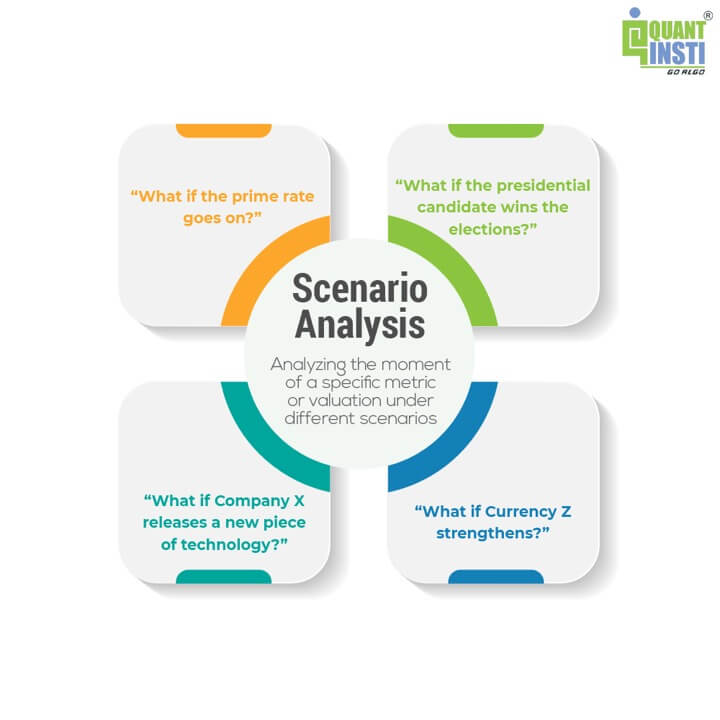
Scenario analysis is a strategic planning and decision-making technique used to evaluate the potential outcomes of different hypothetical scenarios or events. It helps investors and decision-makers assess the impact of various factors on their strategies and investments.
By considering a range of possible future scenarios, scenario analysis enables a more comprehensive understanding of risks, opportunities, and potential outcomes.
|
Topic |
Backtesting |
Scenario analysis |
|
Meaning |
Backtesting, as mentioned earlier, involves testing a trading or investment strategy using historical data. |
Scenario analysis is a strategic planning and decision-making technique used to evaluate the potential outcomes of different hypothetical scenarios or events. |
|
Analysis |
It focuses on objective analysis or only quantitative analysis by applying the strategy's predefined rules to historical data and measuring its outcomes. |
It combines qualitative assessments and quantitative models to evaluate the potential outcomes of each scenario. |
|
Evaluation |
Backtesting has a retrospective evaluation. It provides a look into the past performance of a strategy and helps identify strengths, weaknesses, and areas for improvement. |
Scenario analysis takes into account the forward-looking evaluation. Scenario analysis focuses on assessing future possibilities and helps decision-makers understand the potential risks and opportunities associated with different scenarios. |
|
Outcome |
Backtesting relies on historical data and assumptions that may not accurately represent future market conditions. It does not account for real-time execution challenges or unexpected events. |
Scenario analysis provides insights that can inform decision-making, risk management, and strategic planning by considering a range of potential outcomes. |
Common mistakes while backtesting
A robust backtesting process should take into account certain drawbacks or the common mistakes and biases that can significantly impact the results. Some of these considerations include:
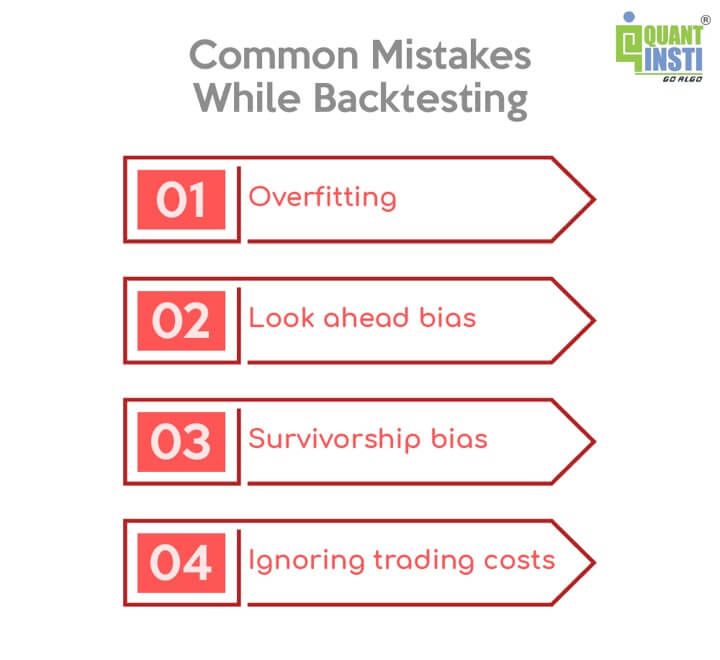
Overfitting/Optimisation Bias
Backtesting can be prone to overfitting, where the strategy is excessively tailored to fit historical data. This can lead to unrealistic performance results that may not hold up in real-world conditions. To mitigate overfitting, it is important to divide the dataset into training and testing sets, validate the strategy on the testing set, and avoid excessively optimising parameters based solely on historical performance.
Look ahead bias
Look-ahead bias occurs when future information is unintentionally used in the backtesting analysis, leading to unrealistic performance results. It is essential to ensure that only information available at the given point in time is used during the process of backtesting trading strategies. This requires careful attention to data availability and the exclusion of any future information that would not have been known during the historical testing period.
Survivorship bias
Survivorship bias refers to the exclusion of data from assets or entities that no longer exist in the current dataset, leading to an incomplete or skewed picture of performance. When backtesting trading strategies, it is important to consider the entire historical universe, including assets that may have been delisted or companies that no longer exist. Failing to account for survivorship bias can result in overly optimistic performance results.
Ignoring trading costs
Backtesting should consider the impact of trading costs, such as commissions, taxes, and slippage. Ignoring these costs can significantly distort the profitability of a strategy. Incorporating realistic transaction costs into the backtesting process of a trading strategy provides a more accurate representation of the strategy's performance and helps avoid overestimating potential profits.
Selecting a backtesting software or backtesting platform
There are various backtesting platforms and backtesting software available that provide the functionality to perform backtesting on historical data.
Choosing the right backtesting platform
- Data Quality: Ensure the platform provides access to high-quality historical market data across various asset classes and timeframes.
- Data Coverage: Check if the platform covers the specific markets and instruments you intend to trade, including stocks, forex, futures, and options.
- Data Source: Check the sources of the market data feeds which are supported
- Asset Class Support: Check which asset classes does the platform support.
- Customization: Look for a platform that allows you to customize parameters such as trading costs, slippage, and position sizing to accurately simulate real-world conditions.
- Ease of Use: Choose a platform with an intuitive user interface and robust features that align with your level of expertise and trading style.
- Coding: Figure out which programming languages can be used to code the trading strategy which is to be tested.
- Strategy Testing Capabilities: Evaluate the platform's ability to test complex trading strategies, including multi-leg and algorithmic strategies.
- Performance Metrics: Ensure the platform provides comprehensive performance metrics such as profitability, drawdowns, risk-adjusted returns, and trade statistics for thorough analysis.
- Backtesting Speed: Consider the platform's processing speed to efficiently test multiple strategies and scenarios within a reasonable timeframe.
- Support for Automation: If you plan to automate your trading strategies, verify that the platform supports automated backtesting and integration with trading APIs or platforms.
- Community and Support: Look for a platform with an active user community or reliable customer support to address any questions or issues that may arise during the backtesting process.
- Cost and Value: Compare the pricing plans and features offered by different platforms to ensure you're getting good value for your investment based on your specific needs and budget.
Why prefer backtesting software
It is important to note that there are several reasons why someone should prefer specialised software for backtesting instead of relying solely on Python. Here are a few key considerations.
- Efficiency and speed: Specialised backtesting software is often optimised for performance, allowing for faster execution of complex backtesting calculations. These tools are designed to handle large datasets and complex trading strategies efficiently, which can be especially beneficial when working with high-frequency or intraday data.
- Pre-built functionality: Backtesting software often provides a wide range of built-in functions and indicators specifically tailored for financial analysis and trading strategies. These functionalities can save time and effort compared to implementing everything from scratch in Python. Additionally, software may have integrated data feeds, allowing for seamless integration and access to historical and real-time market data.
- Visualisation and reporting: Many backtesting software tools offer advanced charting and visualisation capabilities, making it easier to analyse and interpret backtest results. These tools often provide interactive charts, performance metrics, and customizable reports, enabling traders to gain valuable insights and communicate their findings effectively.
- User-friendly interfaces: Backtesting software typically provides user-friendly interfaces and intuitive workflows designed for traders and quantitative analysts. These interfaces often include drag-and-drop functionality, customizable settings, and backtesting wizards, making it easier for users to define and test their trading strategies without extensive programming knowledge.
- Community and support: Popular backtesting software often have active user communities and dedicated support channels. This can be valuable for getting assistance, sharing ideas, and accessing additional resources to improve the backtesting process. The software providers may also offer documentation, tutorials, and training materials to help users maximise the potential of their tools.
List of backtesting software
Coming to a list of software for backtesting, some of the common backtesting software and live trading software are:
- Blueshift
- MetaTrader
- Amibroker
- QuantConnect
- Quanthouse, etc
Recommended watch
A complete overview of working with data, formulating and backtesting a trading strategy can be seen in this video below. The video explains all about working with data, formulating and backtesting a trading strategy.
Backtesting vs Paper Trading vs Live Trading
The following is a table of distinction between Backtesting, Paper Trading and Live Trading for better clarity and understanding.
| # | Aspect | Backtesting | Paper Trading | Live Trading |
| 1 | Purpose | Test strategies | Simulate trades | Execute trades |
| 2 | Data Required | Historical data | Real/historical data | Real-time data |
| 3 | Emotional Impact | None | Low | High |
| 4 | Risk | No financial risk | No financial risk | Real risk |
| 5 | Market Realism | Historical context | Simulated market | Real market |
| 6 | Learning Experience | Understand performance | Simulated environment | Real experience |
| 7 | Costs | Platform fees | Platform fees | Brokerage fees |
| 8 | Strategy Refinement | Fine-tune strats | Test strategies | Adapt to market |
| 9 | Feedback | Quantitative | Simulated P/L | Real P/L |
| 10 | Flexibility | Flexible testing | Try strategies | Market-driven |
| 11 | Psychological Impact | None | Minimal | High |
| 12 | Strategy Optimisation | Optimize parameters | Adjust strategies | Constant adjustment |
| 13 | Market Slippage | May not account | Depends on simulation | Real slippage |
| 14 | Market Liquidity | Historical liquidity | Depends on simulation | Real liquidity |
| 15 | Order Execution | Assumes instant fill | Simulated fills | Real fills |
| 16 | Trade Impact | Doesn't affect market | Doesn't affect | May affect market |
| 17 | Strategy Validation | Validate effectiveness | Validate feasibility | Real validation |
| 18 | Time Commitment | Less time | Moderate time | Active monitoring |
Steps after backtesting - Paper trade or Live trade
You created the strategy and analysed the performance of the strategy.
Can you directly start with paper trading or live trading?
When should you consider your strategy for paper trading or live trading?
The answer is that if you are satisfied with the backtesting strategy performance, then you can start paper trading. If not, you should tweak the strategy until the performance is acceptable to you. And once the paper trading results are satisfactory, you can start live trading.
Process of paper trading and live trading
You can briefly take a look at the flowchart below to understand until when you should do paper trading.

The satisfactory level of strategy performance depends on the returns you are expecting from your trading strategy.
Only when you feel that the strategy looks to be performing well on the historical data and can be taken ahead for live trading, you must go ahead with the same.
How many backtests should you do before taking a strategy live?
Well, there is no fixed number. You can take your strategy live after backtesting once or it can be after multiple backtesting. As we mentioned in the previous question, once you are satisfied with the backtesting results, you can consider your trading strategy for paper trading and live trading.
This tutorial will help you gain clarity about how to go about backtesting and Live Trading using Blueshift:
Backtesting benefits and drawbacks
The following are a list of the benefits of backtesting and the drawbacks of backtesting:
| Aspect | Backtesting Benefits | Backtesting Drawbacks |
| Accuracy | Provides quantitative analysis of strategy | Assumes historical data reflects future market |
| Risk Management | Helps identify potential risks | Doesn't account for all real-world factors |
| Strategy Refinement | Allows fine-tuning of trading strategies | Limited by historical market conditions |
| Cost Effectiveness | Low cost compared to live trading | Doesn't capture all nuances of live trading |
| Learning Experience | Helps traders gain experience | May lead to over-optimization of strategies |
| Time Efficiency | Saves time by quickly testing strategies | Doesn't replace real-time market experience |
| Data Analysis | Offers comprehensive performance metrics | Requires interpretation and analysis |
| Confidence Building | Builds confidence in trading strategies | Results may not always translate to live trading |
FAQs about backtesting
Q: What historical data do I need for backtesting?
A: You typically need historical price data for the assets you're trading, including open, high, low, and close prices, as well as volume data.
Q: Can I use Excel for backtesting?
A: Yes, you can use Excel for simple backtesting tasks, although more advanced strategies may require specialized backtesting software or programming languages like Python which are preferred by Traders.
Q: How far back should I backtest my strategy?
A: It's generally recommended to backtest your strategy over a significant period, preferably several market cycles, to ensure its robustness.
Q: What metrics should I use to evaluate backtest results?
A: Key metrics include profit and loss (P&L), risk-adjusted returns (such as Sharpe ratio), maximum drawdown, and win rate.
Q: Can I backtest intraday trading strategies?
A: Yes, you can backtest intraday trading strategies by using intraday price data and adjusting your backtesting methodology accordingly.
Q: Is backtesting suitable for all types of trading strategies?
A: Backtesting is generally suitable for quantitative trading strategies that can be precisely defined and executed based on historical data.
Q: How often should I backtest my trading strategy?
A: You should periodically backtest your trading strategy to ensure its effectiveness and make any necessary adjustments based on changing market conditions.
Q: Are there any free backtesting tools available?
A: Yes, there are some free backtesting tools and platforms available online, although they may have limitations compared to paid options.
Q: What role does backtesting play in algorithmic trading?
A: Backtesting is crucial in algorithmic trading as it helps developers optimize and refine their trading algorithms before deploying them in live markets.
Q: Can backtesting detect overfitting?
A: Backtesting can help detect overfitting by assessing how well a trading strategy performs on out-of-sample data that it hasn't been optimized for.
Q: How can I backtest options trading strategies?
A: Backtesting options trading strategies may require additional complexity due to the multi-dimensional nature of options pricing and strategies.
Q: Can backtesting account for market slippage?
A: Yes, backtesting can account for market slippage by simulating realistic trade execution scenarios, although it requires careful consideration and modeling.
Bibliography
- https://en.wikipedia.org/wiki/Backtesting
- https://www.indiainfoline.com/knowledge-center/online-share-trading/what-is-backtesting
- https://kernc.github.io/backtesting.py/
- https://www.ig.com/en/trading-strategies/what-is-backtesting-and-how-do-you-backtest-a-trading-strategy--220426
Conclusion
Backtesting proves to be one of the biggest advantages of Algorithmic Trading because it allows us to test our trading strategies before actually implementing them in the live market. In this blog, we have covered all the topics that one needs to be aware of before starting backtesting.
You can improve your likelihood of success in trading by backtesting your trading rules on historical data. This course on backtesting trading strategies by Quantra is just what you need to get the best out of your trading. Learn everything from the basic steps, data, rules, risk management and more. Enroll now!
File in the download
- Backtesting Python code
Authors: Chainika Thakar and Vibhu Singh
Note: The original post has been revamped on 14th August 2023 for accuracy, and recentness.
Disclaimer: All data and information provided in this article are for informational purposes only. QuantInsti® makes no representations as to accuracy, completeness, currentness, suitability, or validity of any information in this article and will not be liable for any errors, omissions, or delays in this information or any losses, injuries, or damages arising from its display or use. All information is provided on an as-is basis.