In this day trading guide, let us find out how traders speculate on securities within the same trading day, aiming to take advantage of short-term price movements and much more.
As a beginner, it is important to be knowledgeable about a few things while engaging in day trading.
The first and foremost is that you must trade only with the optimal amount of money you can afford to risk. Also, staying informed about market news and updates is essential.
Let us explore all of this and much more with this blog that is aimed to help you become an informed day trader.
All the concepts covered in this blog are taken from this Quantra learning track on Day Trading Strategies for Beginners. You can take a Free Preview of the course.
Day trading for beginners is not a difficult concept if all the essentials are taken care of.
Let us find out more with this day trading guide and become equipped with the necessary information needed to begin day trading.
This blog covers:
- What is day trading?
- Day trading strategies
- What all can be traded?
- Characteristics of the best day trading stocks
- Prerequisites for day trading
- Skills required as a day trader
- Tips to consider
- Market dynamics and types of market analysis
- Key trading terminology and jargon
- Candlestick chart patterns
- Basic elements of technical analysis in day trading
- Technical indicators used in day trading
- Risk and money management as a day trader
What is day trading?
Day trading involves speculating on securities by buying and selling financial instruments within a single trading day. Day traders must close all their positions before the market closes to minimise the risk of potential losses resulting from unforeseen events during non-trading hours.
By doing so, day traders can avoid the price gap between the closing price of one day and the opening price of the next day, which could impact their decision-making process.
Day trading strategies
Once you've selected what to trade in day trading, choosing the right strategy is crucial for maximising your gains. You can specialise in a specific strategy or combine different strategies to suit your needs. In our algo trading strategies article, we provide detailed explanations of various trading strategy paradigms.
To further deepen your understanding and application of these strategies, consider enrolling in algo trading courses. These courses offer valuable insights into developing and refining your trading strategies, allowing you to apply them effectively in real-market scenarios.
Here, we'll provide a brief overview of popular trading strategies, which are covered in depth in our course titled Day Trading Strategies for Beginners.
These strategies are:
- Momentum trading strategy
- Scalping strategy
- Ticking strategy
Momentum Trading Strategy
This strategy is based on the principle that if a security is moving upward, it will likely continue in the same direction, and vice versa. Time-series momentum and cross-sectional momentum are two ways to exploit momentum, both of which are explained extensively in our Momentum Trading Strategies course.
Be sure to check out this brief and insightful video that delves into Momentum Trading Strategies in financial markets and how it works?
Scalping Strategy
Scalping involves holding positions for a very short period to take advantage of small profits. Traders implementing this strategy, known as scalpers, aim to accumulate small profits from each trade, which can add up significantly with a larger number of trades. Scalpers act as market makers, buying at the bid price and selling at the ask price to capitalise on the bid-ask spread.
Ticking Strategy
A tick represents the minimum price movement of a security. It can indicate an upward or downward change in price from trade to trade. An uptick occurs when a trade is at a higher price than the previous trade by at least the tick size, while a downtick occurs when the trade is at a lower price by at least the tick size. The ticking strategy aims to profit from the bid-ask spread by buying slightly above the best bid price and selling just below the best offer price.
Going forward, below in the video you can check a series of video recordings of the discussion table conducted by QuantInsti exclusively for the students of the Executive Programme in Algorithmic Trading (EPAT). This video will give you a clear understanding about the results you can expect from day trading.
Further, for a comprehensive understanding of day trading strategies, we recommend exploring our course materials, which include recorded discussion tables conducted by QuantInsti exclusively for students enrolled in the Executive Programme in Algorithmic Trading (EPAT).
For these materials, algo trading for beginners offers valuable insights into essential strategies and practical applications, helping newcomers build the foundational knowledge needed for algorithmic trading. With the right resources, beginners can develop their skills progressively, gaining confidence to explore more advanced techniques.
Additionally, you can watch the introductory video on day trading strategies for further insights.
What all can be traded?
In our article, "Introduction to Financial Markets," we have provided a detailed overview of what is traded on exchanges.
Here, we present a brief explanation of several markets that day traders can explore:
- Forex
- Stocks
- Cryptocurrencies
- Futures
- Commodities
- Bonds
Forex
The foreign exchange (forex) market is globally recognized as the most popular and liquid market. It offers trading opportunities for currencies such as INR, GBP, US Dollars, and Euros.
Enhance your forex trading skills by enrolling in our free forex trading course, where you can learn to develop and backtest trading strategies specific to the forex markets.
Additionally, we provide a concise video tutorial that demonstrates how to engage in forex trading using Python.
Stocks
The stock market offers individuals the opportunity to invest in a wide range of company stocks, either within the same industry or across various industries. You can invest in stocks through regular and leveraged ETFs, futures, and stock options.
To learn more about selecting stocks for day trading, we recommend watching the informative video below from Quantra:
Cryptocurrencies
The cryptocurrency market represents the third major market where you can invest and trade. It provides abundant opportunities to engage with cryptocurrencies such as Bitcoin and Ethereum.
To gain a deeper understanding of the crypto markets, Quantra offers two courses that you can choose from:
- Crypto trading course: Intermediate
- Crypto trading strategies: Advanced
Additionally, you can expand your understanding of the cryptocurrency market in India by referring to this blog that details its journey.
By exploring these resources, you can further your knowledge and expertise in trading cryptocurrencies.
Futures
Futures contracts provide day traders with the option to speculate on price movements in various assets. They offer leverage and liquidity, allowing traders to control larger positions with smaller capital investments.
Day traders aim to profit from short-term price fluctuations and can enter and exit positions within the same trading day. Understanding the risks and developing effective strategies are crucial for successful futures trading.
Explore our Futures Trading Course to dive deeper into the concept and gain knowledge on how to trade systematically in the futures market.
Commodities
Commodity trading is an additional option available for day trading. It involves investing in commodities like oil, natural gas, agricultural produce, metals, minerals, and more.
The commodities market offers a wide range of options, allowing traders to invest in diverse assets ranging from gold to cocoa. If you're interested in gaining knowledge about the commodities market, we recommend referring to our comprehensive blog dedicated to this topic.
Bonds
Bonds are fixed income securities used by companies or governments, known as bond issuers, to raise debt from investors, known as bond holders.
There are various types of bonds, including zero coupon bonds that do not pay interest, callable bonds that can be redeemed before the specified maturity date, and convertible bonds that can be exchanged for shares of a company. Many corporate or government bonds are traded publicly on exchanges, while others are traded over-the-counter (OTC).
Characteristics of the best day trading stocks
When searching for the best day trading stocks, it is important to consider the characteristics that make them suitable for day trading. These characteristics include:

A well-tracked stock
A well-tracked stock by you will be a familiar one in the context of various factors such as volatility, price change triggering factors, etc.
Good volume
Stocks which are high in volume lead to liquidity and liquidity is a factor which allows you, as a trader, to purchase and sell the stock without impacting the price much. The high volume of stocks in the market implies the number of shares being traded over a period.
For instance, 10 transactions of 100 shares is the same as 100 transactions of 10 shares. This is so because, in total, 100 shares are traded. Since the number of shares being traded each day are available online, one can follow the volume with ease.
Medium to high volatility
Stocks, of which the price fluctuates a lot are considered highly volatile stocks and thus, are good for day trading.
Day traders must analyse stocks to track the movements of the same. Once you become familiar with the stock market’s process, your knowledge will help you to decide when to buy and sell on the basis of how a stock had performed in the past.
Prerequisites for day trading
There are certain prerequisites which every day trader must keep in check while beginning the practice since these are the essentials that help you carry out your operations efficiently. These are:

PC
Technical specifications of PCs should be favourable such as RAM and operating system. Moreover, since analysing the market is important, the screen should be comfortable to look at for each day’s analysis of the financial market.
Setting up brokerage account
You must choose the right broker for your day trading and we have a list of reliable brokers from India, U.S.A, U.K, EU and Canada for you in our blog article on the algorithmic trading guide. You can check out the brokers and the APIs mentioned here.
Demat account
You can open your Demat account with your banking partner in case you are not trading via a broker. This is so because a broker will provide you with such facilities.
Reliable internet connection
A reliable internet connection is one of the most important prerequisites for day trading since you would not want your internet server going down when you are in the middle of your trading.
Understanding market hours and trading sessions
Day traders need to be aware of the specific market hours and trading sessions during which their chosen stocks are most actively traded. This ensures sufficient liquidity and volatility, which are essential for executing trades effectively.
Technical and fundamental analysis for day trading
Day traders utilise both technical and fundamental analysis to identify potential trading opportunities. Technical analysis involves studying price charts, indicators, and patterns to predict short-term price movements.
Fundamental analysis focuses on evaluating the underlying factors affecting a stock's value, such as financial performance, news, and market sentiment.
Choosing the right trading platform
Selecting a reliable and efficient trading platform is vital for day traders. The platform should offer real-time market data, fast order execution, advanced charting tools, and customizable features to meet individual trading strategies and needs.
Skills required as a day trader
Having a skill set is quite an important thing not only for a day trader but also for any professional in any field.
Some of the skills may be required in general for carrying out trading, but for a successful day trading practice you need to be equipped with the following to experience smooth journey:
Trading or Financial markets knowledge
It's all about knowing how financial markets work, including different types of investments, trading instruments, and who's involved.
Quick with decision making
Quick decision making is needed to get hold of opportunities in the market. Hence, You've got to think fast and act decisively while entering and exiting the market.
Mathematical skills for carrying out trading strategies
It is important to have mathematical skills for creating such strategies that can increase your returns.
Knowledge of forecasting and analysing market trends
Looking at past data and comparing the same with the current events to predict where the market might be headed in the future is important while trading.
Know-how of risk management as well as money management
Being smart about managing risks is integral so you don't end up losing everything on a bad trade.
Planning skills for deciding about trading strategies
It is important to create solid, well-thought-out strategies that fit your goals and risk tolerance when you dive into the markets.
Tips to consider
Day trading brings with itself a lot of things that are needed to be taken care of as a beginner.
To begin with, let us discuss some simple yet extremely useful things that you can take care of while engaging in day trading practice:

Trade only the optimal amount of money
You must trade with the money which does not make you lose your fortune or get you into debt which you won’t be able to repay in case of losses.
You must not be risking much of your capital on each trade. You need to know the position size of your trade.
The position size here implies the number of shares you take on a trade. Before deciding the number of shares, you must consider the account size and risk tolerance capacity as an investor. This way, you can set a stop-loss price during entry.
Usually, it is the Money at risk/Trade risk = Optimal position size
Money at risk is the amount you can afford to risk and Trade risk is the general risk of trading in the market.
Be informed
Before you start day trading, you need to be equipped with the knowledge required to maximize your gains. Make sure you understand how the stocks you plan to trade move and stay updated on the latest news in the stock market, including any unlikely events that may affect stock prices. Start with our free stock market beginner course.
To remain informed, one should keep a check on result announcements since that way, the investor can invest in securities after analysing last quarterly or annual results. This way, the day trader can analyse the viability of stock returns after analysing financial supplements/disclosures made by companies. Return metrics such as RoE (Return on Equity), Dividend payout ratio, Operating efficiency, P/E ratio etc can be assessed in order to make an informed decision.
Another important way of being informed is with the help of sentiment analysis in trading. By analysing the sentiments portrayed by news and tweets, you can create such trading strategies which will help you gain. The sentiment analysis can be best done by various machine learning techniques, such as Natural language processing, Classification and Support vector machine.
Then, the sentiment scores can be calculated using techniques such as VADER.
You can read more about devising new trading strategies using sentiment data with Quantra course.
Keep your day job
As a beginner, you may not get familiar with all the ups and downs of the stock market very soon. In the beginning, you may have a good time with luck and you get to sustain in the market. It is more of a possibility, especially in a favourable market.
Although, in the case of an unfavourable situation market, your strategy will actually be tested. After seeing all the ups and downs in the market, if you feel that you can go on for full-time trading, you should take a plunge.
Have enough time to track the market
The most important thing that you will need to devote while day trading is your time. This time goes into tracking the markets and getting the right opportunities. Since these opportunities arise anytime in the market during the trading hours, you need to keep a check.
Market dynamics and types of market analysis
Market dynamics pertains to the various forces and factors that impact the behaviour and movement of financial markets. Day traders need to grasp market dynamics to identify trends, patterns, and opportunities for potential profit.
There are two primary types of analysis for finding out the dynamics of the market:
- Technical analysis
- Fundamental analysis
Technical analysis
This approach involves examining historical price and volume data to identify patterns, trends, and potential price movements. Traders employ various tools and indicators to make predictions about future price behaviour based on historical patterns and market psychology.
Fundamental analysis
This method focuses on assessing the intrinsic value of an asset by analysing economic, financial, and qualitative factors. Fundamental analysis involves evaluating company financials, industry trends, news events, and macroeconomic indicators to determine the underlying value of a security.
By utilising a combination of technical and fundamental analysis, day traders can develop a well-rounded understanding of market dynamics and make more informed trading decisions.
Key trading terminology and jargon
In the world of trading, there are several key terminologies and jargon that traders should be familiar with. Some important ones include:
- Bid and ask prices
- Spread and slippage
- Volume and liquidity
- Long and short positions
- Order types
- Leverage and margin
- Pips, points, and ticks
Bid and Ask
The bid price represents the highest price a buyer is willing to pay for a security, while the ask price is the lowest price a seller is willing to accept. The difference between the bid and ask prices is known as the spread.
Spread
The spread refers to the difference between the bid and ask prices of a security. It represents the transaction cost or the amount a trader needs the market to move in their favour to break even.
Volume
Volume is the number of shares or contracts traded within a given period. It indicates the level of activity in the market and can provide insights into market liquidity.
Liquidity
Liquidity refers to the ease with which a security can be bought or sold without causing significant price movements. High liquidity means there are ample buyers and sellers, while low liquidity can lead to wider spreads and potentially more slippage.
Slippage
Slippage occurs when a trade is executed at a different price than the expected price. It can happen due to market volatility, low liquidity, or delays in order execution.
Long and Short Positions
Taking a long position means buying a security with the expectation that its price will rise, allowing for a profit upon selling. Taking a short position involves selling a security that is not owned, with the expectation that its price will decline, aiming to buy it back at a lower price and profit from the difference.
Order Types
Market orders, limit orders, stop orders, and other order types are used to specify how and when trades should be executed. Market orders are executed immediately at the current market price, while limit orders allow traders to set a specific price at which they are willing to buy or sell. Stop orders are used to trigger a trade once a specified price level is reached.
Leverage and Margin
Leverage allows traders to control larger positions with a smaller amount of capital. Margin refers to the funds that traders must keep in their account to cover potential losses from leveraged trades.
Pips, Points, and Ticks
These terms are used to measure price movements in different markets. Pips are commonly used in forex trading to denote the smallest unit of price change, while points and ticks are used in other markets.
Being familiar with these trading terminologies and jargon is essential for effective communication and understanding within the trading community.
Candlestick chart patterns
When analysing charts in day trading, one must know how to read the candlestick chart patterns.
Candlestick charts represent price movements using individual candlesticks, and specific patterns can provide insights into potential market reversals or continuations.
Reading candlestick chart
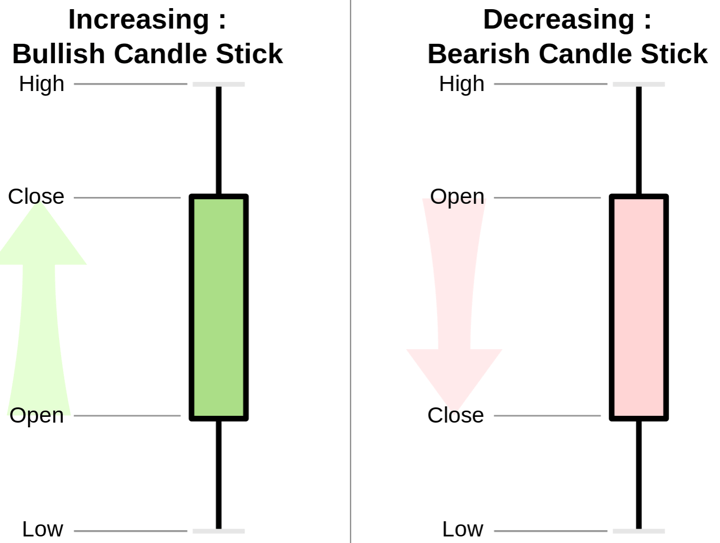
Reading the candlestick patterns is another essential topic here. When you are day trading, you must know what different points on a candlestick mean. As you can see, in the image below, there are two candlesticks. One is bullish and the other is bearish candlestick. Let us find out how.
Source: Wikimedia Commons
Each point depicts:
- High price implies the highest price traded during the period.
- Low price implies the lowest price traded.
- Open price depicts the first traded price after the formation of the candle. If the price trends upwards as compared to the previous day’s close price, the candle will turn green/blue. On the other hand if the price declines, the candle will turn red.
- Close price implies the last traded price over the period of formation of the candle. If the close price is below the open price, the candle will turn red. Whereas, if the close price is above the open price, the candle will turn blue/green.
The left image, which shows the bullish candlestick, is portraying that the open price is higher than the previous day’s close price. Whereas, the image on the right shows a bearish candlestick which portrays that the close price at the end of the day is lower than the open price.
Now, let us take a look at the three most commonly used candlestick patterns below.
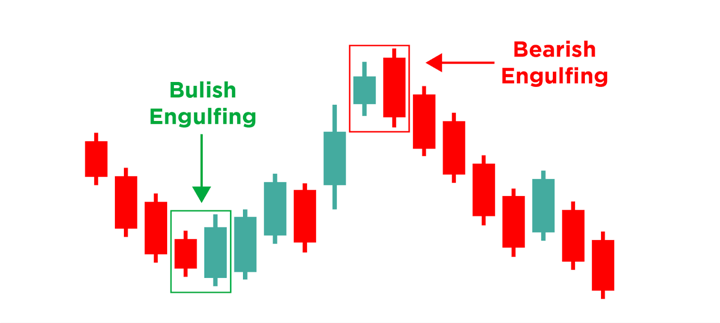
Bullish and bearish engulfing patterns
These candlestick patterns occur when the body of one candle completely engulfs the body of the previous candle, signalling a potential shift in market sentiment.
In the image below you can see that after the signal of “bullish engulfing” pattern, there is an upward shift of the candlesticks.
Whereas, after the signal of “bearish engulfing” pattern, there is a downward shift of the candlesticks.
Hammer and shooting star patterns
These candlestick patterns have distinct shapes and indicate potential reversals. The hammer pattern appears at the bottom of a downtrend, while the shooting star pattern appears at the top of an uptrend. This is what you can see in the image below.

Doji and spinning top patterns
These candlestick patterns have small bodies and indicate market indecision.
Doji patterns occur when the opening and closing prices are nearly the same. If the Doji pattern appears after an uptrend or downtrend, it may indicate a possible reversal. If it appears in the middle of a sideways consolidation, it might imply that the market remains undecided about the direction.
Spinning top patterns have small bodies with long upper and lower wicks. The spinning top pattern indicates a state of indecision and balance between buyers and sellers. It shows that neither side had control during the trading session, resulting in little net price movement.

Basic elements of technical analysis in day trading
There are two basic elements of technical analysis in day trading and these are:
- Support and resistance levels
- Trend lines and channels
Support and resistance levels
Support levels are price levels where buying interest is expected to outweigh selling pressure, potentially causing price bounces. Resistance levels are price levels where selling pressure is expected to outweigh buying interest, potentially causing price reversals.
As you can see in the image below, support level indicates that the ongoing downward movement is likely to halt.

Similarly, resistance level indicates that the ongoing upward movement is likely to halt and the reversal in the price movement is to be expected.

Support and resistance levels guide traders on where to buy (entry point) or sell (exit point) and where to place stop-loss orders.
Trend lines and channels
Trend lines indicate the direction of the trend. These help identify the current trend in the market. Upward-sloping lines show an uptrend, while downward-sloping lines show a downtrend. Day traders use trend lines to find breakout and pullback opportunities.
Channels are created by drawing parallel trend lines to define the price range within which the market is moving. Channels also help indicate the volatility.
Technical indicators used in day trading
Going forward, some of the technical indicators used in day trading are as follows:
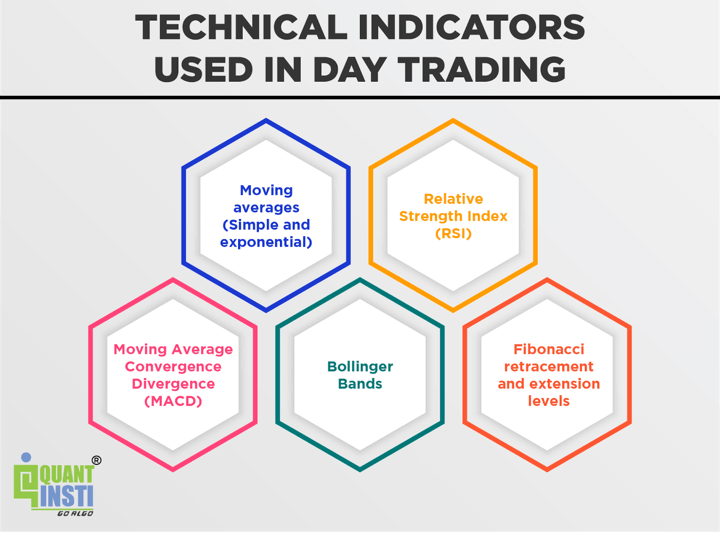
Moving averages
Moving averages smooth out price data and provide trend-following indicators. Simple moving averages (SMA) and exponential moving averages (EMA) are commonly used to identify trend direction and potential entry or exit points..
Relative Strength Index
The RSI is a momentum oscillator that measures the speed and change of price movements. It helps identify overbought or oversold conditions in the market.
Moving Average Convergence Divergence
The MACD is a trend-following momentum indicator that helps identify potential changes in trend direction, as well as bullish or bearish signals.
Bollinger Bands
Bollinger Bands consist of a moving average and upper and lower bands that represent volatility levels. They can help identify overbought or oversold conditions and potential price breakouts.
Fibonacci retracement and extension levels
Fibonacci levels are based on mathematical ratios and can be used to identify potential support and resistance levels, as well as price retracement and extension levels.
Understanding these concepts and incorporating them into trading analysis can assist traders in making more informed decisions and identifying potential trading opportunities. You can learn more about technical indicators in this course.
Risk and money management as a day trader
Risk and money management are critical aspects of day trading to protect capital and maintain long-term profitability. Here are key considerations for risk and money management as a day trader:
- Set Risk Parameters: Establish risk parameters before each trade, including the maximum amount you are willing to risk on a trade or a daily basis. This ensures that you don't expose your account to excessive losses.
- Position Sizing: Determine the appropriate position size for each trade based on your risk tolerance and the specific trade setup. Position sizing ensures that you allocate a reasonable portion of your capital to each trade, considering potential losses. Learn more about how position sizing in trading can help enhance your skills.
- Stop Loss Orders: Place stop loss orders to define the maximum loss you are willing to take on a trade. This helps protect against large losses and ensures that you exit a trade if it moves against your expectations.
- Take Profit Targets: Establish profit targets to secure gains and maintain discipline in exiting profitable trades. Take profit levels can be based on technical indicators, support/resistance levels, or predetermined reward-to-risk ratios.
- Risk-Reward Ratio: Determine a suitable risk-reward ratio for each trade. A favourable risk-reward ratio ensures that potential gains outweigh potential losses, enhancing the overall profitability of your trading strategy.
- Diversification: Avoid over-concentration in a single stock or market. Diversify your trades across different stocks, sectors, or asset classes to spread risk and mitigate the impact of individual trade outcomes.
- Risk Assessment: Continuously assess and manage the risk of your overall trading portfolio. Regularly review your trading strategy, risk parameters, and performance to identify areas for improvement and make necessary adjustments.
- Emotional Discipline: Maintain emotional discipline and avoid making impulsive decisions based on fear or greed. Stick to your predetermined risk management rules and trading plan, regardless of market fluctuations or short-term emotions.
- Practice Proper Record-Keeping: Maintain detailed records of your trades, including entry and exit points, profit/loss, and the rationale behind each trade. This allows you to review your trading performance, identify patterns, and refine your risk management strategies.
By implementing effective risk and money management techniques, day traders can minimise losses, protect capital, and increase the probability of long-term profitability in the dynamic world of trading.
Bibliography
Conclusion
Day trading offers traders the opportunity to profit from short-term price movements. By employing effective strategies, understanding market dynamics, and managing risk, day traders can aim for consistent profitability.
Key considerations in day trading include selecting the right stocks, setting up necessary accounts, acquiring relevant skills, and using technical analysis to make informed decisions. Understanding market hours, trading terminology, and utilising chart patterns and indicators are crucial for success.
It is essential to prioritise risk and money management, including setting risk parameters, using stop loss orders, and practising discipline in decision making. By following these principles, day traders can navigate the markets with confidence and increase their chances of achieving their trading goals.
You can learn more about day trading with our course on Day Trading Strategies for Beginners.
With this course, you can learn to day trade and automate your strategies using Python. You can learn all about momentum trading, scalping and high-frequency trading strategies. Moreover, this course will help you with learning how to do the in-depth analysis of these strategies on historical data. Last but not the least, you can paper trade and live trade without any installations and downloads.
Note: The original post has been revamped on 15th September 2023 for accuracy, and recentness.
Disclaimer: All data and information provided in this article are for informational purposes only. QuantInsti® makes no representations as to accuracy, completeness, currentness, suitability, or validity of any information in this article and will not be liable for any errors, omissions, or delays in this information or any losses, injuries, or damages arising from its display or use. All information is provided on an as-is basis.