Every time a wallet moves a few thousand bitcoin onto an exchange, crypto social feeds light up with "whale alert" posts. Some traders read these as a sell signal. Others call them noise that arrives after the price has already moved. So which is it?
This EPAT project by Hui Min Neo (Batch 69) set out to answer that with data rather than opinion. She built machine learning classifiers that predict next-day BTC/USDT direction from three kinds of input: price data, on-chain network activity, and derivatives positioning data that includes a whale index. She then tested whether the "whale" inputs added anything the price chart didn't already carry.
What makes this project unusual is how it was tested. Hui Min locked her selection rule and success criterion in a pre-registration before looking at the final holdout data, charged realistic trading costs throughout, checked the winning setup against a multiple-testing hurdle before opening the test data, and judged the final test with a block bootstrap confidence interval. Under those conditions, the edge she had hoped to find did not hold up. Her final verdict: not confirmed.
A negative result reported carefully is more useful than a positive one reported loosely. This article walks through the idea, the research design, and what the result tells anyone thinking about trading on whale alerts.
Project idea
Blockchains are public. Anyone can see when large holders, often called whales or "smart money", move coins between wallets and exchanges. The idea behind this project is simple: if those movements reflect informed positioning, they might lead price, and a machine learning model might be able to pick that up.
Project abstract
The project tests three hypotheses: that whale-activity features carry predictive information for next-day Bitcoin returns (H1), that a model combining them with price data beats a price-only model after costs (H2), and that any predictive power depends on the market regime (H3).
A pre-study first checked simple "whale proxies" built from 4-hour price and volume data. Every variant lost money, even under a lenient cost assumption, which motivated the switch to real on-chain and derivatives data.
The main study covers 1,747 trading days, from 15 November 2020 to 7 May 2026. It compares 30 pre-registered configurations (3 models, 5 feature sets and 2 threshold settings) using walk-forward testing after costs of 0.15% per side. The best configuration on development data was locked and run once on a held-out test period. It returned a Sharpe ratio of -1.37, with a 95% confidence interval of -2.86 to +0.28. None of the three hypotheses was supported.
Strategy idea
The original proposal compared three models: a price-only baseline, a whale-only model, and a combined model. Through several rounds of mentor review, this grew into a broader, controlled comparison. Each configuration predicts the next day's BTC direction. Only the inputs, the model and the trading threshold change, so differences can be traced back to those choices.
| Feature set | Features (count) | Question it answers |
|---|---|---|
| Market | Lagged returns (1, 3, 7 days), 14- and 30-day volatility, RSI-14, MACD signal crossover, volume ratio (8) | How much can the price chart alone explain? |
| Whale on-chain | Transaction volume spikes (BTC and USD), transactions-to-volume ratio, fee spikes, mempool z-score, 7- and 14-day volume momentum, hash rate change (8) | Does network-level on-chain activity carry independent information? |
| Derivatives | CoinGlass whale index (z-score and daily change), funding rate, open interest, liquidations, top-trader long/short ratio, taker buy/sell imbalance (10) | Does positioning in the futures market add information? |
| Combined | Market plus whale on-chain (16) | Does on-chain data add value on top of price action? |
| All | Every feature group (26) | Does the full set beat any single group? |
Each feature set was paired with three classification models: logistic regression, random forest and XGBoost. Each was also paired with two threshold settings. In the first, the strategy goes long when the predicted probability of an up day is above 0.55 and short when it is below 0.45, and stays flat in between. The second uses a stricter 0.58/0.42. That gives 3 × 5 × 2 = 30 configurations.
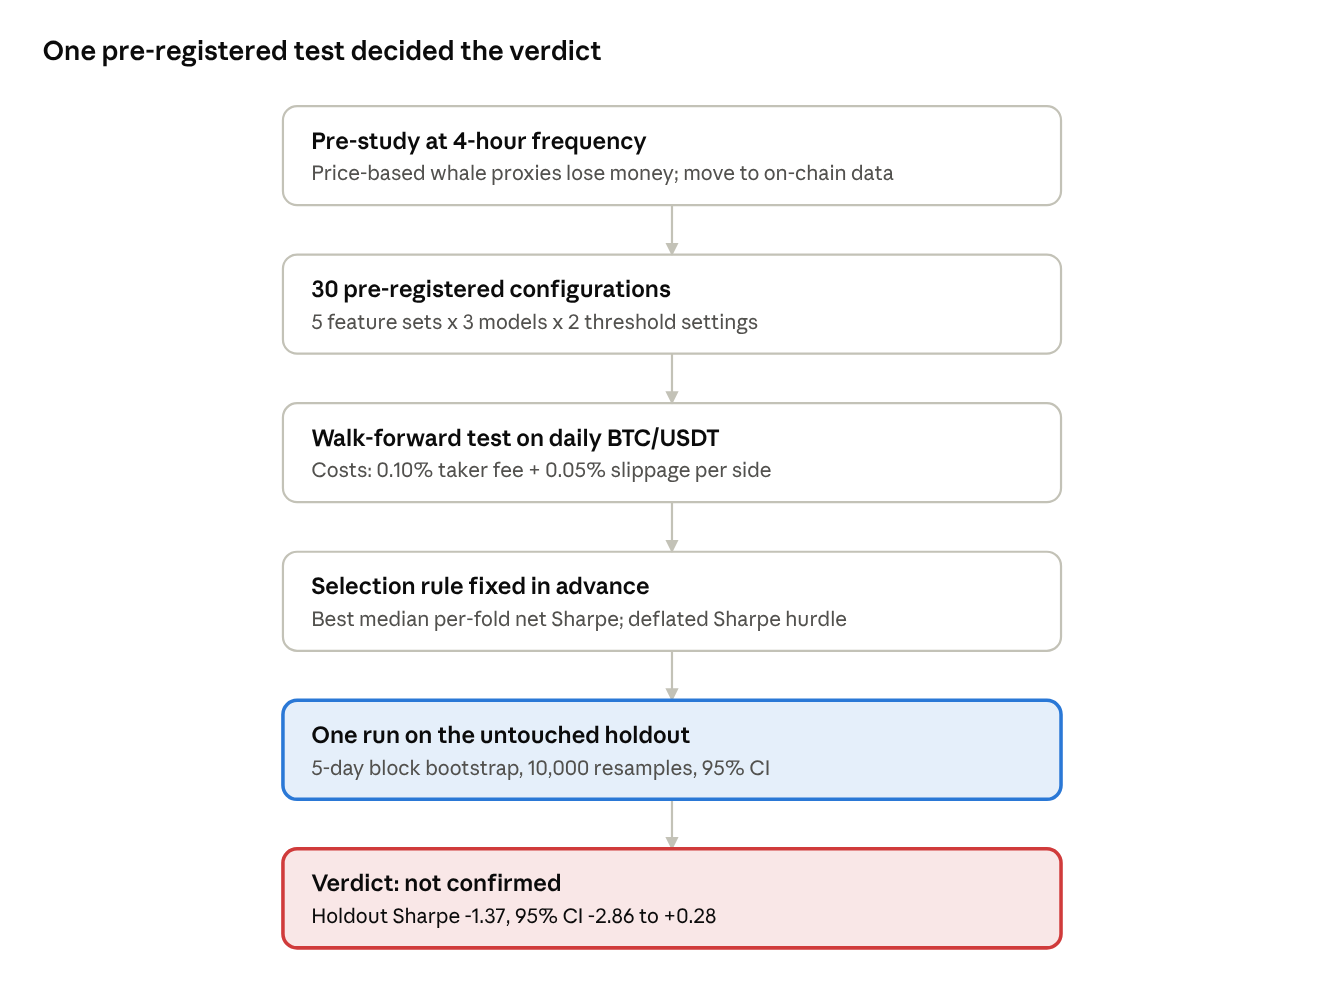
research design · pre-study to final verdict
All 30 configurations go through the same walk-forward test. Only the best one, chosen by a rule fixed in advance, reaches the untouched holdout.
Why pre-register?
When you test many combinations of models, features and thresholds on the same data, one of them will usually look good by chance. Pre-registration guards against this. Hui Min wrote down the full grid, the selection rule and the success criterion before running the final test. Because exactly 30 configurations were tried, the deflated Sharpe ratio could account for that number when judging whether the winner was significant.
Dataset
The project combines three kinds of daily data. All raw files are bundled with the submission, so the notebook can be rerun without an internet connection.
| Data type | Details | Source |
|---|---|---|
| Market data | BTC/USDT OHLCV: daily bars for the main study, 4-hour bars for the pre-study | Binance, via the CCXT Python library |
| On-chain data | Six network metrics: transaction volume (BTC and USD), transaction count, fees, mempool size, hash rate | Blockchain.com Charts API |
| Derivatives data | Binance BTCUSDT futures: whale index, funding rate, open interest, liquidations, top-trader long/short ratio, taker buy/sell volume | CoinGlass |
The data was split by date, and the split was locked in the pre-registration:
| Block | Dates | Trading days | Role |
|---|---|---|---|
| Train | 15 Nov 2020 to 22 Sep 2024 | 1,245 | Model fitting in walk-forward folds |
| Validation | 23 Sep 2024 to 22 Sep 2025 | 305 | Development diagnostics |
| Test | 23 Sep 2025 to 7 May 2026 | 197 | Locked rule, scored once |
Train and validation together form the 1,550-day development span. Every fitting and selection decision used development data only.
Data processing
Three choices keep the comparison fair and free of look-ahead bias:
1. A common window.CoinGlass derivatives data, especially the whale index, is sparse before 2021. Rather than letting each feature set use a different history, every set is clamped to the window where all three data sources exist. That's why the study starts in November 2020 and not 2019, and why 634 earlier days were dropped.
2. Backward-looking features. Each on-chain and derivatives feature compares today's value with its own recent history, for example as a ratio to a rolling average or a rolling z-score. Only past data goes into each value.
3. A next-day target. Each row's label is the following day's BTC return, so the model only ever predicts a day it hasn't seen.
Look-ahead bias is one of the most common reasons a backtest looks better than live trading. During development, a regime filter that used the full-sample median volatility was replaced with an expanding-window version, so each day's regime is judged only on data available at the time.
Motivation
In traditional markets, large institutional orders are mostly hidden. In crypto, a big transfer onto an exchange is visible on the blockchain for anyone who looks. That transparency raises a fair question: does it create a real information asymmetry that a model can capture, or is the information priced in almost immediately?
Whale alerts are often dismissed as noise or as late-cycle indicators that only confirm a move after it's happened. Rather than accept or reject that view, the project measures it. By comparing a whale-aware model against a price-only baseline, it puts a number on how much (if anything) whale data adds.
The second motivation is interpretability. A model that predicts well but can't explain itself is hard to trust with capital. Adding an interpretability layer helps identify which specific on-chain behaviours actually lead price discovery, and whether alternative on-chain data could be a credible input for institutional-grade quantitative strategies.
Research design
A model that predicts direction isn't a strategy yet, and a strategy that looks good in a backtest isn't proof of an edge. The project was built in stages to keep those two things apart.
Step 1: A pre-study with price-based whale proxies
Can whale behaviour be inferred from exchange price and volume alone? Hui Min engineered seven "whale proxy" flags from 4-hour BTC/USDT candles, such as volume z-scores, volume spikes and conditional momentum flags. She tested them with XGBoost on a 70/30 time split, using a deliberately lenient cost of 0.05% per trade.
| Pre-study variant | Net Sharpe | Total return | Max drawdown |
|---|---|---|---|
| Price/volume baseline | -2.99 | -69.5% | -70.4% |
| Whale proxy flags only | -1.01 | -26.1% | -30.7% |
| Combined | -3.49 | -75.1% | -75.7% |
| Refined (top features) | -3.51 | -75.3% | -75.9% |
Every variant lost money. XGBoost gave zero importance to all four conditional whale flags, and when the flags fired, the next move was usually down rather than up. Because the cost setting favoured the proxies, the failure can't be blamed on costs. It justified moving to direct on-chain measurements.
Step 2: Walk-forward testing of 30 configurations
Each of the 30 configurations was trained on an expanding window of development history and tested on the next unseen window. The window then rolled forward and the process repeated, giving 20 folds. Each fold was scored once. This mimics how a strategy would be retrained in practice, and it produces a distribution of out-of-sample results rather than a single number.
Every result was measured after costs: Binance's standard spot taker fee of 0.10% plus 0.05% slippage, or 0.15% per side (0.30% round trip).
Step 3: A selection rule fixed in advance
The configurations were ranked by their median per-fold net Sharpe ratio. The median is harder to inflate with one lucky fold than the average. The rule was written into the pre-registration before the holdout was touched.
• Deflated Sharpe ratio. Before the test data was opened, the winner's development score was checked against a hurdle that accounts for 30 configurations having been tried. This stops a winner picked from many attempts from being mistaken for a real effect.
Step 4: One run on untouched data
The winning configuration was run once on a holdout period not used for any design or selection decision. One check then judged the result:
• Block bootstrap confidence interval. Daily returns aren't independent, so the confidence interval was built by resampling contiguous 5-day blocks of returns, 10,000 times. The pre-registered criterion was a 95% interval whose lower bound had to be above zero.
Feature ablation
A walk-forward ablation added the feature tiers one at a time to see whether each improved out-of-sample results after costs.
| Model | Market only | + On-chain | + Derivatives |
|---|---|---|---|
| Logistic regression | -0.21 | -0.58 | -0.26 |
| Random forest | -1.05 | -0.52 | -0.85 |
| XGBoost | -1.08 | -0.69 | -0.20 |
Out-of-sample net Sharpe ratio, development walk-forward.
The picture is mixed. Adding derivatives made two models less negative and one more negative, and every combination stayed below zero. No tier added a positive edge.
Key findings
None of the three hypotheses was supported. The locked strategy lost money on the test period, and its confidence interval failed the pre-registered criterion. The verdict is not confirmed.
Development: no configuration made money after costs
On the 1,550-day development span, all 15 model and feature-set combinations had a negative net Sharpe ratio. The best was -0.07.
| Model | Market | Whale on-chain | Derivatives | Combined | All |
|---|---|---|---|---|---|
| Logistic regression | -0.20 | -0.07 | -0.14 | -0.58 | -0.26 |
| Random forest | -1.05 | -0.24 | -0.41 | -0.52 | -0.85 |
| XGBoost | -1.08 | -0.69 | -0.90 | -0.69 | -0.20 |
Net Sharpe ratio after 0.15% per side, development walk-forward, 0.55/0.45 thresholds.
The models' ability to call direction was close to a coin flip. Out-of-sample ROC-AUC ranged from 0.49 to 0.53 across the 15 combinations. For XGBoost on whale on-chain features, the edge disappeared once costs passed about 0.02% per trade, far below realistic costs.
Selection: the winner didn't clear the multiple-testing bar
The pre-registered rule picked logistic regression on derivatives features, with 0.58/0.42 thresholds. Its median per-fold Sharpe on development data was +0.125. With 30 configurations tried, the deflated Sharpe ratio puts the best result expected from pure chance at +0.836. The winner fell well short of that before the test data was even opened.
Test: one run on unseen data
| Test period, 23 Sep 2025 to 7 May 2026 | Locked strategy (net) | BTC buy-and-hold |
|---|---|---|
| Sharpe ratio | -1.37 | -0.74 |
| 95% confidence interval (Sharpe) | -2.86 to +0.28 | n/a |
| Total return | -6.1% | -28.6% |
| Max drawdown | -6.1% | -49.5% |
| Time in market | 3% | 100% |
| Trades | 8 | 1 |
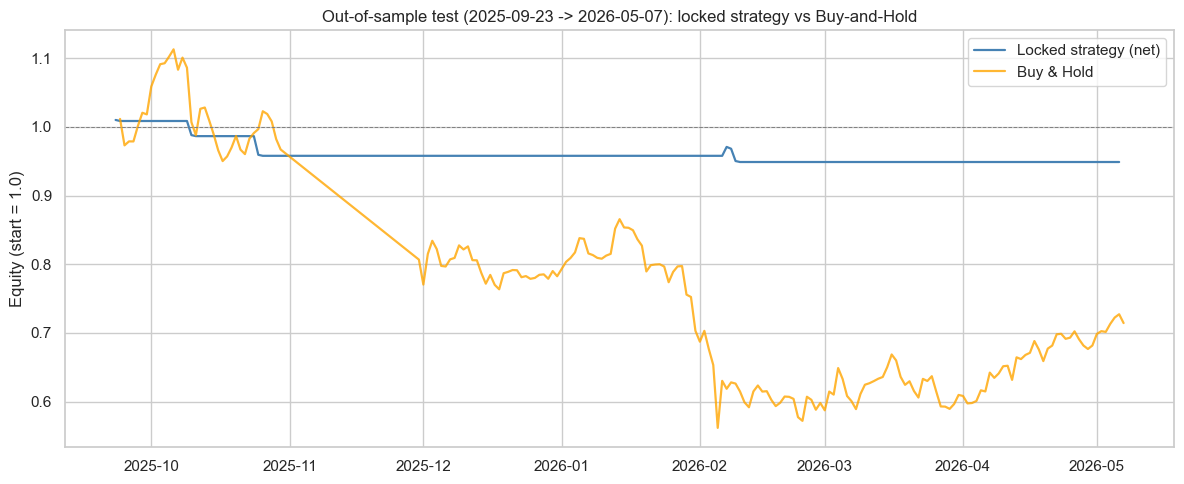
The strategy lost far less than buy-and-hold, but that isn't skill. It held a position on only 6 of 196 test days and sat flat the rest of the time, so it simply avoided most of Bitcoin's fall. Before costs, its Sharpe ratio was already -1.07, so costs didn't sink it either. The directional signal just wasn't there.
Which features did the models lean on?
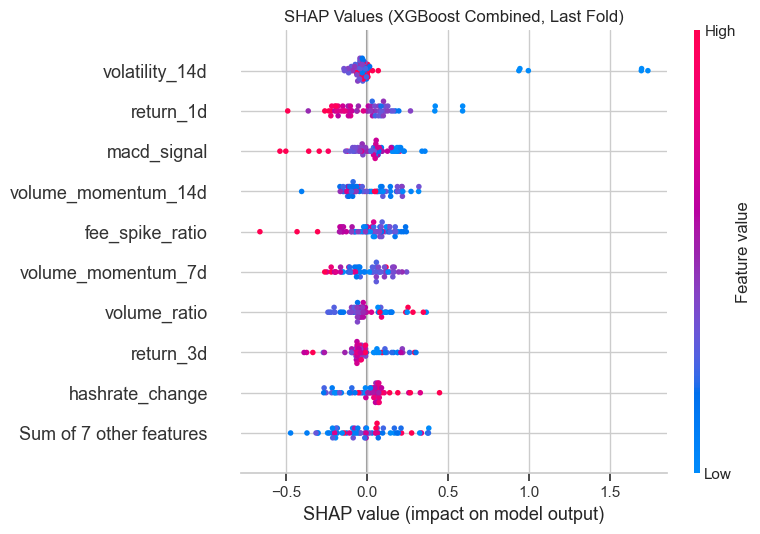
SHAP analysis of the XGBoost combined model shows that price-based features, led by 14-day volatility and the previous day's return, had the largest influence on predictions. On-chain features such as 14-day volume momentum and fee spikes came next. The models did use the whale features, but using them didn't translate into profitable predictions.
What this does and doesn't show
A negative result here doesn't prove whale data is useless. It shows that this design, at a next-day horizon and after realistic costs, didn't produce an edge that survived a fair test. The test window was also short and mostly bearish (106 of 197 days), so it can't settle the question on its own.
The process carries a lesson too. Earlier iterations of the project looked promising. As look-ahead risks were removed, costs were applied consistently and model selection was separated from evaluation, the apparent edge faded. Letting each fold tune its own hyperparameters didn't help either: it pushed the median out-of-sample Sharpe from +0.66 down to about zero. That is exactly what these safeguards are for.
Challenges and limitations
• One short test window. The confirmation covers 197 days, mostly bearish. The development walk-forward distribution is the stronger body of evidence, and results in a different regime could differ.
• Network-level on-chain data. The free Blockchain.com metrics measure activity across the whole Bitcoin network. They don't identify specific whale wallets or exchange inflows and outflows. Wallet-labelled flow data from paid providers might tell a different story.
• Next-day horizon. Whale information that plays out over several days may not show up in a next-day target. Longer holding periods were less negative in development, but none showed a clear positive edge.
• Scope. One asset (BTC/USDT), one venue (Binance spot), one snapshot of CoinGlass data, and the period from November 2020 to May 2026 only.
• Execution assumptions. The 0.15% per-side cost is still a simplification. It ignores changing spreads, market depth at larger size and adverse selection.
• Residual selection risk. A small pre-committed grid and a deflated Sharpe ratio reduce selection bias but don't remove it entirely.
Conclusion
This project asked a question many crypto traders argue about: do whale movements tell you something the price chart doesn't? Hui Min's answer, under a pre-registered and cost-aware test, is that her strategy found no edge that held up out of sample.
The value of the project lies as much in the method as in the verdict. A price-only baseline, a feature ablation, a fixed selection rule, block bootstrap intervals and a deflated Sharpe ratio together make it hard to fool yourself. The same framework can test any alternative data source, such as sentiment, funding rates or search trends, before real capital is involved.
Frequently asked questions
What is whale activity in crypto? Whale activity refers to the actions of holders who control large amounts of a cryptocurrency, such as big transfers or large futures positions. This project measured it in two ways: network-level on-chain metrics like transaction volume spikes and fee spikes, and derivatives data including CoinGlass's whale index.
Can on-chain whale data predict Bitcoin price? In this project, it didn't produce an edge that held up. All 15 model and feature-set combinations had a negative net Sharpe ratio on development data, and the locked strategy had a test Sharpe ratio of -1.37 after costs. That doesn't rule out value at other horizons or in other designs, but it does mean whale alerts shouldn't be treated as a reliable signal on their own.
What is pre-registration in trading research? It means writing down the hypothesis, the configurations to test, the selection rule and the success criterion before running the final test. It stops you from changing the rules after seeing the results.
What is a deflated Sharpe ratio? A Sharpe ratio adjusted for the number of strategies tried. If you test 30 configurations and report the best, its raw Sharpe ratio overstates how good it really is. The deflated version corrects for that.
Why is a negative result worth publishing? It saves other traders from repeating the same test, and it shows what a fair test looks like. Many strategies look profitable only because they were tuned on the same data used to evaluate them.
Why does the strategy's small drawdown not prove it works? The locked strategy held a position on only 3% of test days. It lost less than buy-and-hold mainly because it was out of the market while Bitcoin fell. That is low exposure, not predictive skill.
About the author

Hui Min Neo is a technology leader with extensive experience in software engineering, engineering leadership, and digital transformation. Her interests span artificial intelligence, machine learning, and quantitative finance. She is passionate about exploring data-driven trading strategies and applying research and backtesting to systematic trading.
LinkedIn: linkedin.com/in/hui-min-neo
EPAT batch: 69 Project mentor: José Carlos Project completed: July 2026 EPAT final exam: Cleared in the August 2026 exam window
Want to know how EPAT equips you with skills to build your trading strategy in Python? Check out the EPAT course curriculum to find out more.
Next steps
If you'd like to explore related EPAT projects on machine learning and crypto, these are good places to start:
• Using Machine Learning to Generate Intraday Buy and Sell Signals for Cryptocurrency | EPAT Project
• Crypto Perpetual Contract Pair Trading
• Dynamic Capital Allocation using Market Breadth & Random Forest
• ARIMA Vs LSTM: A Comparative Study of Stock Price Prediction Models | EPAT Project
To build skills in this area at your own pace, Quantra's Crypto Trading Strategies: Advanced and Data & Feature Engineering for Trading courses cover related ground.
Disclaimer: The information in this project is true and complete to the best of our Student's knowledge. All recommendations are made without guarantee on the part of the student or QuantInsti®. The student and QuantInsti® disclaim any liability in connection with the use of this information. All content provided in this project is for informational purposes only and we do not guarantee that by using the guidance you will derive a certain profit.
Cryptocurrency trading carries a high level of risk, and past or backtested performance doesn't indicate future results.