
Fibonacci trading tools are used to determine support/resistance levels or to identify price targets. It is the presence of the Fibonacci series in nature which attracted technical analysts’ attention to use Fibonacci for trading. Fibonacci numbers may work like magic in some cases, in finding key levels in any widely traded security. Fibonacci's retracement strategy relies on key retracement levels to predict future price movements.
In this guide, we delve into Fibonacci retracement levels and their implementation using Python, enabling traders to leverage these mathematical principles for informed decision-making.
By combining technical analysis with programming capabilities, traders gain a deeper understanding of market dynamics and enhance their ability to execute trades with maximum returns. So let us dive in and unlock the potential of the Fibonacci Retracement Trading Strategy in Python for navigating volatile financial markets.
Moving ahead, let us find out more with this blog that covers:
- What is the Fibonacci sequence?
- What is the Fibonacci retracement strategy?
- How to use Fibonacci retracement in trading?
- Calculating Fibonacci retracement levels using Python
- Best practices for optimising Fibonacci trading strategy in Python
- Overcoming challenges faced while using Fibonacci trading strategy
What is the Fibonacci sequence?
The Fibonacci retracement strategy involves the use of the Fibonacci sequence. So, let us first of all learn about the Fibonacci sequence.
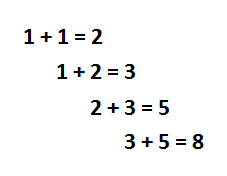
The Fibonacci sequence is a series of numbers where each number is the sum of the two preceding ones. The sequence usually is: 0, 1, 1, 2, 3, 5, 8, 13, 21, 34, and so on.
The sum is in the following order:
In mathematical terms, the Fibonacci sequence can be defined recursively by the formula:
X(n) = X(n-1) + X(n-2)
Where:
- X(n) is the nth number in the sequence
- X(n-1) is the (n-1)th number in the sequence
- X(n-2) is the (n-2)th number in the sequence
In finance and trading, the Fibonacci sequence is widely used in technical analysis to identify potential support and resistance levels and is an essential part of the Fibonacci retracement strategy.
Moreover, there are some interesting properties of the Fibonacci sequence.
- Divide any number in the sequence by the previous number; the ratio is always approximately 1.618.
Xn/Xn-1 = 1.618
55/34 = 1.618
89/55 = 1.618
144/89 = 1.618
1.618 is known as the golden ratio. I suggest searching for the golden ratio examples on the Google images and you will be pleasantly astonished by the relevance of the ratio in nature.
2. Similarly, divide any number in the sequence by the next number; the ratio is always approximately 0.618.
Xn/Xn+1 = 0.618
34/55 = 0.618
55/89 = 0.618
89/144 = 0.618
3. 0.618 expressed in percentage is 61.8%. The square root of 0.618 is 0.786 (78.6%).
Similar consistency is found when any number in the sequence is divided by a number two places right to it.
Xn/Xn+2 = 0.382
13/34 = 0.382
21/55 = 0.382
34/89 = 0.382
0.382 expressed in percentage is 38.2%
4. Also, there is consistency when any number in the sequence is divided by a number three places right to it.
Xn/Xn+3 = 0.236
21/89 = 0.236
34/144 = 0.236
55/233 = 0.236
0.236 expressed in percentage terms is 23.6%.
5. The ratios 23.6%, 38.2%, 61.8%, and 78.6% are known as the Fibonacci ratios.
Now we can move to learning about Fibonacci retracement strategy.
What is the Fibonacci retracement strategy?
The Fibonacci retracement strategy is a popular technical analysis tool to identify potential reversal levels in financial markets and is used by traders. Based on the Fibonacci sequence, this strategy involves plotting key retracement levels. The typical or default levels are 23.6%, 38.2%, 50%, 61.8%, and 78.6%, against a price movement.
These levels are derived from ratios found in the Fibonacci sequence, believed to represent areas of support or resistance.
Fibonacci retracement levels help traders to identify the entry and exit points for trades. Hence, the determination of the stop-loss and take-profit levels is done. When the price of an asset retraces to one of these Fibonacci levels, it may indicate a potential reversal in the prevailing trend.
The Fibonacci ratios, 23.6%, 38.2%, and 61.8%, can be applied for time series analysis to find support levels. Whenever the price moves substantially upwards or downwards, it tends to retrace back before it continues moving in the original direction.
For example, if the stock price has moved from $200 to $250, it is likely to retrace to $230 before it continues to move upward. The retracement level of $230 is forecasted using the Fibonacci ratios.

We can arrive at $230 by using simple maths.
- Total up move = $250 - $200 = $50 38.2% of up move = 38.2% * 50 = $19.1
- Retracement forecast = $250 - $19.1 = $230.9
Any price below $230 provides a good opportunity for the traders to enter into new positions in the direction of the trend. Likewise, we can calculate for 23.6%, 61.8% and the other Fibonacci ratios.
The Fibonacci retracement strategy is commonly applied alongside other technical indicators and analysis techniques to confirm signals and enhance trading decisions. Additionally, it can be used across various financial instruments and timeframes, making it a versatile tool for traders across different markets.
Let us now find out how to use Fibonacci retracement in trading.
How to use Fibonacci retracement in trading?
The retracement levels can be used to buy a particular stock but you have not been able to because of a sharp run-up in the stock price.
In such a situation, it is recommended to wait for the price to correct to Fibonacci retracement levels such as 23.6%, 38.2%, and 61.8% and then buy the stock. The ratios 38.2% and 61.8% are the most important support levels.
This Fibonacci retracement trading strategy is more effective over a longer time interval and like any indicator, using the strategy with other technical indicators such as RSI, MACD, and candlestick patterns can improve the probability of success.
Now, we will head to calculating Fibonacci retracement levels using Python.
Calculating Fibonacci retracement levels using Python
As we now know, retracements are the price movements that go against the original trend. To forecast the Fibonacci retracement level we should first identify the total up move or total down move. To mark the move, we need to pick the most recent high and low on the chart.
Let’s take an example of Exxon Mobil to understand the Fibonacci retracement construction.
Output:

Output:
Minimum Price: 31.56999969482422
Maximum Price: 121.37000274658203
Output:
Level	Price
0	 121.37000274658203
0.236	 100.17720202636718
0.382	 87.06640158081055
0.618	 65.8736008605957
1	 31.56999969482422

It is visible that the maximum price is 121.37 where the level is 0 since there is no retracement at the maximum price.
The first retracement level is at 23.6% is $100.17, the second retracement level is at 38.2% is $87.06, and the next retracement level is at 61.8% is $65.87.
Best practices for optimising Fibonacci trading strategy in Python
When you implement Python for the Fibonacci trading strategy, there are chances that optimisation will be required to improve the strategy performance.

Consider the following tips and best practices for the same:
- Define clear trading rules: Establish clear rules for identifying Fibonacci retracement levels and trade setups. This helps to remove subjectivity and emotion from the decision-making process.
- Backtest the strategy: Use historical market data to backtest the Fibonacci strategy across various market conditions. This helps validate the effectiveness of the strategy and identify its strengths and weaknesses.
- Optimise parameters: Fine-tune the parameters of the Fibonacci strategy, such as the anchor points for drawing retracement levels or the threshold for confirming trade signals. Optimisation can be done using techniques like grid search.
- Incorporate risk management: Implement robust risk management techniques to protect capital and minimise losses. This may include setting stop-loss orders, position sizing based on risk tolerance, and diversifying across multiple assets or instruments.
- Combine with other indicators: Enhance the Fibonacci strategy by integrating it with other technical indicators or chart patterns. This can help confirm trade signals and increase the probability of successful trades.
- Continuously monitor and adapt: Regularly monitor the performance of the Fibonacci strategy and make adjustments as needed based on evolving market conditions. This may involve refining the strategy parameters, adding new filters, or incorporating feedback from live trading experiences.
By following these tips and best practices, traders can optimise their Fibonacci trading strategy in Python and improve their overall trading performance.
Moving to the next section, we will find out how to overcome the challenges faced while using the Fibonacci trading strategy.
Overcoming challenges faced while using Fibonacci trading strategy
|
Challenges with the Fibonacci Trading Strategy |
Ways to Overcome the Challenges |
|
Subjectivity: Identifying the correct swing highs and lows to anchor Fibonacci retracement levels can be subjective and may vary among traders. |
Use Objective Criteria: Define clear criteria for identifying swing highs and lows, such as significant price peaks and troughs, or use automated tools to detect these points. Additionally, consider using multiple timeframes to confirm key levels. |
|
Overfitting: There is a risk of overfitting the Fibonacci levels to historical data, leading to poor performance in real-time trading. |
Validate with Backtesting: Test the Fibonacci strategy on historical data across different market conditions to ensure robustness. Avoid over-optimising the strategy based on specific past events. Incorporate risk management rules to limit potential losses. |
|
False Signals: Fibonacci retracement levels may sometimes generate false signals, resulting in poor trade execution and losses. |
Combine with Other Indicators: Use Fibonacci levels in conjunction with other technical indicators, such as moving averages, trendlines, or candlestick patterns, to confirm trade setups. This can help filter out false signals and improve the reliability of the strategy. |
|
Emotional Bias: Traders may become emotionally attached to Fibonacci levels, leading to biased decision-making and reluctance to adapt to changing market conditions. |
Stay Disciplined: Stick to predefined trading rules and objectives, regardless of emotional impulses or attachment to Fibonacci levels. Regularly review and adjust the strategy based on objective performance metrics and market feedback. |
|
Market Noise: In choppy or volatile market conditions, Fibonacci levels may not accurately capture price movements, resulting in increased noise and false signals. |
Adjust Parameters: Consider adjusting the sensitivity of Fibonacci levels by modifying the anchor points or using alternative Fibonacci tools, such as Fibonacci extensions or clusters, to better align with prevailing market dynamics. Additionally, apply filters to smooth out noise and focus on high-probability trade setups. |
Conclusion
The Fibonacci retracement trading strategy in Python offers traders a systematic approach to navigating volatile financial markets and enables them to unlock the potential for maximum returns.
Mastering the Fibonacci retracement trading strategy in Python equips traders with a powerful tool for identifying potential price reversal levels and making informed trading decisions. By leveraging the Fibonacci sequence and ratios, traders can pinpoint key support and resistance levels, allowing for precise entry and exit points in the market. Through the implementation of Python programming, traders gain the ability to calculate and visualise Fibonacci retracement levels accurately, enhancing their technical analysis capabilities.
If you wish to learn more about the Fibonacci retracement strategy, check out the course on price action trading strategies. This course will help you learn the strategies and codes that help you to tweak, fine-tune and implement this strategy in the live markets. Learn how to spot and trade the most important trading patterns: double tops/double bottoms, triple tops/triple bottoms, head and shoulders. Get acquainted with several trading strategies, and price action tools such as pivot points and the Fibonacci Retracement levels via a practical approach. Enroll now!
File in the download
- Fibonacci retracement strategy - Python notebook
Author: Chainika Thakar (Originally written by Ishan Shah)
Note: The original post has been revamped on 29th April 2024 for recentness, and accuracy.
Disclaimer: All investments and trading in the stock market involve risk. Any decision to place trades in the financial markets, including trading in stock or options or other financial instruments is a personal decision that should only be made after thorough research, including a personal risk and financial assessment and the engagement of professional assistance to the extent you believe necessary. The trading strategies or related information mentioned in this article is for informational purposes only.

