By Vibhu Singh
In this blog post, we will understand what hypothesis formation is and how to perform hypothesis testing in trading.
There is a need for a disciplined approach to building a quantitative trading strategy. Any quantitative trading system consists of four major components:
- Hypothesis formation - Finding a strategy
- Backtesting and optimizing the hypothesis - Obtaining data, coding the strategy, analyzing the performance
- Automating the strategy - Linking to brokerage
- Risk management - Optimal capital allocation, bid-ask size etc.
Hypothesis formation is about what you think the market is. If you think the market is trending bullish, you may buy the asset or if you believe the market is trending bearish, you may short the asset. But to validate the hypothesis, you need to perform the hypothesis testing.
Hypothesis Testing
Hypothesis testing is a systematic way to test a hypothesis or idea about the population. In hypothesis testing, we measure the behaviour in samples to learn more about the population, as samples are somewhat related to populations. For example, if the return of all the stocks in Nifty 50 index is 3% and if we randomly select 10 stocks from the index, then on average the value of the sample mean will be equal to the population mean.
Suppose you are an analyst and you believe that the average return on all the stocks in Nifty 50 index was greater than 3%. You assume that the returns are normally distributed.
Hypothesis Testing Method
The method of hypothesis testing can be summarized in four steps:
 Step 1: State the hypothesis
Stating the hypothesis is the initial step in a defined process for hypothesis testing. It involves stating the null and alternative hypothesis.
Null Hypothesis:
In hypothesis testing, the null hypothesis is usually the hypothesis that we want to reject. It is usually denoted by Ho and always includes some form of equal sign.
Here in our example, the null hypothesis is:
Ho: μ < = 3
μ is the population mean.
Alternative Hypothesis:
The alternative hypothesis is a statement that will be accepted when the null hypothesis is rejected. It is usually denoted by Ha.
Here in our example, the alternative hypothesis is:
Ha: μ >3
Step 2: Set the decision criterion
The decision has to be based on certain parameters of datasets and this is where the concept of normal distribution, significance level, one-tailed, two-tailed tests come into the picture.
Normal Distribution
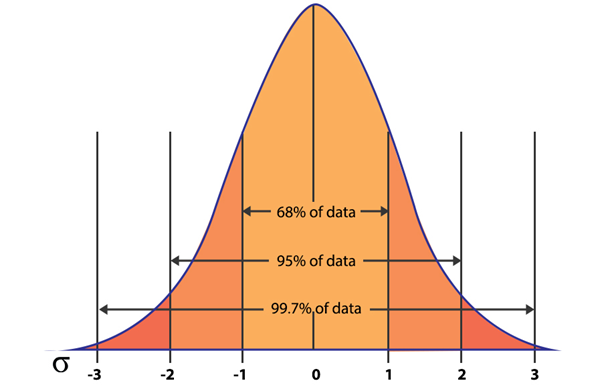
A normal distribution is a probability distribution in which most of the values lie around mean and others lie symmetrically above or below the mean.
For a normal distribution, 68% of the values fall within one standard deviation of the mean. 95% of the values fall within two standard deviations of the mean and 99.7% of the values lie within three standard deviations of the mean.
Significance level
Significance level or level of significance is used to set the criterion upon which a decision is made regarding the null hypothesis. It is defined as the probability that a test statistic will reject the null hypothesis by chance when it is actually true. It is denoted by alpha or α. If we choose a significance level of 0.05, it means there is a 5% chance that we are rejecting the null hypothesis when it is true. A significance level of 0.01 means that there is a 1% chance of rejecting the null hypothesis when it is true.
As a rule, the significance level is specified prior to calculating the test statistic, as a result of the test statistic may impact the choice of significance level.
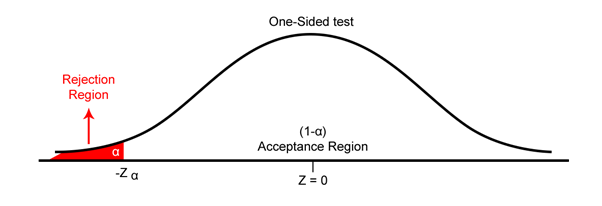
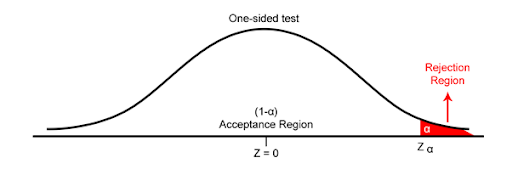
One-Tailed test
The one-tailed test implies to the hypothesis test, where the region of rejection appears on one side of the sampling distribution. If the population parameter is “less than” or “greater than”, then we use the one-tailed test. For example, if the return on all stocks of Nifty 50 is greater than 3%, then the hypothesis test carried out is the one-tailed test.
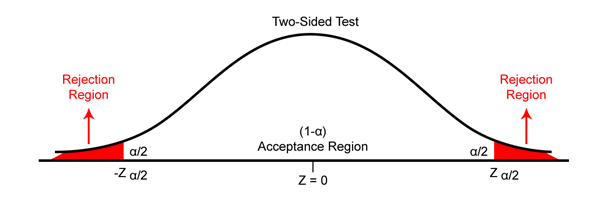
Two-Tailed Test
Two-tailed test signifies to the hypothesis test, where the region of rejection is on both sides of the sampling distributions. If the population parameter is characterized by the words “equal to” or “not equal to”, then we use the two-tailed test. For example, if the return on all stocks of Nifty 50 is equal to 3%, then it is a two-tailed test and we can reject the null hypothesis based on observations in either tail.
The alternative hypothesis determines whether to place the level of significance in one or both tails of the sampling distribution. If μ is the actual value of a population parameter (e.g. mean or standard deviation), and μ0 is the value of the population parameter according to our hypothesis, then:
| Alternative Hypothesis | Type of test |
| H1: μ ≠ μ0 | Two-Tailed test |
| H1: μ > μ0 | One-Tailed (Right) |
| H1: μ < μ0 | One-Tailed (Left) |
Step 3: Calculate the test statistics
In hypothesis testing, a test statistic is defined as a quantity taken from a sample that is used for deciding whether to reject or accept the null hypothesis.
The general formula for calculating a test statistic is
Test statistic = [Sample statistic - Value of parameter according to null] / Standard error (SE) of the sample statistic
Standard Error = Standard deviation / √ (number of samples)
Step 4: Make a Decision
The decision about hypothesis testing is made by comparing two values.
- Test statistics
- Critical value: Critical value is a point on the test distribution that is compared to the test statistics to determine whether to reject the null hypothesis. It is the function of significance level (α), probability distribution and whether the test is one-tailed or two-tailed.
The critical value for one and two-tailed tests ( Normal Distribution) at three commonly used levels of significance.
| Level of Significance (α) | One-Tailed Test | Two-Tailed Test |
| 0.05 (5%) | +1.625 or -1.625 | 1.96 |
| 0.01 (1%) | +2.33 or -2.33 | 2.58 |
| 0.001 (0.1%) | +3.09 or -3.09 | 3.30 |
For the two-tailed test, the level of significance (α) is split in half and placed in each tail of normal distribution as shown in the above two-tailed diagram.
If the value of the test statistic is less than or equal to the critical value, we reject the null hypothesis, and state that the result is statistically significant. If the test statistic is greater than the critical value, then we fail to reject the null hypothesis and we state that the result is not statistically significant.

where,
Zα = critical value at a significance level
Types of Error
There are two types of error in hypothesis testing: Type I and Type II.
Type I Error:
Type I error is defined as rejecting the null hypothesis when it is true. The probability of making a type I error is α. An α of 0.05 indicates that you are willing to accept a 5% chance that you are wrong when you reject the null hypothesis. Type I error can be reduced by choosing the lower value of α.
Type II Error:
When the null hypothesis is false and we fail to reject it, we make a type II error. The probability of making a type II error is β. We can decrease the risk of committing a type II error by increasing the sample size.
Conclusion
To create a profitable trading strategy, you need to have a hypothesis and to validate a hypothesis you need to perform a hypothesis test. The steps involved in hypothesis testing are:
- State the hypothesis
- Set the decision criterion
- Calculate the test statistics
- Make a decision
Hypothesis testing is usually the first step before we start formulating a trading strategy. You can go through the different strategies by checking out the algorithmic trading strategies bundle.
Suggested read:
All You Need To Know About Algorithmic Trading
Disclaimer: All investments and trading in the stock market involve risk. Any decisions to place trades in the financial markets, including trading in stock or options or other financial instruments is a personal decision that should only be made after thorough research, including a personal risk and financial assessment and the engagement of professional assistance to the extent you believe necessary. The trading strategies or related information mentioned in this article is for informational purposes only.