The size of the capital invested in a portfolio, strategy or trade as a percentage of your overall capital is termed as the size of that position. Position Sizing, therefore, is the methodology used to determine that size. In this blog, we will be focusing on the position size of a particular trade, but the same logic can be applied to a strategy or a portfolio of assets.
We will be covering the following topics:
- Why is Position Sizing Important for You and Your Strategy?
- Trading Biases and Position Sizing
- Terms used in Position Sizing
- Common Techniques of Position Sizing
- Not-so-common Techniques of Position Sizing
Why is Position Sizing Important for You and Your Strategy?
Once you have a strategy with a positive expectancy, the right position sizing is the difference between actually making money or going bust.
You don’t want to lose everything in the first few trades, do you?
As Larry Hite, one of the forebearers of system trading puts it:
“I have two basic rules about winning in trading as well as in life:
If you don’t bet, you can’t win.
If you lose all your chips, you can’t bet”
You need to preserve your chips to trade. That is the cardinal rule to stay in the game for the long run.
Having a well-defined position sizing technique will remove any discretion a trade can be subject to giving consistent results each time.
Traders fall prey to a plethora of market biases. Let us discuss a couple of them and see how position sizing can help protect us against these fallacies.
Trading Biases and Position Sizing
The Illusion of Control

Complexity is the way to go. The more complex a technique is, the better it is.
This is an illusion and it breeds a false sense of control while trading. Just because you are utilising a fusion of various techniques does not imply success in that trade.
To have control over the trade, it does not matter what system you used to decide the size of that trade. All that counts is whether the system that you are using is the right one for your strategy or not. This can only be verified by a backtest.
Recency Bias

Have you increased your trade size when you have been lucky enough to experience a streak of profits?
If you have done that, you might as well have experienced a big loss right after. This is what is termed as recency bias.
You turned a blind eye to your backtest (or your past) and went head-on with the recent results. The outcome was you lost all of those recent profits and maybe more in one bad trade. Position Sizing helps prevent this by optimizing the trade size for each next trade based on the set of well-defined rules already formulated by you.
Gambler’s Fallacy

You have experienced a series of losses. The next trade is bound to be a profitable one. So you use all your money in the next trade. Lo and behold, you ended up losing everything. But you were so sure of the profits, why did this happen to you!
That is exactly how a gambler thinks. Position Sizing simply eliminates this by optimizing the trade size based on the systems in place.
Terms used in Position Sizing
Before we delve into the various techniques of Position Sizing let us go through a few basic terms:
Account Risk
Account risk refers to the amount of the total account value you are willing to lose as a whole. Usually, a percentage of 2% is considered optimum for a retail trader. However, you can adjust this percentage as per your risk profile. As an illustration, for an account size of $10,000 and a risk percentage of 2%, you can only afford to lose $2,000.
Trade Risk
Trade risk is what you are comfortable losing per trade with respect to your strategy. It is the absolute amount of difference between your estimated entry price and the stop loss you will put for the trade. For example, if your entry price is $100 and you initiate a stop loss at $98, your trade risk will be $2.
Proper Position Size
Once you have an account risk of $2,000 and a trade risk of $2, you can calculate position size for your trade as account risk divided by the trade risk. This comes out as 1000 units ($2,000 / $2).
Now let us look at some of the common and not-so-common techniques of sizing your next trade.
Common Techniques of Position Sizing
Let us first see some of the commonly used techniques with the help of examples. They present a naive approach to position sizing.
Fixed Units
In the fixed units technique, the number of lots/shares for each trade you take will remain constant. For example, if you have an initial capital of $10,000, and you decide to trade 100 units of the asset for each and every trade irrespective of the change in the total amount of capital, you are implementing the fixed units technique.
Fixed Sum
The fixed sum technique is just like fixed units, but instead of the number of shares, you decide on the amount of capital for each trade that will be fixed. For example, if instead of a constant 100 units, you decide to use a constant dollar value, say, $8,000, you are implementing the fixed sum technique.
Fixed Percentage
When you deploy a percentage of your total capital into a trade, you are using the fixed percentage method of position sizing. So, when your account value is $10,000 and you use 60% of your account value to trade, you will use $6,000. When the account value changes to $8,000 or $12,000, you will use $4,800 and $7,200 respectively for the trade.
The benefit of this over the previous two methods is that you account for the changes in the account value, and consequently the profits and the losses incurred in the previous trades.
Fixed Fraction
Fixed fraction allows managing for the risk in trade size. You adjust the account size calculated in the fixed percentage technique, for the risk of loss, by dividing the account size calculated with the risk you expect to take per trade.
Not-so-common Techniques of Position Sizing
The following techniques represent a more structured way of tackling position sizing in trading. They were developed after research or by skilled market participants. Let us discuss them.
Kelly Criterion
A researcher at Bell Labs, J.L. Kelly Jr., came up with a method to take care of long-distance telephonic signal noise. The gambling community started using it to optimize the bet size in gambling. It came to be known as the Kelly criterion, whose formula is as follows:
$$\text{K%} = W - \frac{1-W}{R}$$where,
- K% = The Kelly Percentage
- W = Winning Probability
- R = Win/loss Ratio
The winning probability is the ratio of the number of profitable trades to the total number of trades taken. The win/loss ratio is the ratio of the average gain on the trades that ended up in a profit to the average loss on the trades that gave a loss.
For example, consider the following set of trades:
|
S.No. |
Win/Loss |
Profit or Loss ($) |
|
1 |
Win |
500 |
|
2 |
Win |
200 |
|
3 |
Loss |
-150 |
|
4 |
Loss |
-200 |
|
5 |
Win |
250 |
|
6 |
Loss |
-100 |
|
7 |
Win |
100 |
|
8 |
Loss |
-200 |
|
9 |
Win |
600 |
|
10 |
Win |
50 |
- Winning Probability = Count of Wins / Count of Total Trades = 6/10 = 0.6
- Average gain = Average of ($500, $200, $250, $100, $600, $50) = $283.33
- Average loss = Average of ($150, $200, $100, $200) = $162.50
- Win/Loss Ration = $283.33/$162.50 = 1.74
Plugging the values in the formula, we get:
Kelly Criterion = 0.37 = 37%
Therefore, you will expose only 37% of your capital in the next trade.
A disadvantage of the Kelly criterion is that it reduces the trade outcomes into just two values - positive outcomes and negative outcomes. This also means when applying it, you are not accounting for the volatility of the asset. This is where optimal f comes in.
Optimal F
Ralph Vince, a famous technical analyst, came up with a new money management technique called optimal f. Optimal f involves testing various position sizes on ‘n’ past returns from a strategy and choosing the bet size that gives the maximum amount of profit for those sets of returns. You can learn more about this in the position sizing course on quantra.
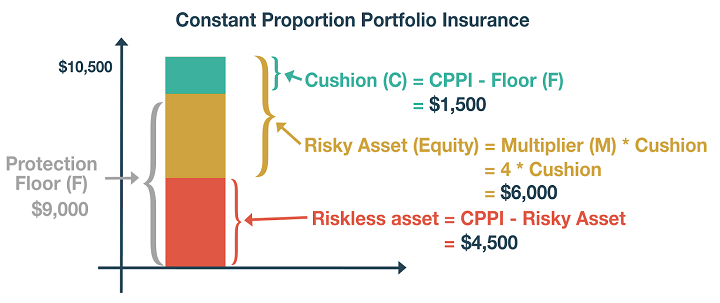
Constant Proportion Portfolio Insurance (CPPI)
As the name suggests, CPPI technique consists of a portfolio. It involves a combination of a risky asset and a risk-free asset. CPPI will help you maintain sufficient exposure to the risky asset while guaranteeing against the downside risk.
Let us look at an example:
You have $10,000. You want to keep $9,000 as the minimum value your portfolio will ever get to.
- This $9,000 is your floor value (or you can say, your floor percentage is 90% of the initial capital).
- The $1,000 that you are willing to risk is your cushion value (or you can say, your cushion percentage is 10% of the initial capital).
We will take a multiplier value of 4 (We are assuming that in the recent past, the underlying asset has fallen maximum by 25%). You will allocate $4,000 ($1,000 x 4) to the risky asset and the balance to the safe asset.
So far we have defined the following variables:
Initial Conditions:

Case 1:
Let us take the case that the $4,000 invested in the risky asset grows to $4,500. In this scenario, our portfolio will change as below:
New Total Capital = $10,500
In the above graphic, you see how as our portfolio grew, we dynamically allocated more to the risky asset while reducing allocation to the safe asset.
Case 2:
Let us take the case that the $4,000 invested in the risky asset falls to $3,500. In this scenario, our portfolio will change as below:
New Total Capital = $9,500

In the above graphic, you see how as our portfolio fell, we dynamically allocated less to the risky asset while increasing allocation to the safe asset.
Similarly, when we lose $1,000 on our risky asset, we will divert all our amount to the safe asset.
A simple buy and hold strategy with daily rebalancing when exposed to the CPPI technique of position sizing with the same parameters as above performed as follows on Apple:

Time Invariant Protection Portfolio (TIPP)
In CPPI, we kept the floor value constant at $9,000. In TIPP, we update the floor value as a percentage of the portfolio high. It acts as a trailing stop loss. In the above example, we kept the floor percentage of 90%. For Case 1, when the portfolio value reaches $10,500, we will update our floor value to $9,450.
A simple buy and hold strategy with daily rebalancing when exposed to the TIPP technique of position sizing with the same parameters as used in CPPI performed as follows on Apple:

We can see that our strategy returns fell. As a comparison, the drawdown reduced from about 8% to just 4.2%.
The following video that explains - “Portfolio Assets Allocation: A practical and scalable framework for Machine Learning Development” by Raimondo Marino from Milan, Italy and “Portfolio Optimization for Dividend Stocks” by Kurt Selleslagh from Singapore.
Bibliography
Conclusion
We discussed multiple techniques both naive and unconventional approaches to position sizing. We saw how CPPI could help us outperform the benchmark and how TIPP could help us reduce our drawdowns significantly. The next step would be to adjust our returns for the volatility of the underlying and to create simulations to identify the worst situations we can encounter with our returns.
We also saw that each technique has scope for improvement and can be modified based on the needs of the trader.
An important point to note is that position sizing can only help improve returns or reduce drawdowns for a strategy that has a positive expectancy. It cannot make an unprofitable strategy a profitable one.
With this blog, we have only scratched the surface for position sizing. If you wish to learn how to improve further on these techniques and implement them in the live market consider enrolling in our course on Position Sizing in Trading.
Disclaimer: All data and information provided in this article are for informational purposes only. QuantInsti® makes no representations as to accuracy, completeness, currentness, suitability, or validity of any information in this article and will not be liable for any errors, omissions, or delays in this information or any losses, injuries, or damages arising from its display or use. All information is provided on an as-is basis.