This blog talks about how one can use technical indicators for predicting market movements and stock trends by using random forests, machine learning and technical analysis.
This article is the final project submitted by the author as a part of his coursework in Executive Programme in Algorithmic Trading (EPAT®) at QuantInsti®. Do check our EPAT Project works section and have a look at what our students are building.
About the Author

Desigan currently works on the dealing desk at Futuregrowth Asset Mangement as a Fixed Income Dealer in Cape Town, South Africa. Prior to joining FG in 2016, he had worked for several investment companies primarily in the market risk division spanning 12 years in the financial services industry (8 years in Risk and 4 years in investments and trading).
After graduating in 2005 with a BSc degree in Actuarial Science and Statistics, he completed his B.Sc. honours degree in Financial Mathematics (2006) and more recently his Masters (M.Com.) degree specializing in Finance and Risk Management in 2018. He is also a CFA charterholder and holds both the Financial Risk Management (FRM) and ACI Dealing certifications.
He enjoys coding and looking at ways to improve the investment process as well as coming up with trading ideas. On a more personal note, he is an ardent football and rugby follower and a huge Manchester United and Sharks supporter. He enjoys the outdoors and keeping active as well as going out to the movies.
Abstract
This article looks at applying six common technical analysis indicators along with a machine learning algorithm to the top ten constituent stocks in the South African Top40 Index. The ten stocks analyzed were considered as our investment universe and were consequently used to construct an equally weighted index which served as our benchmark.
Aim
Our aim in this research note is to investigate whether using a machine learning model, identifying long-only trading opportunities, is able to produce a superior return than the constructed benchmark. In addition, we also compare the returns produced from our model to that of the more conventional technical indicators, namely: Bollinger Bands, RSI Indicator and MACD.
Project Summary
Using ten years’ worth of daily stock price data along with the resulting technical indicators, we utilized the first 7.5 years as training data in our Random Forest Classifier. This was done for each of the ten stocks considered and after fine-tuning the model hyper-parameters, the machine learning algorithm was applied to the last 2.5 years of test data to identify long-only investment opportunities.
Following the trade signals generated by the Random Forest Classifier, we looked at two long-only trading strategies. The one strategy looked at a daily rebalancing of our portfolio and the other weekly.
Our findings show that over the last 2.5 years (test data), both long-only trading strategies outperformed the constructed index (benchmark) as well as the traditional technical indicators.
Setup
There has been limited research done on the application of machine learning models in the South African market. Accordingly, this note aims to explore the improvement in using these models to determine stock trading signals. It is theorized that as an alternative to using common technical analysis indicators such as Bollinger Bands, RSI and MACD, one can enrich the trading decision process by incorporating these indicators into a machine learning algorithm (rather than using these indicators alone).
To test this hypothesis, we first construct an equally weighted index comprising of the top 10 stocks in the South African Top40 benchmark, i.e. each stock has a 10% weighting. The chosen stocks were considered as our investment universe with the constructed index serving as our benchmark.
After integrating six technical analysis indicators into our Random Forest Classifier model, we establish long only trade signals for each stock in our investment portfolio. It is postulated that by following an investment strategy using the signals generated by our model, one can outperform the constructed benchmark. In addition, it is also envisaged that the enriched machine learning model can also outperform the returns produced by the individual indicators as well.
The identified stocks along with their weights in the SA Top40 Index is shown in the table below.

*Source: FTSE Russel Factsheet as of January 2019
Dataset
Ten years (02/01/2009 – 31/12/2018) of daily data for each of the ten constituent stocks in our investment portfolio were obtained from www.investing.com. The attributes retrieved were as follows:
- Price
- Open
- High
- Low
- Volume
Technical Indicators
These features were then used as inputs in six technical analysis indicators, which were in turn used to identify long-only trading opportunities for each of the considered stocks in our investment portfolio (universe). The technical indicators chosen were broken down as follows:
Trend Following
- Moving Average Convergence Divergence (MACD) - The Moving Average Convergence Divergence (MACD) is the difference between two Exponential Moving Averages. The Signal line is an Exponential Moving Average of the MACD. When the MACD line crosses above the signal line a buy signal is generated. When the MACD crosses below the signal line a sell signal is generated.
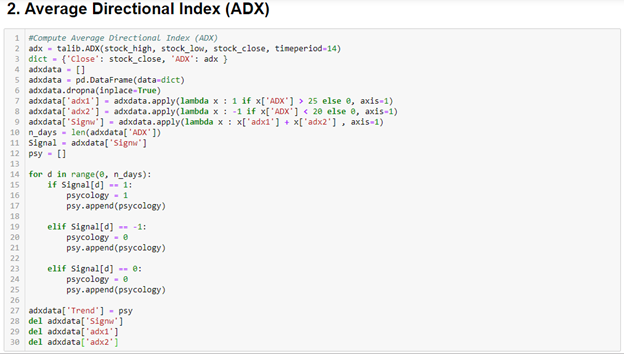
- Average Directional Index (ADX) - The ADX is a Welles Wilder style moving an average of the Directional Movement Index (DX). The values range from 0 to 100 but rarely get above 60. To interpret the ADX, consider a high number to be a strong trend, and a low number, a weak trend.
Oscillators
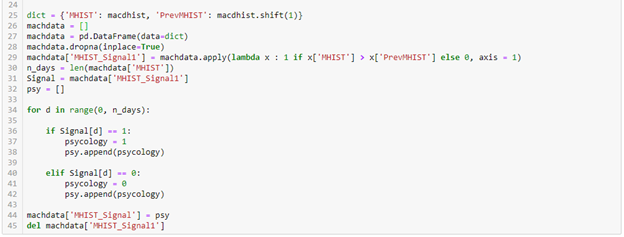
- MACD Histogram (MACDH) - The MACD-Histogram measures the distance between MACD and its signal line. Like MACD, the MACD-Histogram is also an oscillator that fluctuates above and below the zero lines. To confirm the signal, the MACD should be above zero for a buy, and below zero for a sell.
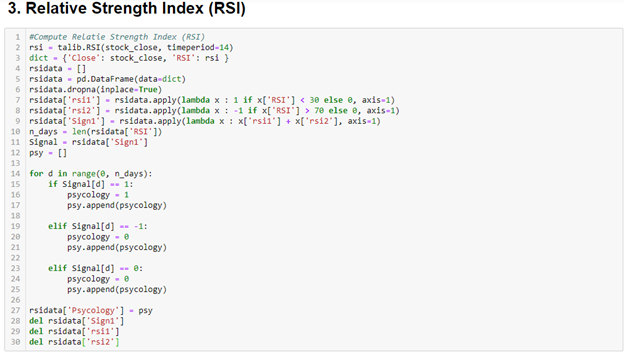
- Relative Strength Index (RSI) - The Relative Strength Index (RSI) calculates a ratio of the recent upward price movements to the absolute price movement. The RSI ranges from 0 to 100. The RSI is interpreted as an overbought/oversold indicator when the value is over 70/below 30.
Volatility
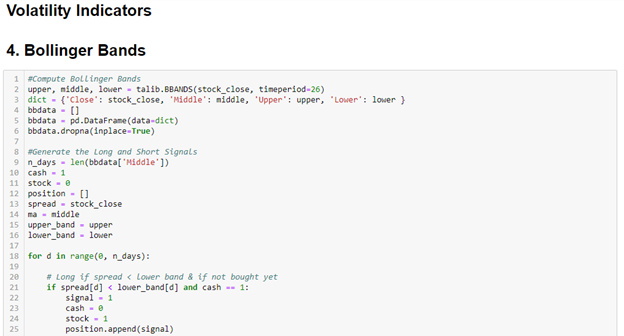
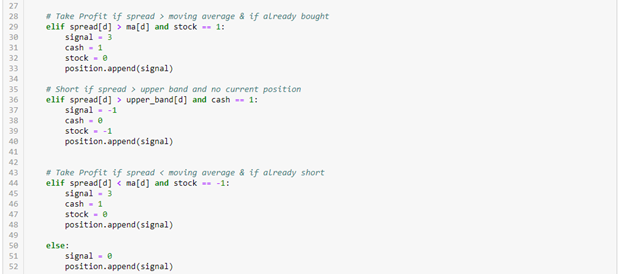
- Bollinger Bands (BB) - Bollinger Bands consist of three lines. The middle band is a simple moving average of the price. The upper and lower bands are F standard deviations (generally 2) above and below the middle band. The bands widen and narrow when the volatility of the price is higher or lower, respectively. Bollinger Bands do not, in themselves, generate buy or sell signals; they are an indicator of overbought or oversold conditions. When the price is near the upper or lower band it indicates that a reversal may be imminent. The middle band becomes a support or resistance level.
Volume
- Force Index (FI) - The Force Index is an indicator that uses price and volume to assess the power behind a move or identify possible turning points.
Investment Strategies
In determining an investment strategy, we looked at two long-only trading methods. In addition, it was taken that when a signal was generated (by the Random Forest Classifier) for an individual stock, a fixed proportion of capital would be invested in that equity. In our work, we set this fixed proportion to 10% of the wealth. In principle that meant that each of the ten stocks in our investment portfolio had an equal weight of 10%. This was in line with the weights used in constructing our index (benchmark).
- Our primary investment strategy looked at a daily rebalancing of the investment portfolio. In this case, 10% of our capital was invested in any stock that produced a buy signal. For those stocks that did not produce a signal, their allocation was kept in cash earning zero per cent interest.
- Our second strategy followed that of the primary strategy but with weekly rebalancing instead of daily.
Random Forest Classifier
Results from the technical indicators (x-values: independent variables) along with the investment strategies signals (y-values: dependent variable) were then incorporated into a Random Forest machine learning model with the first seven and a half years of features used as the training dataset (02/01/2009 – 27/06/2016) and the last two and a half years as the test dataset (08/07/2016 – 31/12/2018).
The Hyper-Parameters for the Random Forest algorithm was then fine-tuned for each of the ten stocks in the respective strategies (i.e. daily and weekly rebalancing strategies which resulted in twenty models in total).
Following the signals generated by the machine learning algorithms, returns for each investment strategy was then measured against the returns produced by the constructed benchmark over the last two and a half years (test dataset). Further to this, we also compared our returns to the returns generated by three more common technical analysis indicators, namely: Bollinger Bands, RSI and MACD.
Strategy Performance
Strategy 1 (Primary) – Daily Rebalancing with Cash Invested at 0% Interest
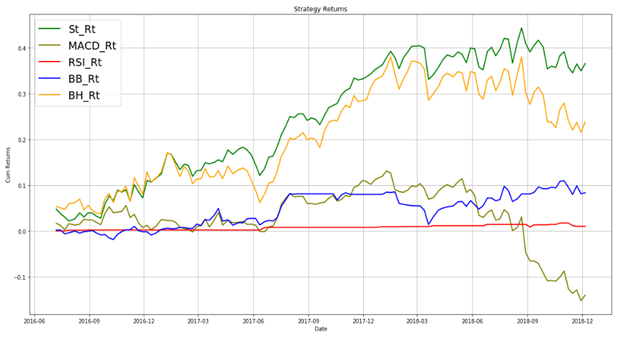
Results from our back-test show that our daily rebalancing strategy returned a commendable 44.69% over the two-and-a-half-year test period. This compared favourably to our constructed benchmark which only produced a return of 21.45% (outperformance of 23.24%). Interestingly over the same timeframe, we note that the Bollinger Band indicator produced a return of 7.26%, followed by RSI with 6.54%. The MACD indicator, however, resulted in a negative return of -10.35%.

Given the notable outperformance from our Random Forest Classifier, we can deduce that in the context of the South African Market, there may be evidence of enhancing returns by applying a machine learning algorithm (such as the one used in this project) to more accurately predict the trend of a stock.
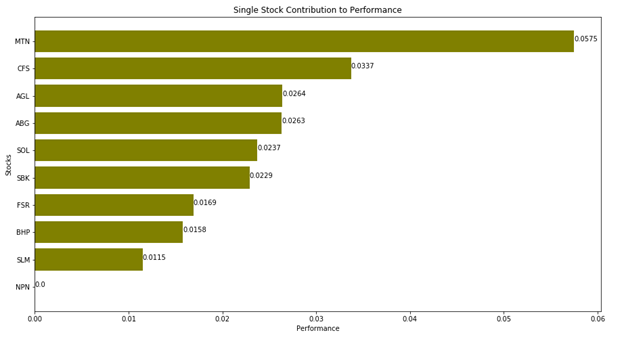
We also investigated the outperformance from the Random Forest Classifier for each of the stocks considered. Here we computed the returns from our model (which generated long only trade signals) and compared that to the Buy and Hold return for the individual stock.
Our results show that MTN produced the highest outperformance of 5.75%, followed by CFR with 3.37%. Also worth noting is that given the significant rally in the Naspers stock over the past several years, our machine learning model indicated a Buy and Hold recommendation for this stock which consequently resulted in a 0% outperformance for this particular equity. Other than Naspers though, all other stocks contributed positively to portfolio performance.
Strategy 2 – Weekly Rebalancing with Cash Invested at 0% Interest
Similarly, our second strategy consisting of weekly rebalancing also produced a noteworthy return of 36.52%. This again compared favourably to the returns from our derived benchmark of 23.76% (outperformance of 12.66%). Furthermore, looking at the returns produced by our technical indicators, we note that the Bollinger Band indicator generated a return of 8.35%, followed by RSI with 1.02%. The MACD indicator once more resulted in a negative return of -14%.
Results from this strategy provide further support that there may be potential to enhance returns by following a machine learning algorithm. In this project, a Random Forest Classifier was used to generate long only trade signals for individual stocks in a portfolio and accordingly it has been shown that the model followed was able to improve the timing of stock trades (i.e. purchases and sales).
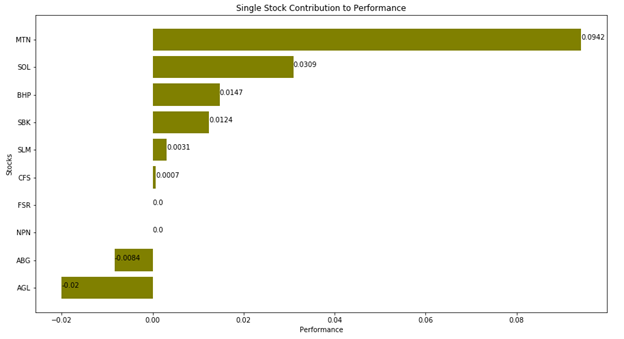
Looking at the model performance for each of the stocks, we note that in the case of weekly rebalancing, MTN once more produced the highest outperformance of 9.42% followed by SOL with 3.09% and BHP with 1.47%.
Interesting, we also note that in this strategy ABG and AGL contributed negatively to portfolio returns with -0.84% and -2% respectively.
Closing Comments
Results from our study have provided further support for the advances in machine learning models in stock trading. More specifically we have found evidence of enhanced returns by applying these models to the South African market.
We believe that our work can be enriched by investigating the application of these algorithms to other African or Emerging markets. It would be extremely interesting to see if these models provide any improvement in returns in these markets as well as in other asset classes (such as currencies, commodities and credit).
We hope that this article stimulates further research in this field, particularly in the South African context, and in doing so, helps promote the benefits of using machine learning algorithms in finance.
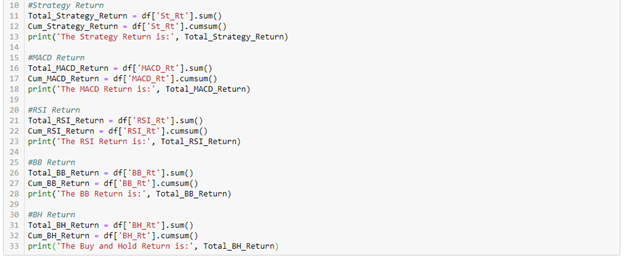
Annexure (Python Codes)
The below syntax is an example of the python code run for the ABG stock. The following code shows the process followed for the primary investment strategy (i.e. daily rebalancing). The steps followed can be broken down as follows:
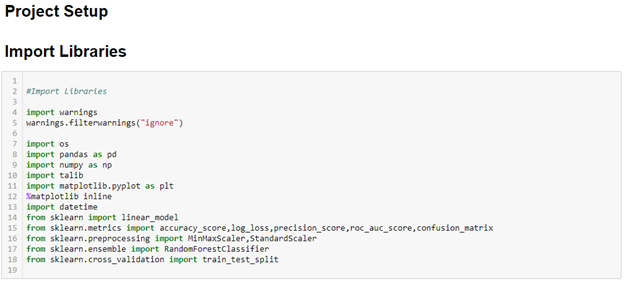
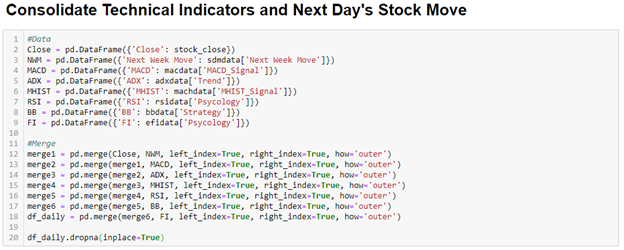
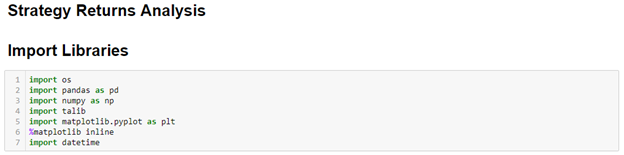
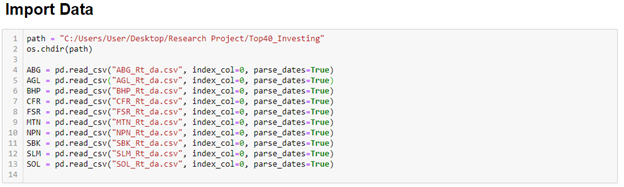
- Import Libraries and Data
- Compute the six Technical Analysis Indicators to the data: x-values (independent variable)
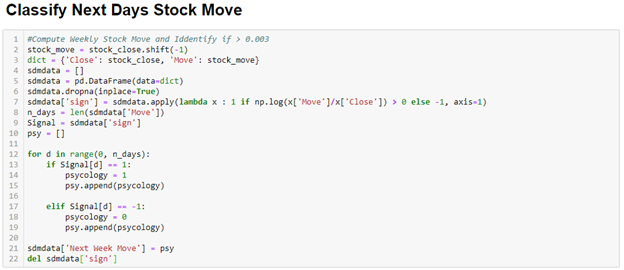
- Calculate the daily stock price move: y-value (dependent variable)
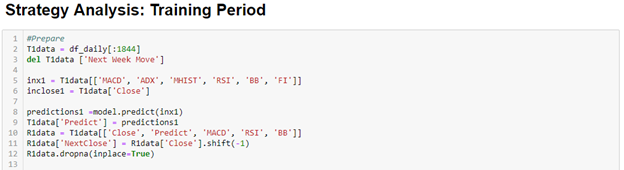
- Build the Random Forest Classifier by Integrating these variables into the Model
- Train the Model by analyzing the training and test scores – fine-tune Model Hyper-parameters
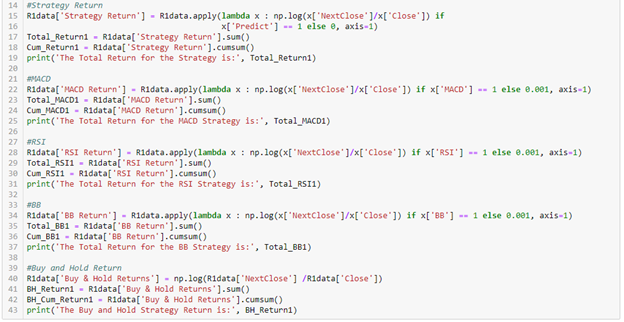
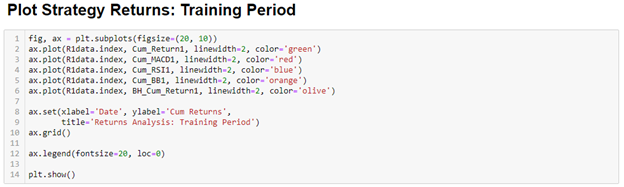
- Evaluate and compare the returns produced by the model for the training and test periods
Example of Python Code below - ABG Stock and Daily Data:
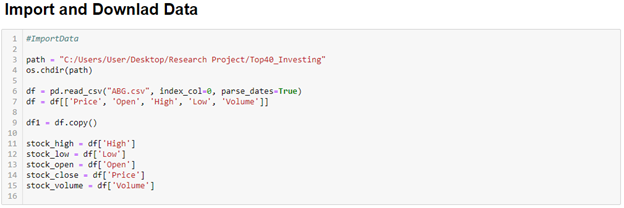


The same procedure is followed for the remaining nine stocks in our investment portfolio (universe). Similarly, this process is repeated for the weekly rebalancing strategy. In this case, the only difference is that weekly data points is used instead of daily.
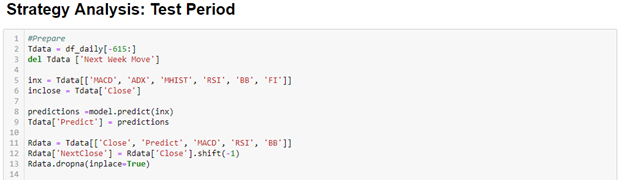
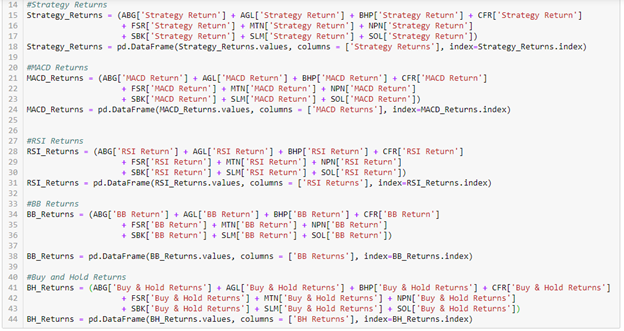
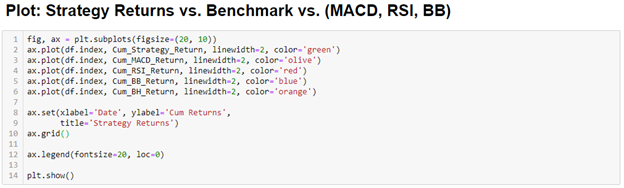
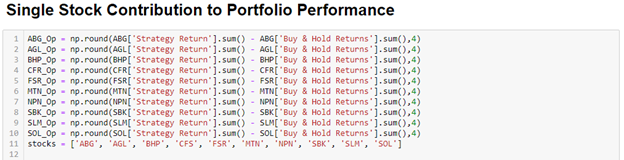
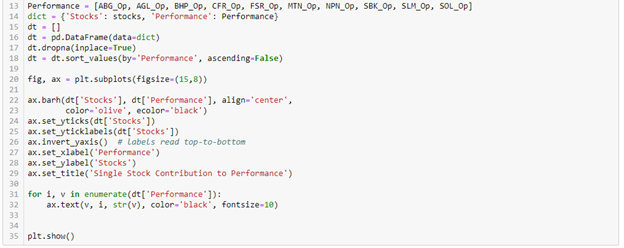
Next, we assess the portfolio’s performance against that of the benchmark and the returns produced by three Technical Indicators (MACD, RSI and BB). In addition, we compute the contribution to portfolio performance for each stock in our investment portfolio. Again the python code used for the analysis is shown below:


This concludes the project on how one can use technical indicators for predicting market movements and stock trends by using random forests, machine learning and technical analysis. Explore the 'Technical Indicators Python' from Quantra.
Bibliography
- Dr. Elder, A. 2014. The New Trading for a Living. Wiley Trading Series.
- Hartshorn, S. 2016. Machine Learning with Random Forests and Decision Trees: A Visual Guide for Beginners. Amazon Digital Services LLC.
- Larsen, J.I. 2010. Predicting Stock Prices Using Technical Analysis and Machine Learning. Norwegian University of Science and Technology.
- Smith, C. 2017. Decision Trees and random Forests: A Visual Introduction for Beginners. Blue Windmill Media.
- Sunden, A. 2008. Trading based on Classification and Regression Trees.
If you want to learn various aspects of Algorithmic trading then check out the Executive Programme in Algorithmic Trading (EPAT®). The course covers training modules like Statistics & Econometrics, Financial Computing & Technology, and Algorithmic & Quantitative Trading. EPAT equips you with the required skill sets to build a promising career in algorithmic trading. Enroll now!
Disclaimer: The information in this project is true and complete to the best of our Student’s knowledge. All recommendations are made without guarantee on the part of the student or QuantInsti®. The student and QuantInsti® disclaim any liability in connection with the use of this information. All content provided in this project is for informational purposes only and we do not guarantee that by using the guidance you will derive a certain profit.
List of files in the download:
- 20 Research Python Codes
- 2 Research Analysis Python Codes