
This is a project that will guide you about getting an insight into how your strategy would perform by using certain techniques and a couple of tools ie. in short, how to test a trend.
This article is the final project submitted by the authors as a part of their coursework in Executive Programme in Algorithmic Trading (EPAT) at QuantInsti;. Do check our Projects page and have a look at what our students are building.
About the Author
Gunraj Mehta is an MCA from VJTI, Mumbai; and holds a Bachelors degree in Computer Science from the University of Mumbai. He is currently based in Toronto, Canada where he is the Senior Software Programmer, Liquidity Risk Technology at Scotiabank.
Purpose
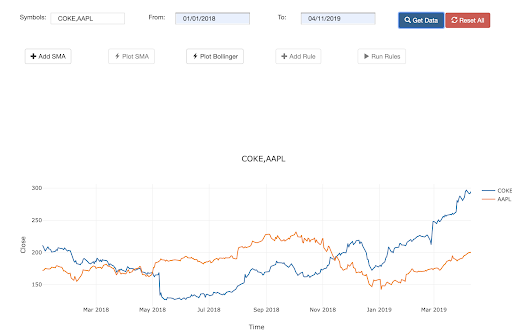
I wanted to develop a simple tool where we can input the ticker symbol, add some technical indicator and some basic rules to get an insight of how the strategy will perform before proceeding with the actual implementation and spending additional time optimizing it.
The result was a web tool, capable of plotting the closing prices from OLHC data, adding basic statistical indicators like SMA and Bollinger bands; and then applying a custom trading strategy to get the performance.
Trend Following Strategies
Trend Following strategy works on a simple system of statistics, they are about reacting to the change rather than predicting where the market will head. Their simple nature makes it easy to visualize when to buy and sell and assess the margins. For those new to trend-following concepts, reading through foundational algo trading books before implementing your own tools can help you build the intuition needed to design effective rule sets. It doesn’t matter how the market is trending, it’s always trending be it upwards or downwards, these strategies follow a more scientific approach to trading. Some of the indicators used for Trend Following strategies are SMAs, Bollinger Bands, MACD and RSI Indicators.
Tool Details
The tool was coded in Python. It uses Flask for the web services, JQuery and Bootstrap for the UI. Numpy, Pandas and Yahoo for data and operations. Gunicorn for deployment on Heroku.
Logic
The executeRule function forms the core of the execution logic. It takes the inputs as the rules, checks the instructions and accordingly chooses the columns for comparison. The Buy/Sell flag is then flipped based on the logic input. Under the same function, we calculate the P/L values, drawdown period and the buy/sell counts.
Features
Multiple Ticker search can be used for pair strategies (cross overs only currently)
Add SMAs, Bollinger bands

Add Rules and execute them to get basic details around performance

Limitations
- Can only work with crossovers
- Considered 1 stock buy/sell
- Can not understand log, ln etc when using crossovers
- Single condition is allowed in each rule
- MACD and RSI not added
Future scope/ Enhancements possible
- Cover the limitations
- Ability to get live feed and setup alert for rule executions
- Add complicated rule evaluation, maybe a basic excel formula like scripting
Project Files are available on Github.
If you want to learn various aspects of Algorithmic trading then check out the Executive Programme in Algorithmic Trading (EPAT®). The course covers training modules like Statistics & Econometrics, Financial Computing & Technology, and Algorithmic & Quantitative Trading. EPAT® equips you with the required skill sets to build a promising career in algorithmic trading. Enroll now!
Disclaimer: The information in this project is true and complete to the best of our Student’s knowledge. All recommendations are made without guarantee on the part of the student or QuantInsti®. The student and QuantInsti® disclaim any liability in connection with the use of this information. All content provided in this project is for informational purposes only and we do not guarantee that by using the guidance you will derive a certain profit.
