
By Varun Divakar and Rekhit Pachanekar
Random walk! What comes to your mind when I say these two words. If you thought about an individual walking in such a manner that we can’t tell where they will go next, well you are not far from the concept. But how does a person walking randomly influence our views about our decision to go long or short on a stock?
In the world of finance, the theory of random walk suggests that the stock price today has no relation or influence on the stock price tomorrow, and the direction the stock price goes is entirely random and unpredictable. While the random walk hypothesis challenges predictability, practitioners test this empirically through backtesting, the course on backtesting trading strategies python gives you the tools to run such statistical tests on any asset using real historical data.
Wait! Does that mean all those technical and Quant analysis tools are redundant? While the random walk theory has quite a few supporters, its critics are still alive and kicking. Anyway, let’s start with the blog and see which topics we will cover in a few minutes.
- What is a Random Walk?
- Random Walk Theory in Markets
- Criticisms on Random Walk
- Geometric Brownian Motion in action
- Random Walk Simulation Of Stock Prices Using Geometric Brownian Motion
What is a Random Walk?
If I have to define a random walk, I would say that it is a stochastic process which is used to describe a path taken by an object which is seemingly random, or unpredictable. Yes, that’s all there is to it.
Fun fact: There is a really big statue created by the artist Antony Gormley which was created using Random Walk. Have a look below:

Image Courtesy: Wikimedia
There are a lot of examples of random walks in real life. They range from a drunkard’s unpredictable walk, the motion of gas molecules in a room, even the flip of a coin can be said as random.
But if it is random, why do we have to study it?
Let me give this answer with the help of an example for a simple random walk. Let’s take the often overused example in probability, the coin toss. Now we know that there are two outcomes to a coin toss, Heads or tails. If you toss a coin, you don’t know with certainty whether it’s heads or tails, right? Of course, given 10, 50 maybe 100 tosses, you will find that the coin was heads around 50% of the time. That’s the point, given enough trials, we are trying to find patterns in a seemingly random process. This helps us study a process and if possible, predict the outcome too.
In fact, let’s move further and take an example concerning the stock markets. While Random walk can consist of continuous variables, we will talk about a simple random walk simulation.
Supposing Company RED has a stock price at $100 and we say that one step size is $10. Since Random walk states that the object’s path is uncertain and doesn’t depend on anything, not even historical prices, we know for certain that the stock can have only two values on the next day, increase or decrease by $10.
Thus, if we say on Feb 10, if the value was $100. On Feb 11 it could be either $90 or $110.
On Feb 12, there can be 4 possible outcomes, $90 could either go to $80 or $100 and $110 could go either $100 or $120.
That’s interesting, if we try to see the outcomes in a tabular format, it would look something like this:
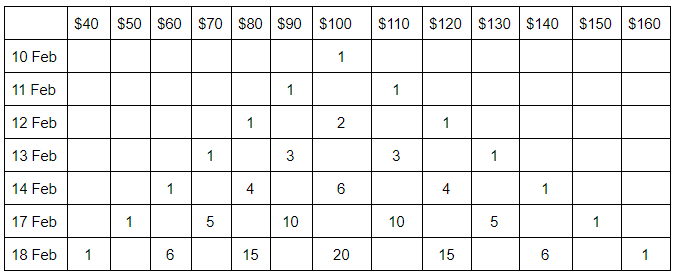
Of course, here we have assumed that just like a coin, there is an equal probability that the stock price can either go up or down. In real life, for any random process, we cannot say for sure that what the probabilities are for the path an object takes.
I would like to add a concept here, which is called “drift”. In the earlier examples, we have said that both outcomes (stock going up or down) have equal probability. We said this because it was supposed to be a simple random walk. But there are certain cases when one outcome has more weight than the other. When you think about the stock market, this “drift” will actually become clearer. Although individual stocks are somewhat difficult to ascertain, we can see that as a whole, the stock market is usually moving upwards. Thus, we will say that the stock market has a drift towards the opposite side.
Hold On! We saw an example of a coin toss being a random walk and also a path created by the stock price. But there seems to be something amiss. Let’s understand if random walk can be applied to the stock markets or not.
Random Walk Theory in Markets
Burton Malkiel popularised the concept of random walk in terms of trading in the book “A random walk down wall street”. As we had mentioned above, the random walk theory says that the stock price of tomorrow does not depend on the stock price today. In other words, there is no way we can figure out the future stock prices.
Burton built on top of earlier works and had said that the stock market movements exhibit a random walk and thus, one cannot predict the future prices with any accuracy. He had studied the various investing techniques and criticized the financial advisors saying that we are better off investing in a passive index fund than actually trying to beat the market. He said that very few funds managed by financial advisors have actually outperformed the financial markets.
Here’s a fun fact, to support his theory, he told his students that they had bought an imaginary stock for $50 and then told them to flip a coin and for every heads, the stock would close half a point higher and vice versa. After quite a few coin tosses, the chart created was given to a technical analyst who couldn’t tell that it was a fake chart and gave a buy signal to Burton.
It is also worth noting that he had also mentioned that if you give darts to a monkey and tell him to throw them at a dartboard consisting of stocks, they would be at least as successful as the financial advisors.

Of course, there have been experiments trying to simulate these exercises with interesting results. What were these results? Let’s see them in the next section.
Criticisms on Random Walk
Let me mention two experiments here, both seemed to support the random walk hypothesis at first glance, but the truth turned out to be otherwise.
In the first instance, Mark Skousen first asked his students in the “Financial Economics” class to select one stock which would be a good performer and then told the same to throw a dart on a board containing 1000 stocks. By the end of the semester, after averaging the returns, it was found that the portfolio of stocks which were selected by throwing darts outperformed the carefully selected stock portfolio.
If that convinced you, wait till you hear the next one. Rob Arnott, CEO of Research Affiliates also created a random portfolio of 30 stocks from a total of 1000 stocks, giving equal weightage to all the stocks and then measured the returns against the market returns. To make sure it was a random process, he repeated the process 100 times, in effect, creating 100 random portfolios. And guess what? 96 of those portfolios outperformed the benchmark index
Does that mean Random Walk hypothesis is true?
Hold on! Ron Arnott had explained this outperformance in a simple manner. The 1000 stocks in the universe consisted of more small cap stocks than large caps. Thus, it was only natural that the portfolio had more of small caps (high risk but high reward) than large-cap (low risk but low reward) and hence, the “randomly picked” stock portfolio had a high chance of outperforming the stocks. You can read the whole story here.
Now wait a minute. We can still say that yes, there is a high risk but we do outperform the markets, right?
Not quite. As we have seen from countless examples, in the long term, the returns that small caps provide gradually recede, and in some cases, reduce sharply. Hence, in the long term, this randomly selected portfolio might not be a good idea.
Also, we know that stock prices can be influenced by a variety of factors, a prime example being earnings announcement or key events. Thus a simple historical analysis could give us some insight on the future movement of the price movements.
It is interesting to note that while some think the random walk is further proof of the efficient market hypothesis, others conclude that they are wide opposite when it comes to their implications. If we have to take a more current event into account, Burton has actually admitted that “smart beta” could be used to outperform the market, implying that it is possible to beat the market. While it is not exactly relevant, you can read about it here.
But in a way, we can use the random walk hypothesis and try to predict the stock price after all. Before we see the python code, let us look at Geometric Brownian motion first.
Geometric Brownian Motion (GBM)
Future stock prices are very hard to predict and are dependent on the past trend and volatility. While simulating the stock prices we have to give reasonable weightage to these two parameters. The random walk model helps incorporate these two features of a stock and simulate the stock prices in a very clear and simple way. Needless to say, the assumption that stock prices are random and cannot be predicted is at the core of this model. Let us first understand the mathematical equation that forms the basis of our simulation:
Xt = μ + Xt-1+ et
Where, Xt is the log of the stock price at time t, Xt-1 is the log of the stock price at time t-1, μ is the drift constant et is the white noise at time t.
As you can see, except μ all the other terms change with time and the random noise will change at every time step. In a standard random walk, the model takes steps of size one at every integer time point and has an equal chance to go up or down. In the above formula, we have chosen a variable step size at every time step. If we take steps of size √h at times which are multiples of h, and then take the limit as h→0, you get a Brownian motion.
If we look at the definition of a Geometric Brownian Motion it states that:
"A Geometric Brownian motion (GBM) (also known as exponential Brownian motion) is a continuous-time stochastic process in which the logarithm of the randomly varying quantity follows a Brownian motion (also called a Wiener process) with drift."
This definition is very close to the above equation that we have started with, so to simulate the stock prices in this example we will be using the SDE or Stochastic Differential Equation of St (a stochastic process).
St = St-1* exp((μ-(σ2/2))*t + σWt)
Where St is the stock price at time t, St-1 is the stock price at time t-1, μ is the mean daily returns, σ is the mean daily volatility t is the time interval of the step Wt is random normal noise.
Random Walk Simulation Of Stock Prices Using Geometric Brownian Motion
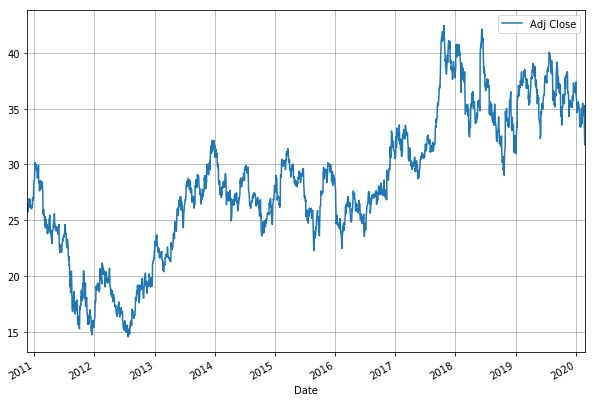
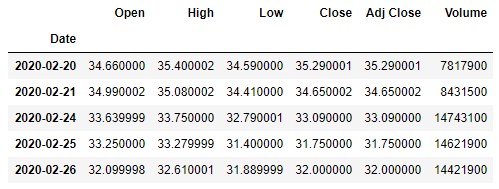
Now let us try to simulate the stock prices. For this example, I have taken the General Motors stock data since 2008. The code for importing the libraries and price data is as follows:
The output is as follows:
We will now simulate the prices for the past year and compare them with actual stock performance. First, we calculate the sigma and mu parameters from the previous equations.
Next, we create a dictionary to save all the simulations that we will be making. In this dictionary along with the simulations, we will save the actual stock prices for comparison.
Next, to simulate the prices we should begin all the simulations from the same starting price. In this case, we consider the adjusted close price of the stock that was one year ago.
Next, we simulate the next days’ close price as per the GBM formula and append it to the simulation data.
The python code for the above is as follows:
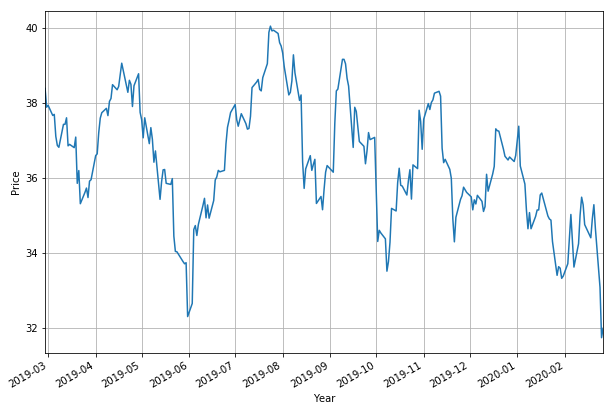
Finally, we will plot 5 simulation and actual price to visualize it.
The actual price plot is as shown below:
The random walk simulation is given by:
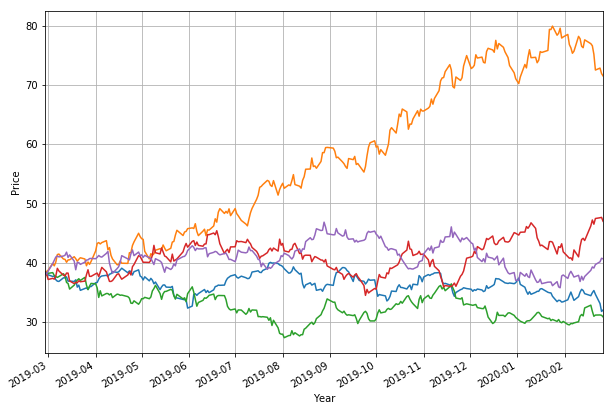
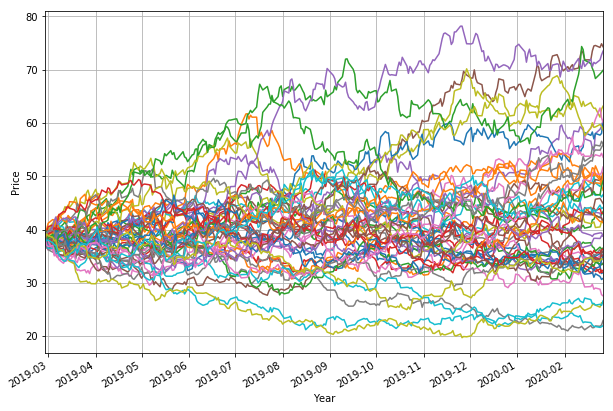
That is interesting. Keep in mind that we kept 5 simulations here. What happens if we increase it to 50. Let’s see it now:
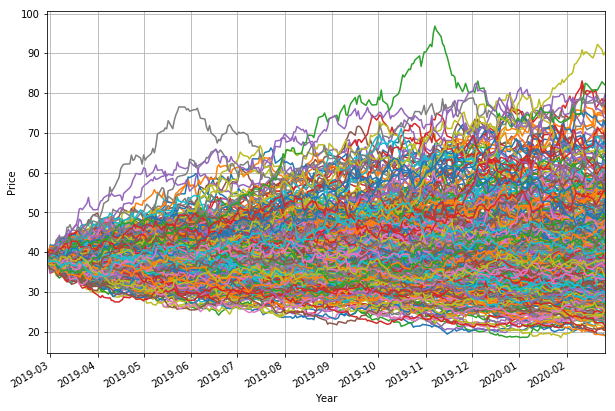
And 500! Let’s try that too,
Conclusion
These simulations are very useful when one is interested in finding the VaR or the expected shortfall for a particular stock with a certain degree of confidence. To perform such risk management analysis one should generate as many simulations as possible.
Traders have been using a number of stochastic models to identify a winning strategy. You can learn more by taking the seven-course bundle which includes various quantitative strategies and models.
Disclaimer: All investments and trading in the stock market involve risk. Any decisions to place trades in the financial markets, including trading in stock or options or other financial instruments is a personal decision that should only be made after thorough research, including a personal risk and financial assessment and the engagement of professional assistance to the extent you believe necessary. The trading strategies or related information mentioned in this article is for informational purposes only.
