
By José Carlos Gonzáles Tanaka
TL;DR
Most trading strategies fail because they assume the market behaves the same all the time.
But real markets shift between calm and chaotic, and strategies must adapt accordingly.
This project builds a Python-based adaptive trading strategy that:
- Detects current market regime using a Hidden Markov Model (HMM)
- Trains specialist ML models (Random Forests) for each regime
- Uses the most relevant model based on regime prediction
- Filters weak signals to reduce noise
- Compares performance vs. Buy-and-Hold
- Uses walk-forward backtesting to remain adaptive over time
- Applies this to Bitcoin, but easily extendable to other assets
It’s a modular, beginner-friendly framework that you can customise, extend, and evolve for real-world deployment.
Prerequisites
To get the most out of this blog, it’s helpful to be familiar with a few foundational concepts. First, understanding Python fundamentals and libraries is essential, especially the use of Pandas for handling time-series data. You can explore these in-depth through Python for Trading: A Step-By-Step Guide and Pandas in Python: A Guide to High-Performance Data Analysis.
Since the blog heavily leans on probabilistic modeling, having prior exposure to Markov processes and their extension into Hidden Markov Models is recommended. For that, Markov Model - An Introduction and Intro to Hidden Markov Chains will provide the necessary conceptual grounding.
Additionally, as this strategy aims to adapt to changing market conditions, knowledge of walk-forward optimization can be beneficial. Walk-Forward Optimization (WFO): A Framework for More Reliable Backtesting helps you understand how to evaluate models over shifting regimes.
A common reason trading strategies fail is that they’re too rigid.
Let me unpack that.
They apply the same logic whether the market is calm and trending or volatile and chaotic. A strategy that works well in one environment can easily fall apart in another.
So, what’s the solution? It might not be a "better" rigid strategy, but an adaptive one to these “market regimes”.
So, what are we going to do today?
We're going to build a Python-based trading strategy that first tries to figure out the market's current "mood" (or regime) and then uses a machine learning model trained specifically for that environment. We'll walk through the entire script, function by function, so you can see how it all fits together.
This is a practical framework you can experiment with and build on. Let's get into the code.
Are you ready? Get your popcorn, eat it with the left hand, scroll down with the right!
The Foundation: Imports and Setup
First things first, let's get our imports out of the way. If you've done any quantitative analysis in Python, these libraries should look familiar. They are the standard tools for data handling, machine learning, and finance. For a good summary of the most useful libraries, QuantInsti's Blog on the Best Python Libraries for Algorithmic Trading is a great resource.
Python code:
Step 1: Getting the Data
In algo trading:No data, no strategy!
So, our first function, get_data, is a simple utility to download historical market data using yfinance. We also calculate the daily percentage returns here, as this will be a key input for our regime detection model later.
Python code:
Step 2: Feature Engineering
Raw price data alone isn't very useful for a machine learning model. We need to give it more context. This is where feature engineering comes in.
The engineer_features function does two main things:
- Calculates Technical Indicators: It uses the ta library to generate dozens of indicators like RSI, MACD, and Bollinger Bands. This gives our model information about momentum, volatility, and trends.
- Ensures Stationarity: This is a crucial step in time series analysis. We test each indicator to see if it's "stationary." A non-stationary indicator (like a moving average on a trending stock) can mislead a model. If an indicator isn't stationary, we convert it to a percentage change to make it more stable.
Finally, we define our target y_signal: 1 if the price goes up the next day, and -1 if it goes down. This is what our model will try to predict.
Python code:
Step 3: The Backtesting Engine
This is where the core logic of the strategy lives. A backtest shows how a strategy might have performed in the past. We use a "walk-forward" method, which is more realistic than a simple train-test split because it continuously retrains the models on more recent data. This helps the strategy adapt to changing market behavior over time. To learn more about this method, check out QuantInsti's article on Walk-Forward Optimization.
The run_backtest function is doing a lot, so let's break it down.
The Code: run_backtest
Python code:
Breaking Down the Backtest Logic
So, you saw this whole code script and you stopped eating your popcorn, right?
Don’t worry! We got you covered:
On each day of the backtest, the script performs these steps:
1. Slice the Data:
It creates a window_size (4 years) of the most recent historical data to work with.
2. Detect the Market Regime:
- It trains a Hidden Markov Model (HMM) on the daily returns of the historical data. The HMM's job is to find hidden "states" in the data. We've set it to find two states, which often correspond to low-volatility and high-volatility periods.
- The HMM then labels each day in our historical data as belonging to either "Regime 0" or "Regime 1".
3. Train Specialist Models:
- Now, instead of training one general model, we train two specialists using Random Forest Classifiers.
- Model 0 is trained only on data the HMM labeled as "Regime 0." It becomes our low-volatility expert.
- Model 1 is trained only on "Regime 1" data, making it our high-volatility expert.
4. Forecast and Generate a Signal:
- First, the HMM predicts the probability of tomorrow being in Regime 0 vs. Regime 1.
- We then feed today's data to both specialist models. Model 0 gives us its prediction, and Model 1 gives us its prediction. These are probabilities of an upward move.
- Here's the key part: if the HMM is leaning towards Regime 0 for tomorrow, we use the signal from Model 0. If it expects Regime 1, we use the signal from Model 1.
5. Filter Out Weak Signals as a Risk Management Tool:
- We don't want to trade on every minor signal. A 51% probability isn't very convincing. We set a limit threshold.
- We only go long (1) if the chosen model's probability is high enough (e.g., > 0.53).
- Otherwise, we stay neutral (0). This helps filter out noise.
Step 4&5: Visualizing Results and Running the Script
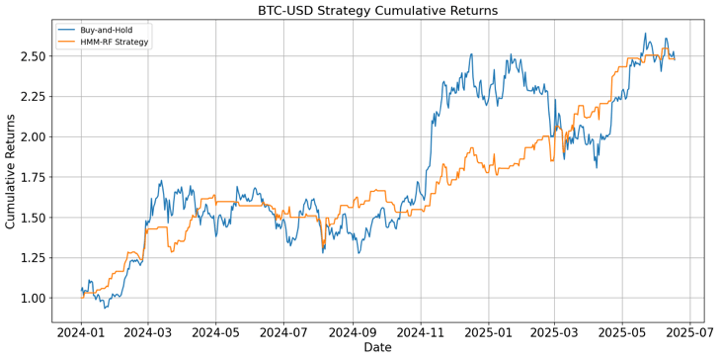
After all that work, we need to see if it paid off. The plot_results function calculates the strategy's cumulative returns and plots them against a simple Buy-and-Hold strategy for comparison.
Python code:
The compute_perf_stats function prints a table with relevant metrics to evaluate the performance of both strategies.
Python code:
Last but not least, the main execution block (if __name__ == '__main__':) is where you set the parameters like the ticker and date range, and run the whole process.
For this exercise, we use Bitcoin as our preferred asset. Import data from 2008 to 2025, show backtesting results from January 2024, and create the prediction feature with the first lead of the close-to-close returns.
Python code:
See the plot:
And the performance stats table:
|
Buy & Hold |
Strategy |
|
|
Annual return |
50.21% |
53.55% |
|
Cumulative returns |
136.83% |
148.11% |
|
Annual volatility |
43.06% |
26.24% |
|
Sharpe ratio |
1.16 |
1.76 |
|
Calmar ratio |
1.78 |
2.67 |
|
Max drawdown |
-28.14% |
-20.03% |
|
Sortino ratio |
1.83 |
3.03 |
The results look promising because the strategy returns have lower volatility than the buy-and-hold returns. Although this is just a sample. There are some things you can do to improve the results:
- Add more input features
- Add risk-management thresholds
- Instead of training your ML model in the regime-specific training samples, you can generate multiple paths of synthetic data based on each regime and optimize your ML model based on those synthetic samples. Check out our blog, TGAN for trading.
- You can use more ML models for each regime and create the signal based on a meta learner.
Frequently Asked Questions
1. What is a "market regime"?
A market regime is a broad characterisation of market behaviour, such as high volatility versus low volatility. This framework uses machine learning (HMM) to detect such regimes dynamically.
2. Why train separate models for different regimes?
Because one-size-fits-all models might tend to underperform in some cases. Models trained on specific market conditions might be better at capturing behavior patterns relevant to that regime.
3. What kind of data does this strategy use?
- Price data from Yahoo Finance via yfinance
- Engineered features like RSI, MACD, Bollinger Bands
- Daily returns and their regime-labeled patterns
4. What machine learning models are used?
- Hidden Markov Models (HMMs) to classify regimes
- Random Forest Classifiers for predicting the next move within each regime
- (Optionally) Meta learners or ensemble models can be added later
5. What’s “walk-forward” backtesting?
A realistic evaluation method where the model is retrained over expanding windows of historical data. This simulates how a strategy might behave when deployed live.
6. Why Bitcoin?
Bitcoin offers high volatility, clear regime shifts, and continuous market access, making it ideal for showcasing adaptive strategies. But the framework works for stocks, forex, or futures too.
7. Can I run this without coding?
Some coding knowledge is required, particularly in Python, pandas, and scikit-learn. But the functions are modular, well-commented, and beginner-friendly.
8. How can I improve this strategy?
- Add more engineered features (volume, macro data, sentiment, etc.)
- Use synthetic data to augment training
- Add stop-loss or drawdown thresholds
- Experiment with different ML models (XGBoost, LSTMs, Transformers)
- Add a meta learner to combine model predictions
Conclusion
By identifying the market state first and then applying a specialist model, this strategy builds adaptability into its core logic. It’s less about having a single perfect model and more about having the right model for the right conditions.
What we've built here is a framework for thinking about market dynamics. The best way to learn is by doing, so I encourage you to grab the script and play with it. Try different tickers, adjust the conviction limit, swap out the Random Forest for another model, or add new features. This is a solid foundation for developing your own robust trading strategies.
Next Steps
Once you’ve worked through the blog and understand how regime classification and model selection work in tandem, you might want to build on this framework using more advanced tools.
A natural next step is to explore alternative models like XGBoost for better predictive power. The blog XGBoost for Time Series Forecasting in Trading walks through its implementation. To further expand your modeling horizons, Directional Change in Trading introduces a novel way to detect market shifts that goes beyond time-based segmentation.
At the same time, robust risk management is crucial when using multiple models, and Position Sizing in Trading offers a practical framework for capital allocation based on model confidence and volatility.
For structured learning, the Technical Indicators & Strategies in Python course on Quantra provides a foundation in strategy design using rule-based indicators, helping you contrast them with your machine-learning approach.
If you’re interested in diving deeper into supervised learning, model evaluation, and time-series forecasting, you’ll find the Machine Learning & Deep Learning in Trading learning track on Quantra highly relevant.
Finally, if you are looking for the best algorithmic trading course to take your strategy-building journey further moving from this Python concept to a live deployment, the Executive Programme in Algorithmic Trading (EPAT) offers a comprehensive curriculum, including modules on machine learning, backtesting, and API integration with brokers.
Disclaimer: This blog post is for informational and educational purposes only. It does not constitute financial advice or a recommendation to trade any specific assets or employ any specific strategy. All trading and investment activities involve significant risk. Always conduct your own thorough research, evaluate your personal risk tolerance, and consider seeking advice from a qualified financial professional before making any investment decisions.
