By Jay Maniar
In our last post on the sentiment indicators, we saw how we can use sentiment indicators like Put/Call ratio, Arms Index or Short term trading Index (TRIN) for trading and formulate a strategy around such sentiment indicators. In this post, we will explore more such sentiment indicators and illustrate different strategies that can be devised using these indicators.
Volatility Index
VIX is a trademarked ticker symbol for the Chicago Board Options Exchange (CBOE) Volatility Index. It is a measure of the implied volatility over the next 30 days, of the S&P 500 index options.
VIX as an Indicator
- CBOE Volatility Index (VIX) is an up-to-the-minute market estimate of implied volatility of the S&P 500 Index which is calculated by taking the midpoints of the bid/ask quotes (price of options) of real-time S&P 500 index options.
- At each tick in the VIX volatility index, it provides an instantaneous measure of how much the market would fluctuate in 30 days from the last tick.
- Hence, the volatility index is forward looking and predicts the volatility of the market in future.
- VIX is quoted as percentage points, i.e. a VIX of 20 represents an expected annualized change of 20% in either direction of the S&P 500 index, at a 68% confidence level or within one standard deviation of the normal probability distribution.
- The generalized formula for calculation for VIX is
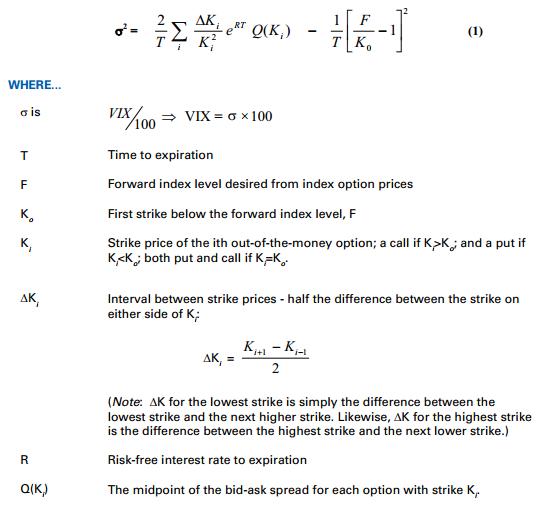
- The calculation of the CBOE Volatility Index (VIX) is a bit complicated, but to understand the details, you can refer to https://www.cboe.com/micro/vix/vixwhite.pdf
VIX Interpretation
- Practically, a high VIX corresponds to falling prices of the index level.
- Before understanding the reason for this, it is important to understand the basics of Option Pricing. Option Price = Intrinsic value + Extrinsic value; where extrinsic value is the summation of time value and volatility. Hence, volatility plays an important role in the pricing of the options.
- A fall in the market typically results in higher premiums of the put options due to volatility. Also, demand for Put options among investors is high since the investors who are holding the stock would like an insurance of their stock investments by buying these put options. This demand is due to further anticipation that market would fall after a realized fall in market since the risk is high due to volatility. Volatility in the market is due to fall in prices and fear among investors of losing invested or gained capital. As a result, they might decide to take gains or realized losses by selling of underlying. This increases the premiums of options resulting in a sharp rise in VIX.
- Generally, a VIX value above 30 is an indication of high uncertainty and fear in the market.
- A low VIX value indicates an expectation of a calm market as a result of the rally seen in the market.
- A rally increases greed among investors and they expect the market to continuously rise. As a result, option writers price their call options with different strike prices in such a way that it is lucrative enough for an investor to buy the option, but the probability of the option being in the money before expiry is not too high. In a rally, more call options are bought, decreasing the (Put/Call Ratio) PCR ratio - indicating a bullish market. Investors may not want to realize all their gains at once at a particular price level, as they expect the market to rise further and sell only a fraction of the portfolio systematically to new buyers who want to enter this rally and hold onto the other part of their portfolio. There can be steady rallies and small corrections in overpriced stocks which reduce the overall volatility.
- This, in turn, drives the VIX value lower. VIX below 20 is generally an indication of a calm market.
Strategy
We will take contrarian positions based on VIX. Taking a contrarian position refers to ‘buying’ when the market falls drastically and ‘selling’ when the market rises irrationally. A contrarian profits from the theory that when there is certain positive or negative crowd behavior regarding a security; it leads to mispricing of the security due to the prevailing bullish or bearish sentiment.
- When VIX is high (generally above 30) we buy the underlying index. Since this is an indication that the market is bearish and the implied volatility is high, we BUY since we expect corrections in the bear market from this level and expect implied volatility to move back to its mean indicating a bull market from this point.
Another strategy could be to be ‘short puts’ that is being delta positive and vega negative. Delta positive means, as the stock price rises so do the option price and a negative vega is a position that can be benefited from falling implied volatility.
- When VIX is low (generally below 15) it is an indication that the market is bullish and a correction is likely. We go ‘long puts’ i.e. delta negative and vega positive or we can SELL the index.
Image: VIX levels and corresponding S&P 500 Index levels

Margin debt indicator
A regular cash account allows you to buy securities worth the amount of cash available in the account. For e.g. If you have $5000 in your account and you want to invest in ABC Corporation’s shares which are trading at $100 on the exchange, then you can buy ($5000/$100) 50 shares of ABC Corporation. But if according to your analysis, ABC Corp is undervalued and you expect a rise in the stock’s value in the near term, you can capitalize on this opportunity by asking your broker to lend you money in order to buy securities in your account. To do this, the broker would require you to open a margin account. A margin account is an agreement between you and your broker such that the broker agrees to lend you a proportional amount of money only to buy financial securities (stocks, bonds, and other financial instruments). The collateral for this loan would be the financial securities purchased (ABC Corp stocks in our e.g.). However, there would be a few prerequisites before you purchase these securities on loan and sign the margin account agreement.
- While buying securities on margin, the proportion that is paid by the investor is called as margin and the proportion that is loaned out by the broker to you, to buy these securities is called margin debt.
- These debts taken by various investors are aggregated and published by exchanges because the brokers are required to report this data to the exchanges.
Interpretation
- An increase in the total margin debt outstanding over time will coincide with a rise in the market, suggesting aggressive buying and a bullish sentiment.
- A rational reason for an investor buying a stock on margin would be because free cash has been exhausted and the investor still sees an opportunity in buying, as a result, the investor buys on margin.
- But every margin account has its own credit limit or the proportion that the broker loans out to his investors. As these margin investors reach their limits of margin credit, their ability to continue buying decreases, as a result of the demand in the market decreases and the prices may come to a standstill or may even decrease because of weaker demand.
- This weaker demand is a result of investors reaching their limits of their buying capacity both of their own equity (or investor’s cash) and the margin debts (ability to buy securities on loans).
- This may result in a drop in the prices of the shares or the index as a whole, resulting in margin calls.
- Unavailability of free cash and decreasing prices and may force the investors or the brokers to sell securities in these margin accounts, further adding selling pressure, further decreasing the prices to new lows.
- Hence, increasing margin debts tend to coincide with increasing market prices and decreasing margin debts tend to coincide with decreasing market prices.
Strategy
- At historical low levels of margin debts, we will BUY the index futures, since there is additional space to buy securities on margin and it might be indicative of an oversold market.
- At historical high levels of margin debts, we will SELL the index futures, since there is no more space to buy securities on margin and a possibility of triggering margin calls.
Image: Margin debt chart and corresponding S&P 500 Index levels

Mutual Fund cash position indicator
Mutual funds hold a substantial amount of all the investable assets present in the market.
- Mutual fund cash position is the ratio of mutual fund’s cash to total assets.
Mutual fund cash position = (mutual fund’s cash/total assets of the mutual fund).
- This cash can be cash in hand or cash invested in highly liquid money market securities which earn a nominal rate of return.
- Generally, this cash position is up to 5%, which these funds are required to keep available all the time on hand to handle shares redemptions, operating expenses on daily basis and likes.
- Cash also comes into a mutual fund on daily basis from customer (investors) deposits, interests earned and dividends received.
- Cash also increases after a fund manager sells a position and holds the funds before reinvesting them.
Interpretation
- During uptrends in the markets, the fund managers would want to quickly invest the cash in the markets because cash (ideal or money market instruments) only earns near risk-free rate returns. Keeping money in cash decreases returns, as investing in uptrends with this cash can earn more than the risk-free rate and increases the performance or overall returns of the fund.
- As a result, generally, when there are medium and long term uptrends in the market, the mutual fund cash position is below 4.5 - 5% as maximum cash is invested in the market with an expectation to make most out of this cash.
- Similarly, during downtrends, investment in cash would earn a near risk-free rate which would be greater than the possible negative return earned in the market. As a result, fund’s cash investment balance increases, expecting to improve fund’s performance or overall return.
- Generally, during such short and medium term downtrends, the cash position may increase to more than 11% in a mutual fund.
- Analysts generally interpret this as a contrarian
- This is because when mutual funds accumulate cash; the fund managers are bearish and this indicates future buying power in the market by these funds.
- A high mutual fund cash ratio suggests market prices are likely to rise in near future.
- On the other hand, when mutual funds’ cash is low, it means they are already invested and market prices reflect their purchases. This leaves less scope for increase in market prices since the fund managers are bullish anticipating rising prices.
Strategy
- We would BUY index futures when the mutual fund cash ratio rises substantially more than the previous cash positions in the recent past.

Mutual fund cash position levels and corresponding S&P 500 Index levels; Image source: caps.fool.com
Conclusion
Always remember, when you trade, do not use these sentiment indicators in isolation. Use indications from more than one sentiment indicators and try to understand the fundamentals and rationality behind such patterns, but be brave enough to take up the contrarian position and capitalize on the fear or greed of other investors.
We delve deeper into these concepts in our course on trading using options sentiment indicators, which includes downloadable codes as well.
Next Step
Learn Options Trading Strategies in detail. Take our 3 course bundle, Options Trading Strategies in Python: Basic, Intermediate and Advanced. Developed in association with NSE Academy. The bundle offers a 30% discount, click here to know more.