By Kristof Leroux and Rekhit Pachanekar
Technical analysis of price and volume history won’t cut it alone nowadays. When we want to perform value investing and/or measure a security’s intrinsic value, we need to make a fundamental analysis of the security.
To perform fundamental analysis we need data, lots of data. We want fundamental data in the form of ratios, financial statements, earnings, etc. On top of that we can also use macroeconomic data like the GDP, unemployment rate, consumer price index.
Recently, financial news and tweets are used in sentiment analysis to assist traders in their decisions.
We will look at each of these different types of data and find decent data providers for them and give an example in Python code how to consume these.
All code examples are made in Google Colab, but can, of course, be executed within any jupyter notebook server or any python environment.
This article is structured as follows:
Fundamental Data
Fundamental data includes financial ratios for initial screening the financial of a company, for example, the Price to Earnings ratio (PE), Price to Book Value ratio (PBV), Return on Equity (ROE), Compound Annual Growth Rate (CAGR), Current ratio, Dividend yield etc.
It also includes the core financial statements used to evaluate a business, being the balance sheet, the income statement and the cash flow statement. These valuable data can be retrieved very easily from Yahoo! Finance and of course, there is a Python package for this, we will use yahoofinancials.
Other famous providers of fundamental data (with a python package) are Quandl and Intrinio. Let's see how you can retrieve this information now.
Financial Ratios
You can check the ratios by printing the variables.
Financial Statements
Financial statements frequency can be ‘annual’ or ‘quarterly’ and type will be ‘income’, ‘cash’, ‘balance’ or any combination of these.
Suggested reads
- Basic Operations On Stock Data Using Python
- How to Get Historical Market Data Through Python Stock API
Macroeconomic Data
Macroeconomics is the branch of economics that studies the economy as a whole.
It focuses on three things: national output (GDP), unemployment rate and inflation.
You can get macroeconomic data from Yahoo! Finance or Quandl Python API, but during my research, I found DBnomics the most interesting.
You can search the database online through the link above for any economic indicator you need and use the time series code directly in your python code.
To retrieve the unemployment rate, for example, we can use the following code, remember that fetching a series will always result in a Pandas dataframe.
The output is as follows:
|
@frequency |
provider_code |
dataset_code |
dataset_name |
series_code |
series_name |
original_period |
period |
original_value |
value |
freq |
unit |
geo |
Frequency |
Unit |
Country |
|
|
0 |
annual |
AMECO |
ZUTN |
Unemployment rate: total :- Member States: def... |
EA19.1.0.0.0.ZUTN |
Annually – (Percentage of active population) –... |
1960 |
1960-01-01 |
NA |
NaN |
a |
percentage-of-active-population |
ea19 |
Annually |
(Percentage of active population) |
Euro area |
|
1 |
annual |
AMECO |
ZUTN |
Unemployment rate: total :- Member States: def... |
EA19.1.0.0.0.ZUTN |
Annually – (Percentage of active population) –... |
1961 |
1961-01-01 |
NA |
NaN |
a |
percentage-of-active-population |
ea19 |
Annually |
(Percentage of active population) |
Euro area |
|
2 |
annual |
AMECO |
ZUTN |
Unemployment rate: total :- Member States: def... |
EA19.1.0.0.0.ZUTN |
Annually – (Percentage of active population) –... |
1962 |
1962-01-01 |
NA |
NaN |
a |
percentage-of-active-population |
ea19 |
Annually |
(Percentage of active population) |
Euro area |
|
3 |
annual |
AMECO |
ZUTN |
Unemployment rate: total :- Member States: def... |
EA19.1.0.0.0.ZUTN |
Annually – (Percentage of active population) –... |
1963 |
1963-01-01 |
NA |
NaN |
a |
percentage-of-active-population |
ea19 |
Annually |
(Percentage of active population) |
Euro area |
|
4 |
annual |
AMECO |
ZUTN |
Unemployment rate: total :- Member States: def... |
EA19.1.0.0.0.ZUTN |
Annually – (Percentage of active population) –... |
1964 |
1964-01-01 |
NA |
NaN |
a |
percentage-of-active-population |
ea19 |
Annually |
(Percentage of active population) |
Euro area |
Now for a more complex example, we are retrieving the Consumer Price Index (CPI) for France and Germany from the IMF dataset for the time window 2000-2002:
The output should be as follows:
|
@frequency |
provider_code |
dataset_code |
dataset_name |
series_code |
series_name |
original_period |
period |
original_value |
value |
FREQ |
REF_AREA |
INDICATOR |
Frequency |
Reference Area |
Indicator |
|
|
540 |
monthly |
IMF |
CPI |
Consumer Price Index (CPI) |
M.DE.PCPIEC_IX |
Monthly – Germany – Communication |
2000-01 |
01-01-2000 |
148.5503 |
148.5503 |
M |
DE |
PCPIEC_IX |
Monthly |
Germany |
Communication |
|
541 |
monthly |
IMF |
CPI |
Consumer Price Index (CPI) |
M.DE.PCPIEC_IX |
Monthly – Germany – Communication |
2000-02 |
01-02-2000 |
142.5116 |
142.5116 |
M |
DE |
PCPIEC_IX |
Monthly |
Germany |
Communication |
|
542 |
monthly |
IMF |
CPI |
Consumer Price Index (CPI) |
M.DE.PCPIEC_IX |
Monthly – Germany – Communication |
2000-03 |
01-03-2000 |
138.9983 |
138.9983 |
M |
DE |
PCPIEC_IX |
Monthly |
Germany |
Communication |
|
543 |
monthly |
IMF |
CPI |
Consumer Price Index (CPI) |
M.DE.PCPIEC_IX |
Monthly – Germany – Communication |
2000-04 |
01-04-2000 |
137.3514 |
137.3514 |
M |
DE |
PCPIEC_IX |
Monthly |
Germany |
Communication |
|
544 |
monthly |
IMF |
CPI |
Consumer Price Index (CPI) |
M.DE.PCPIEC_IX |
Monthly – Germany – Communication |
2000-05 |
01-05-2000 |
134.2771 |
134.2771 |
M |
DE |
PCPIEC_IX |
Monthly |
Germany |
Communication |
|
545 |
monthly |
IMF |
CPI |
Consumer Price Index (CPI) |
M.DE.PCPIEC_IX |
Monthly – Germany – Communication |
2000-06 |
01-06-2000 |
131.2029 |
131.2029 |
M |
DE |
PCPIEC_IX |
Monthly |
Germany |
Communication |
|
546 |
monthly |
IMF |
CPI |
Consumer Price Index (CPI) |
M.DE.PCPIEC_IX |
Monthly – Germany – Communication |
2000-07 |
01-07-2000 |
130.3246 |
130.3246 |
M |
DE |
PCPIEC_IX |
Monthly |
Germany |
Communication |
Earnings Calendar
Earnings refer to a company's profits in a given quarter or fiscal year. Earnings are an important figure to use when analyzing a company's profitability.
A company's earnings are used in many common ratios. It can be compared to analyst's earnings estimates, the company's past performance, or against peers within the same industry. Earnings can have a large impact on stock price, and as a result, the figure is subject to potential manipulation.
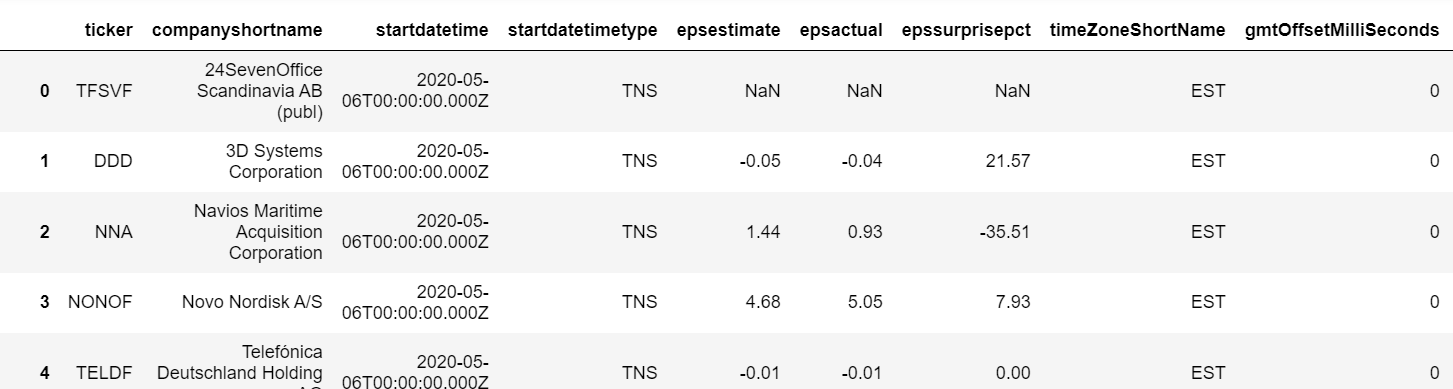
We use the handy python package yahoo_earnings_calendar to retrieve the exact dates a company releases its earnings information.
Get earnings date information on a specific date or in a date range
The output is as follows:
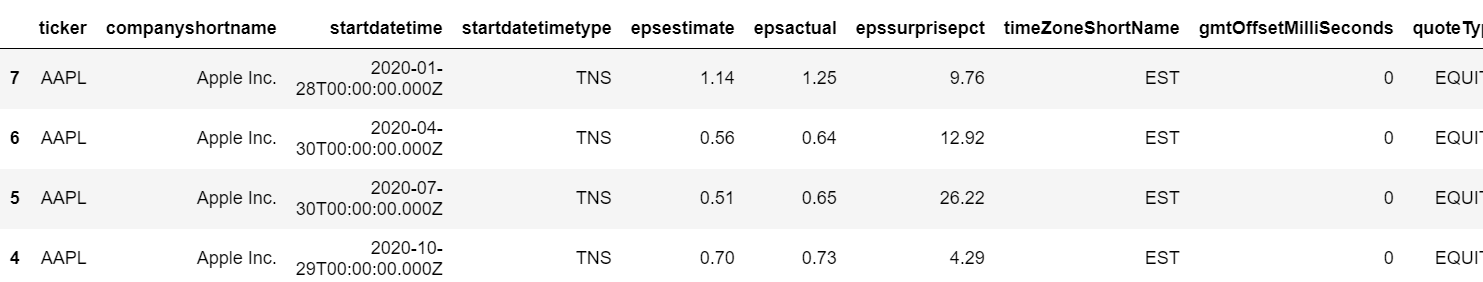
Get all the available earnings data of a specific symbol
The output is as follows:
Suggested Reads
Twitter Data
Twitter data or tweets are an invaluable source of information for analysis.
Twitter’s API is famously well documented, making it a great place to get started creating your own datasets.
Twitter has two kinds of API’s: a RESTful API and a Stream API. If you want to analyse tweets real-time then Stream API should be used. Any update on Twitter will instantly be reflected on your application as well.
To use the Twitter API, we need to follow these steps:
- We first need a Twitter Developer Account, here.
- We then need to create a new app; fill in the required fields. (If you don’t have a website, you can use a placeholder.)
- Click the keys and tokens tab and create an access token and access token secret key. (The consumer and consumer secret key should already be visible.)
We use the python package tweepy which makes our life easier to handle with the Twitter API and its OAuth authentication process. We can get tweets for a specific user, tweets on a certain topic, trending topics, etc.
Do not forget to replace the keys with your fresh keys you just created.
Other alternatives to the tweepy library are NodeXL, Sifter by Texifer, Podargos, ExportTweet and DiscoverTest.
Suggested reads
- Application of Sentiment Analysis in Trading: Where it works?
- Quantitative Trading Using Sentiment Analysis
Financial News Data
Did you know that 30% of financial headlines fit a specific pattern?
We can use financial news data filtered on a specific company, person, group of companies, sector, topic, asset class or location.
The idea is to perform a sentiment analysis on the retrieved data and create trading signals accordingly.
When I did my research I was very impressed by financial news provider CityFalcon, but they didn’t have a free plan, so I eventually decided to go with the News API.
As always, we have chosen a provider for which there is a handy python package wrapper for its API.
You can create a free account and get your API key here.
As a quick example, we retrieve the top headlines and all articles in a time window (01/12/2020-07/12/2020) mentioning bitcoin. You can also see we can define our sources and domains to get news data from specific news providing sites.
The output is as follows:

Other Financial news providers with an API are:
- Wallmine
- CityFalcon
- IEX
- Google News
- Bloomberg
- Bitvore
- Stocknews API
Suggested reads
- Methodology of Quantifying News for Automated Trading
- Quantified News Analytics: Profitability vs Pitfalls
Sentiment Data
The final goal, after retrieving tweets and/or news data is to calculate the sentiment of each article/tweet so we can create trade signals from them.
During my research, I really liked Sentdex. This API allows you to download sentiment data for a wide variety of financial instruments. The data is available at one minute or one day granularity. They even offer trade signals and have an easy to use REST API which you can consume with a python library like requests.
Unfortunately, they only have a paid service.
Because I didn't find any good alternatives to Sentdex, I opted to do our sentiment analysis ourselves with the great NLTK python package (Natural Language Toolkit).
It is already installed if you are using the google colab environment, we only need to download the lexicon (list of words with a positive, neutral or negative rating) for the Vader Sentiment Analyzer. The blog on VADER Sentiment analysis gives you a detailed walkthrough on how twitter data can be used for trading in the stock markets.
Suggested reads
- Sentiment Trading Strategy and Indicators – Part 1
- Sentiment Trading Indicators and Strategy – Part 2
Conclusion
There are many quants who do not rely on price data alone and instead augment their trading strategies with other data such as Fundamentals, Macroeconomic Data, Financial News Data, Tweets and Sentiment Data. This leads to a more robust trading strategy with a minimisation in risk. You have seen how to retrieve these types of data from multiple sources in this article. You can go through the Trading Strategies with News and Tweets course to know more on how to use alternate data to trade.
Download Data File
- Fundamental and sentiment analysis with different data sources.ipynb
Disclaimer: All data and information provided in this article are for informational purposes only. QuantInsti® makes no representations as to accuracy, completeness, currentness, suitability, or validity of any information in this article and will not be liable for any errors, omissions, or delays in this information or any losses, injuries, or damages arising from its display or use. All information is provided on an as-is basis.