
By Rekhit Pachanekar and Chainika Thakar
In order to assess the strength of the market, Richard W. Arms, Jr. invented the TRIN index in 1967, and it is used for measuring the relationship between market supply and demand. The TRIN index is successfully used to find out the market sentiment. Moreover, future price movements are indicated by TRIN since it generates overbought and oversold levels to find out when the price index may change direction.
Based on the value of TRIN, a trader can find out if there is an upward or downward trend in the market and can make decisions to trade accordingly. TRIN can be calculated in Python in an efficient manner. We will use TRIN along with bollinger bands to create a trading strategy which generates signals of buy and sell according to the crossover of these indicators. We use the S&P500, DJI and NASDAQ-100 price data in this strategy and find that it generates a decent return with low maximum drawdowns. This will be beneficial for traders who prefer low risk.
Table of contents:
- What is the arms index or TRIN?
- Formula of TRIN
- How to read data from arms index or TRIN?
- Example of TRIN
- Calculation of TRIN in Python
- Description of TRIN Strategy with Bollinger bands
- Specification of the Investment Universe
- Performance of the Strategy
- Risks in TRIN
- Conclusion
- References
What is the Arms Index or TRIN?
The arms index or trading index (TRIN) is a technical indicator - with a thorough knowledge of which, you can mitigate some unwanted events.
This technical indicator helps measure the strength of the internal market. TRIN compares the number of advancing and declining stocks to the advancing and declining volume. We will discuss the ratio of TRIN properly later in the article. Richard W. Arms, Jr. invented the TRIN index in 1967, and it is used for measuring the relationship between market supply and demand. Hence, the TRIN index is successfully used to find out the market sentiment. Moreover, future price movements are indicated by TRIN since it generates overbought and oversold levels to find out when the price index may change direction.
This short video helps you learn about TRIN, which is one of the commonly used market breadth sentiment indicators starting with understanding a few terms which will be used to define TRIN, followed by other key concepts.
Let us now find out the formula of TRIN.
Formula of TRIN
TRIN or arms index is a short-term tool for indicating the trading situation of the stock market. Based on the value of TRIN, a trader can find out if there is an upward or downward trend in the market and then the trader can make decisions on the basis of predicted direction.
We will take a look at the formula and discuss how we can do that.
TRIN = Advancing stocks/Declining stocks divided by Advancing volume/Declining volume
Here:
Advancing stocks = Number of stocks that are traded higher on the day
Declining stocks = Number of stocks that are traded lower on the day
Advancing volume = Total volume of all advancing stocks
Declining volume = Total volume of all declining stocks
The formula shows that TRIN discusses the relationship between the advancing and declining stocks by measuring their quantity and volume.
A rising TRIN value simply indicates a weak market with a bearish trend, whereas a falling TRIN indicates a strong market or a bullish trend.
Moving forward, we will find out the method to read the data from the arms index or TRIN for bringing it into practical use.
How to Read Data From Arms Index or TRIN?
To read the data from the arms index or TRIN, you simply need to find out if the TRIN index is above 1.0 or below 1.0. Hence, there are two cases:
- In case of a strong upward trend in the market, or in case of a bullish market, the TRIN will be below 1.0.
- On the contrary, in case of a strong downtrend or a bearish market, TRIN will appear to be above 1.0.
Apart from the mentioned two levels, there are also some cases where there are high readings on the index. These high readings are the extreme levels which are usually an indicator of a reversal to happen soon.
For instance, if TRIN shows the reading 2.0 or 3.0, it is an extreme value, which is an indicator that the market has formed a short term bottom. Similarly, if the value becomes 0.5, it indicates an uptrend in the market for only a short while.
So it is advised that the trader waits for a price to be confirmed. Once the price is confirmed, the trader can act on it accordingly so that there is no unexpected loss.
That is all on reading the data from TRIN so that you know how to act on the reading. Let us now take a look at the example of TRIN.
Example of TRIN
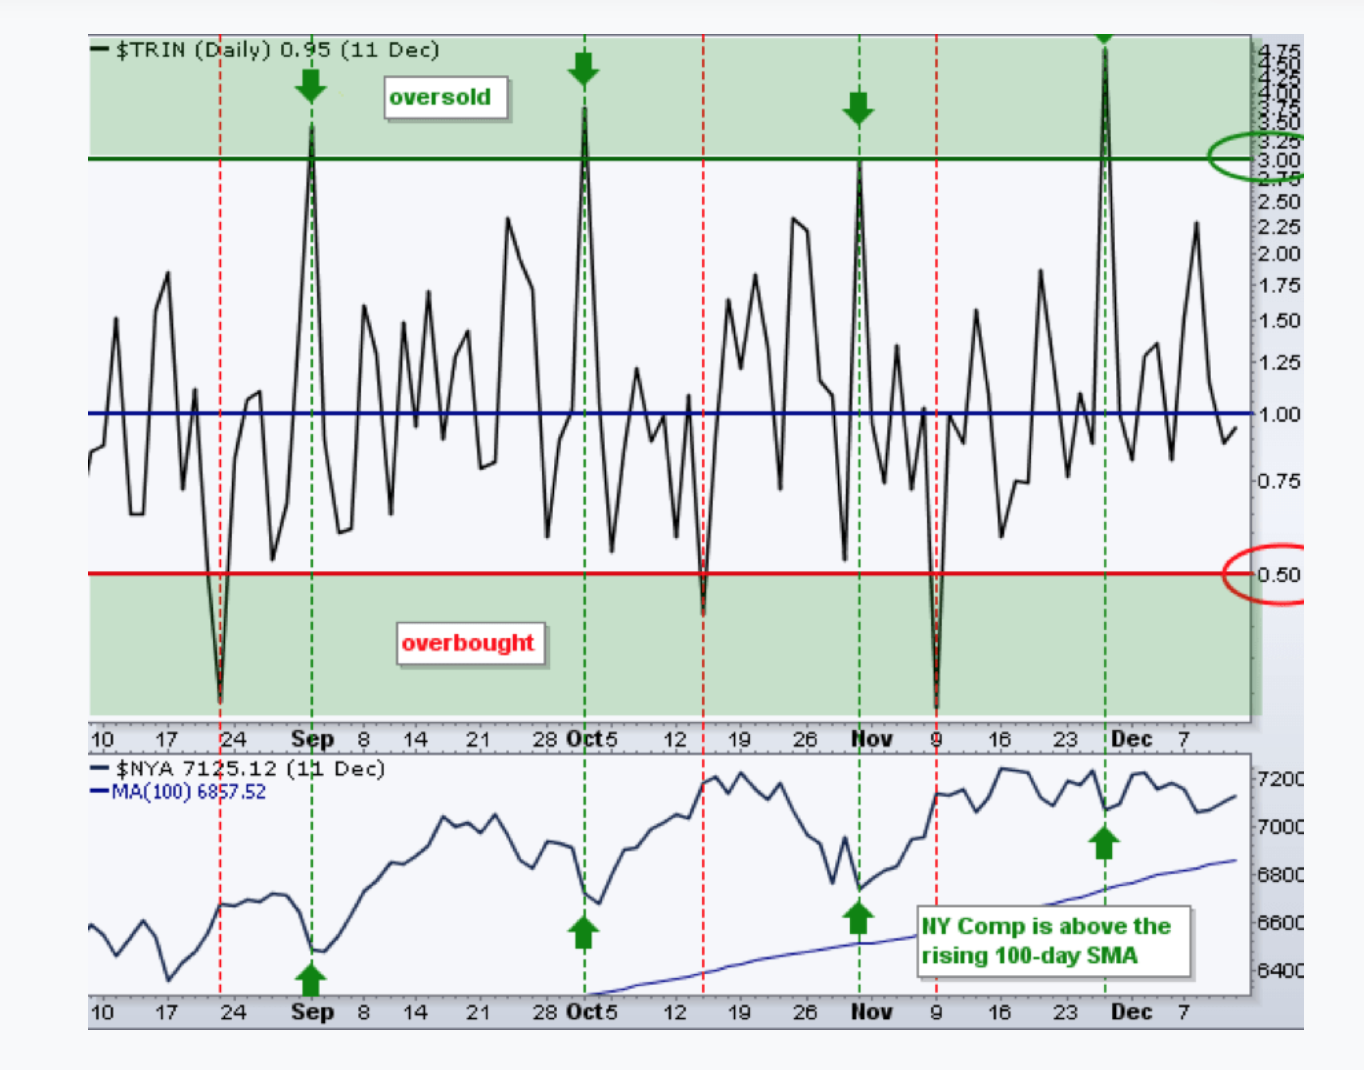
According to the example above, a rising TRIN indicates a bearish market, whereas a falling TRIN indicates a bullish market. The example above shows that the traders who bought in the market when the TRIN value was above 3.00 fared well because it was an oversold situation. The traders in the oversold situation must have got the benefit from a rise in the supply of stocks when they bought. Also, the traders who sold in the market based on values below 0.50 in which there was an overbought condition, must not have had a profitable time.
The SMA or moving average smooths the data series and makes it come into a range that is needed to generate an overbought or oversold signal or value in the market.
We will now find out the calculation of TRIN value with the help of Python codes. To learn and implement other such sentiment indicators, for example VIX, Put-call ratio, check out this course on "Trading using Options Sentiment Indicators" by Quantra. It is a 5 hours course which help you learn Python in a step by step fashion and implement your trading ideas on real market data.
Calculation of TRIN in Python
Let us see how to calculate the TRIN value with Python to analyse the condition of the market. Although if you wish, you can learn more with our blog article on building technical indicators in Python. If you wish to learn more about using technical indicators for trading strategies, you must enrol into our course on Technical Indicators Python.
Coming to this calculation for TRIN value, we will first fetch the data of price and volume for the stocks. We have taken S&P500 stocks for our calculation with python code.
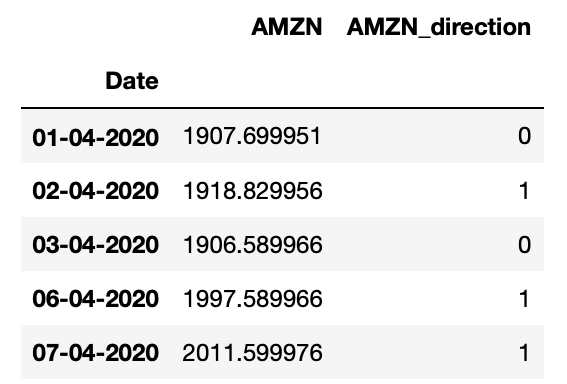
Now, we will find out if today’s close price is higher than yesterday's close price or not. If today’s close price is higher than the previous close price, the output will show “1” and if otherwise, then the output will be “o” for the particular day. We will print this direction for one stock, that is, Amazon (AMZN) so as to see our output.
Output:
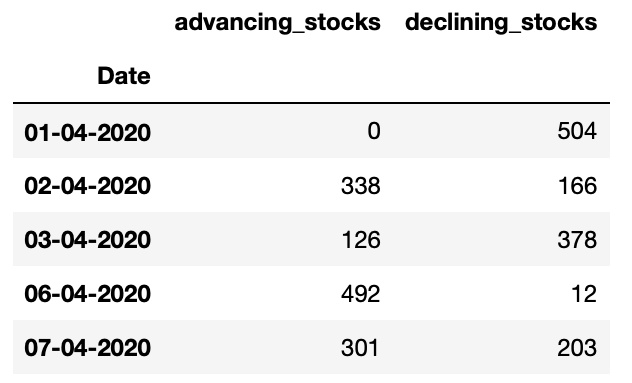
Next, we will find out the number of advancing stocks (ones which ended in green) and the number of declining stocks (ones which ended in red) from the previous day.
Output:
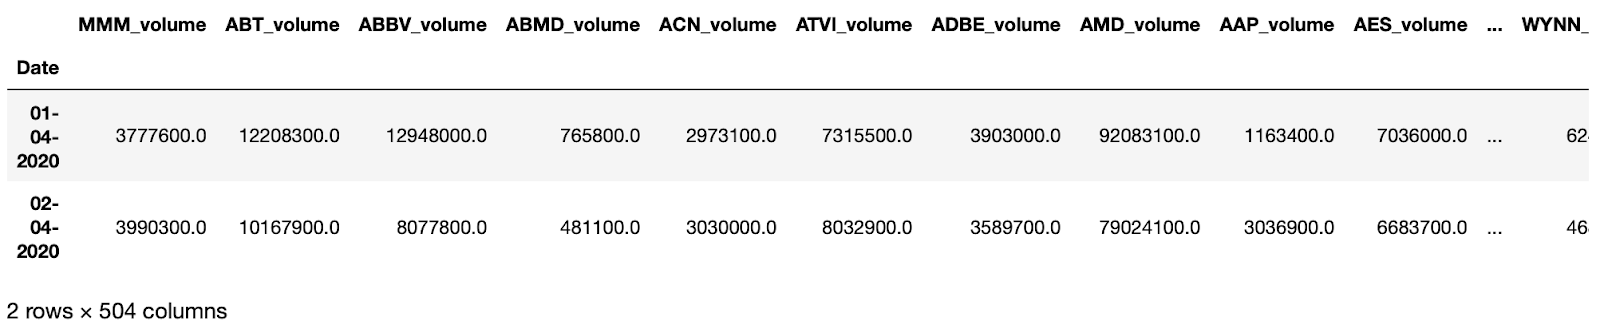
Now, we will generate the sum of the volume of the stocks ended in positive and negative from the previous day since this is required to calculate AD volume.
Output:
Further, we will find out advancing and declining stocks and advancing and declining volume of stocks. Then, finally, we will calculate the TRIN value.
Output:
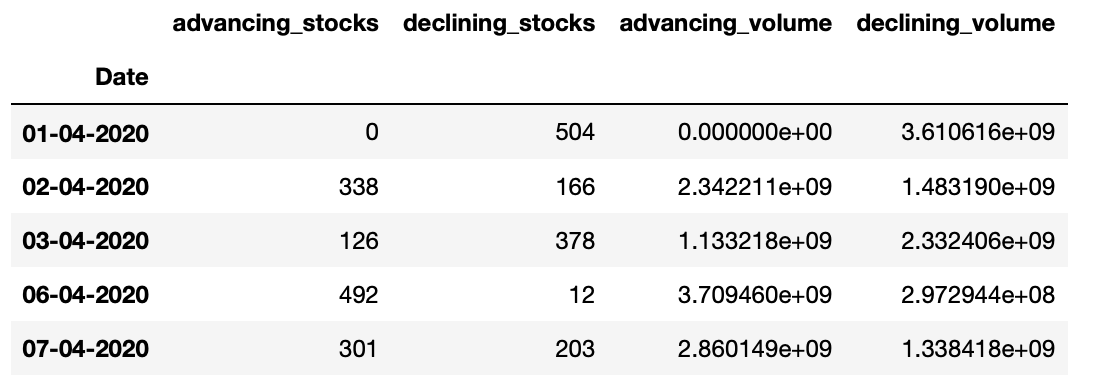
Output:
Date
01-04-2020 NaN
02-04-2020 1.289376
03-04-2020 0.686072
06-04-2020 3.285942
07-04-2020 0.693863
Name: TRIN, dtype: float64
Now, we will plot a graph to find out the TRIN value for S&P500. We will see where the TRIN value lies for different dates for S&P500 stocks.
Output:
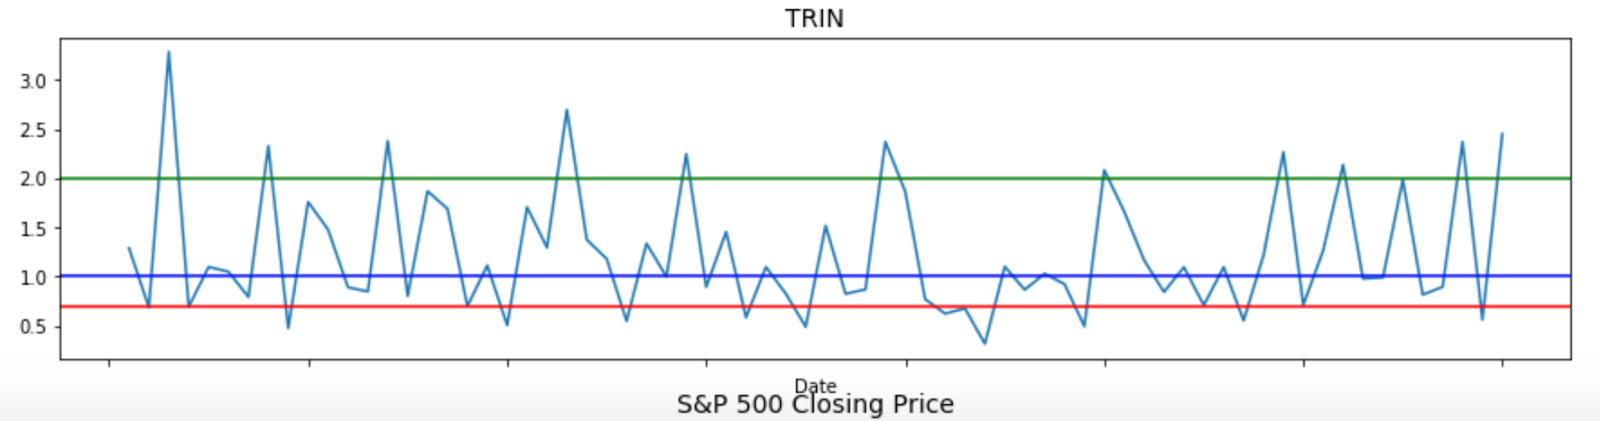
The trend shown at value 1.0 indicates a neutral market situation by a blue horizontal line. Anything slightly below or above 1.0 also indicates neutral market but extreme levels show that there should be a reversal happening soon in the market. At 2.0 the green line indicates a strong downtrend or the bearish situation in the market. Also, at 0.7 the value shows much closer to the neutral market scenario and thus, no reversal is expected.
TRIN helps us understand the overall sentiment of the market. If you are interested in applying sentiment analysis in your trading, you can check the Sentiment Analysis in Trading learning track which uses machine learning to quantify human sentiments. This will give you another perspective in formulating your trading strategy.
Let us now take a look at the TRIN strategy with bollinger bands.
Description of TRIN Strategy With Bollinger Bands
Bollinger bands
Bollinger bands is a volatility or standard deviation based oscillator which comprises of three components. The middle band is a moving average line and the other two bands are a predetermined, usually two, standard deviations away from the moving average line. As the volatility of the stock prices changes, the gap between the bands also changes. During more volatile markets the gap widens and amid low volatility conditions, the gap contracts.
Bollinger bands involve the following calculations:
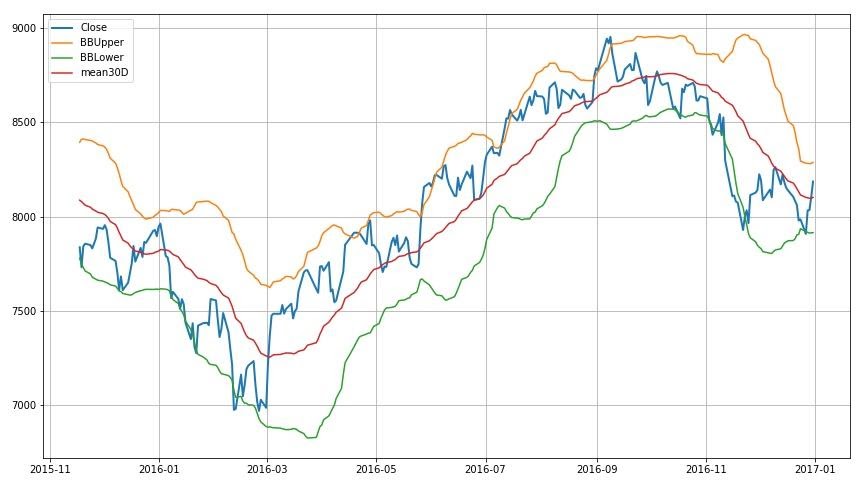
- Middle Band: 30 Day moving average (mean)
- Upper Band: Middle Band + 2 x 30 Day Moving Standard Deviation
- Lower Band: Middle Band – 2 x 30 Day Moving Standard Deviation
To provide an instance, we have shown how the graph looks with bollinger bands. In the graph, you can see the Upper Band is mentioned as BB Upper, Lower Band is mentioned as BB Lower and the mean of 30 days as mean 30D:
TRIN strategy with bollinger bands
This strategy is explained in detail in our course on Trading using Options Sentiment Indicators.
We will discuss the strategy briefly in this section.
- In the strategy of TRIN with bollinger bands, first of all we calculate the standard deviation of the moving average of TRIN with, say, n period = 22 days.
- Next, we will construct Bollinger bands. An Upper Bollinger Band would be ‘k’ times the sigma (standard deviation) away from bollinger bands. This implies that it is ‘k’ times the ‘n’ period standard deviation above the moving average (i.e. SMA + kσ), where we have taken k = 1.5.
- Similarly, the Lower Bollinger Band would be (SMA - kσ). You can optimize these parameters based on backtesting results to fit your strategy.
- Upper Stop Bollinger (USB) band and Lower Stop Bollinger (LSB) band are the two stop loss conditions to limit losses and exit trades before losing a lot of money.
- The first is when the value of TRIN goes beyond 2σ above the UBB, this limit will be Upper Stop Bollinger Band (USB). Since we were expecting TRIN to revert back to the mean when we bought the security, but a move on the opposite side (further upwards) shows that we were wrong, hence it is important to close the position before it’s too late.
- Then, stop loss condition will occur when the value of TRIN goes beyond 2σ below the LBB, and crosses the Lower Stop Bollinger band (LSB), we buy and close our open sell position.
Below you can see how the graph looks when we put forth TRIN strategy with Bollinger Bands. The black line in the graph represents daily TRIN value:
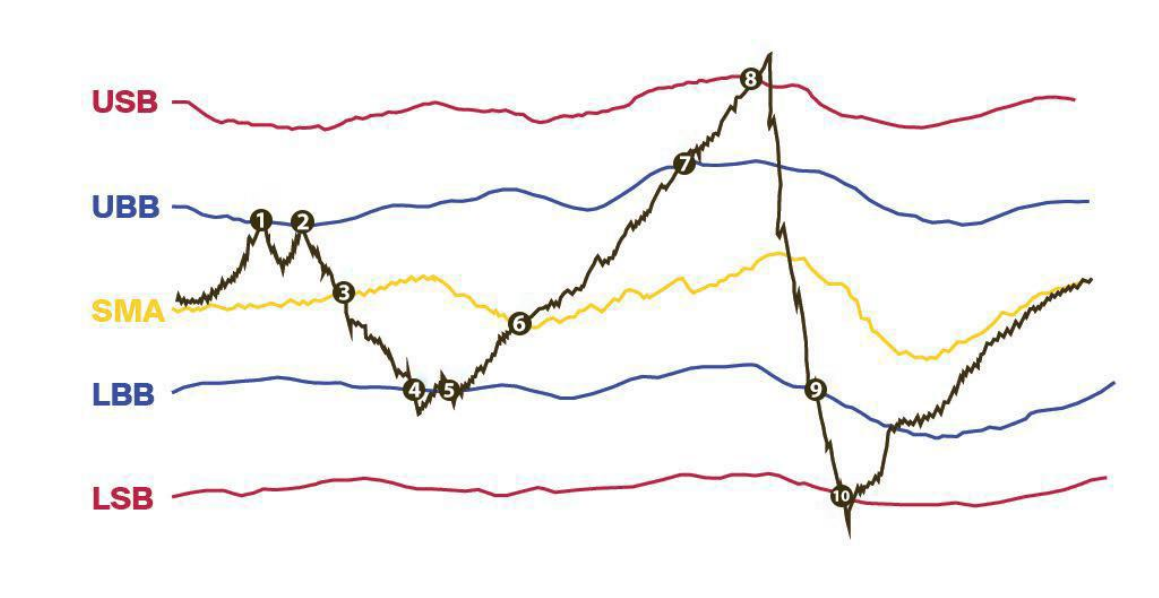
So the graph explains the following:
- When TRIN crosses the UBB, we BUY and take a new position (open position)
- TRIN crosses the UBB here too, but we will not take a new position since we already have an open BUY position
- Here TRIN reverts back from the UBB to moving average. We sell and take profit to close the trade
- When TRIN crosses the LBB, we sell and take a new position (open position)
- Here TRIN crosses the LBB, but we will not take a new sell position since we have not closed the previous SELL position
- Here TRIN reverts back from LBB to moving average. We buy and take profit to close the trade.
- When TRIN crosses the UBB, we buy and take a new position (open position)
- Here after an open buy position, TRIN crosses the USB. We sell and book a loss
- When TRIN crosses the LBB, we sell and take a new position (open position). You can initiate a short using this signal, but we found little merit in applying this for indices as they are generally upward drifting
- Here after an open sell position, TRIN crosses the LSB. We BUY and book a loss
Specification of the Investment Universe
We are using the OHLCV of SP500, DJI and NASDAQ100 data from the years 1995 to 2020 to build a equally weighted portfolio for our strategy. We have taken data from quandl python api for indices and Advance decline ratio.
The total number of months in the backtest is 303. You can use other indexes as well, such as SMI, FTSE, NKY, ES50 etc.
Performance of the Strategy
The cumulative returns of the strategy are shown below.

Along with the cumulative returns, the other measures of performance are given below.
| Annual return | 6.50% |
| Cumulative returns | 390.50% |
| Annual volatility | 10.30% |
| Sharpe ratio | 0.66 |
| Calmar ratio | 0.39 |
| Stability | 0.97 |
| Max drawdown | -16.50% |
| Omega ratio | 1.3 |
| Sortino ratio | 1.01 |
| Skew | NaN |
| Kurtosis | NaN |
| Tail ratio | 1.42 |
| Daily value at risk | -1.30% |
This is the performance of a long-only strategy. You can see that while the cumulative returns is decent at 390%, the max drawdown stays at 16%. Thus, the risk to reward ratio will be attractive for a lot of traders, including risk averse traders.
We have also calculated the rolling Sharpe ratio which is shown below:

Upper Stop Bollinger (USB) band and Lower Stop Bollinger (LSB) band are the two stop loss conditions to limit losses and exit trades before losing a lot of money.
Applying stop-loss at a pre-determined level would help us extract more returns from this strategy.
Let us find out how the maximum drawdown plot looks like.

The drawdown plot gives us an interesting insight on our performance. It shows that major drawdown was seen in 2001, 2008, which coincide with the times of major recessions in the world. Limiting the losses by applying a stop-loss in these periods can definitely enhance the strategy further.
Let us move forward and see the pros and cons of arms index or TRIN.
Risks in TRIN
Using an arms index, or TRIN can result in inaccuracy associated with the volume of stocks which are considered while calculating the value.
These inaccuracies arise when the expected advancing in volume goes above the actual advancing.
For instance, you may see that there is an extremely bullish trend occurring in the market and TRIN indicates a neutral value, and it may not be accurate enough to help understand the right scenario in the market.
In order to solve this problem, it would be a good idea to separate the components of indicators. Separating the components implies that you can calculate the number of stocks and volume of stocks separately instead of keeping them both in the same equation.
This way, for instance, the number of advancing stocks divided by the number of declining stocks will show one trend. And, the volume of advancing stocks divided by the volume of declining stocks will show another trend.
Both the ratios can help reveal the market’s practical situation, on the basis of which one can take trading decisions.
Conclusion
In the article, we discussed the basic but essential aspects of TRIN or arms index. And covered everything you may need to know about this short-term indicator. Its brief yet informative value helps a trader learn about the market’s situation and helps them act accordingly.
We found out that in case of a strong upward trend in the market, or in case of a bullish market, the TRIN will be below 1.0.
On the contrary, in case of a strong downtrend or a bearish market, TRIN will appear to be above 1.0.
Also, we implemented the TRIN strategy with Bollinger bands and its graphical representation. We saw that the TRIN strategy applied on the DJI, S&P500 and NASDAQ100 indices gave us a decent cumulative return of 390% with a maximum drawdown of 16%. You can extend the strategy to include other indices such as Nikkei index, NSE Nifty, LSE FTSE index so that your portfolio is diversified across geographical regions. You can also create a multi asset portfolio by including index futures as well.
References
Richard Arms (1996). The Arms Index (Trin Index): An Introduction to Volume Analysis. Marketplace Books
All about Market Indicators" Michael Sincere, 2011, p.41, [ISBN: 978-0-07-175043-1] [14] "Market Breadth Indicators" Gregory L Morris, 2015
A helping hand from the Arms Index", James Alphier & Bill Kuhn, 1987, Vol 5:4 (142:143) Stocks & Commodities
Files in the Download
- Trading Index (TRIN) Blog by QuantInsti - pdf file
All investments and trading in the stock market involve risk. Any decisions to place trades in the financial markets, including trading in stock or options or other financial instruments is a personal decision that should only be made after thorough research, including a personal risk and financial assessment and the engagement of professional assistance to the extent you believe necessary. The trading strategies or related information mentioned in this article is for informational purposes only.
