Navigate the intriguing landscape of options trading with a specific focus on covered calls – a potent tool in the hands of traders. Options trading can be perceived as a complex concept, often deterring newcomers from delving deeper. However, with the right knowledge the concept will be much simpler to understand.
In this blog, you will learn the fundamentals of covered call strategies, offering insights that are both practical and accessible. We will also be discussing the covered call strategy in Python to help you with visualising the strategy graph with the Python code.
Throughout this journey, we'll emphasise practicality without sacrificing depth, ensuring that each concept is comprehensible. Whether you're a novice seeking to expand your trading horizons or a seasoned trader aiming to refine your strategies, this blog will provide you with valuable insights.
This blog covers:
- Overview of options trading
- What is the covered call strategy?
- Example of covered call strategy
- When to use a covered call strategy?
- Covered call strategy variations
- Importance of covered call strategy in investment portfolios
- Real-world example of covered call strategy with AAPL
- Step-by-step guide to implementing covered call strategy in Python
- Risk management techniques specific to covered call strategy
Overview of options trading
Options trading involves the contracts granting the right, but not obligation, to buy or sell an asset at a set price within a timeframe. There are two types of options, that is the call options and the put options.
Call option implies the right (not the obligation) of the holder of this option to buy an underlying or a stock at a predetermined price on the predetermined date of expiry.
Put option implies the right (not the obligation) of the holder of this option to sell an underlying or a stock at a predetermined price on the predetermined date of expiry.
Other key elements of options trading are "long" and "short" which refer to the positions taken by traders in the options market.
Long Option: When a trader takes a "long" position in options, it means they are buying option(s) contract(s) (Long call and/or Put call) for a certain premium.
It implies going for either or both mentioned below.
- Long Call: Right to buy the underlying asset
- Long Put: Right to sell the underlying asset
Short Option: Conversely, when a trader takes a "short" position in options, it means they are selling options contracts for a certain premium.
It implies going for either or both mentioned below.
- Short Call: Obligation to sell the underlying asset
- Short Put: Obligation to buy the underlying asset
To trade options, traders select a strategy based on their outlook, analyse market trends, then choose appropriate strike prices and expiration dates, and execute trades through brokerage platforms with knowledge of market dynamics and risk management.
Strategies in options trading include buying/selling options, spreads, straddles, and strangles.
Example
Let's say you believe that the price of Company XYZ's stock, currently trading at $50 per share, will rise in the next month. Instead of buying the stock outright, you decide to purchase a call option contract for Company XYZ with a strike price of $55 and an expiration date one month from now.
Here is the breakdown of the strategy in our example:
- What: You buy a call option contract for company XYZ.
- Why: You expect the price of company XYZ's stock to increase.
- How: By purchasing the call option, you pay a premium (let's say $2 per share, so $200 for one contract, where the lot size of one contract is 100 shares). This gives you the right, but not the obligation, to buy 100 shares of Company XYZ at the strike price of $55 per share, anytime before the expiration date.
If the price of company XYZ's stock rises above $55 within the next month, your call option maximises returns. For instance, if the stock rises to $60 per share, you could exercise your option, buy the shares at $55 each, and then sell them at the market price of $60, making a gain of $5 per share (minus the premium paid for the option). If the stock price doesn't rise above $55 by the expiration date, you can let the option expire worthless, losing only the premium paid.
Going forward, let us find out what is the covered call strategy.
What is the covered call strategy?
The covered call strategy involves owning the underlying asset (such as stocks) and selling call options against those assets. Here's how it works:
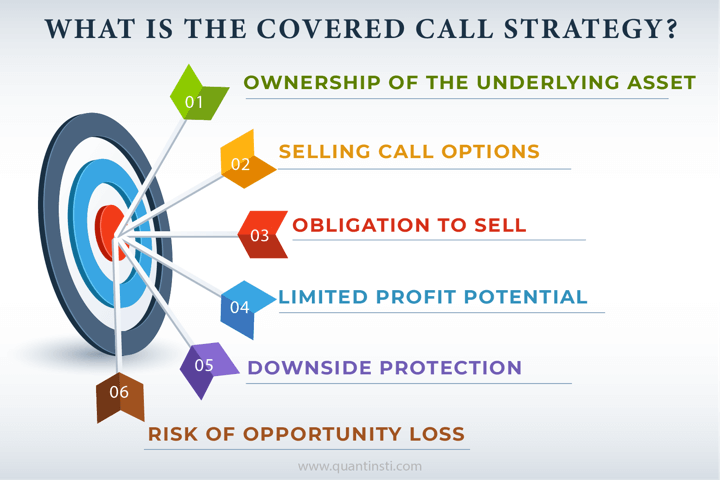
- Ownership of the Underlying Asset: Firstly, the investor owns shares of a particular stock. Each option contract typically covers 100 shares of the underlying asset.
- Selling Call Options: The investor then sells call options on the same stock they own. By selling the call options, the investor collects a premium from the buyers of the options.
- Obligation to Sell: When selling a call option, the investor agrees to sell their shares of the underlying stock at the specified strike price if the option is exercised by the buyer before or at expiration.
- Limited Profit Potential: The profit potential of the covered call strategy is limited to the premium received from selling the call option. If the stock price remains below the strike price of the option, the option will typically expire worthless, and the investor keeps the premium as profit.
- Downside Protection: The premium received from selling the call option provides some downside protection for the investor. It reduces the effective purchase price of the underlying stock, providing a cushion against potential losses if the stock price decreases.
- Risk of Opportunity Loss: However, if the stock price rises above the strike price of the call option, the investor may be obligated to sell their shares at the strike price, missing out on potential gains if the stock price continues to rise significantly.
The covered call strategy is popular among investors who are neutral to slightly bullish on the stock's short-term prospects and want to generate additional income from their stock holdings while potentially reducing the effective purchase price of the shares.
Let us understand the concept of covered call strategy with an example to add more clarity.
Example of Covered Call Strategy
Let us learn about the covered call strategy with an example. Assume that the SBI stock is trading at Rs.189 on April 29th, 2023.
Now, as per the covered call strategy, you will take two positions mentioned below.
Leg 1: Buy 100 shares of the stock for Rs.189
Leg 2: Sell the call option for a 195 strike price with the expiration date of May. 26th, 2023. The premium of the call option received will be Rs.6.30, and Lot size of100 shares.
The amount paid to take these two positions equals - the Stock price paid minus the call premium received, i.e. Rs. 18,900 (Stock purchase) – Rs. 630 (Premium received) = Rs. 18,270.
If the stock price rises above the call strike of 195, it will be exercised, and the stock will be sold.
However, in this scenario, the strategy would result in a loss because the call option was sold, which means if the price closes above the strike price, the seller loses the call premium to the buyer.
So, considering the stock price at expiration is Rs. 200, the loss incurred would be:
Loss = Call premium received - ((Stock price at expiration - Call strike) x Number of shares)
Loss = Rs. 630 - ((200 - 195) x 100) = Rs. 630 - (5 x 100) = Rs. 130
If the stock falls below the initial stock purchase price, your long position is at a loss, but you have some cushion from the call premium received by selling the call.
Say, the stock falls and is at Rs. 180 on expiration.
The loss incurred is given by:
Loss = Call premium received + ((stock price at expiration - stock price paid) x Shares)
Loss = Rs. 630 + ((180 – 189) x 100) = - Rs. 270
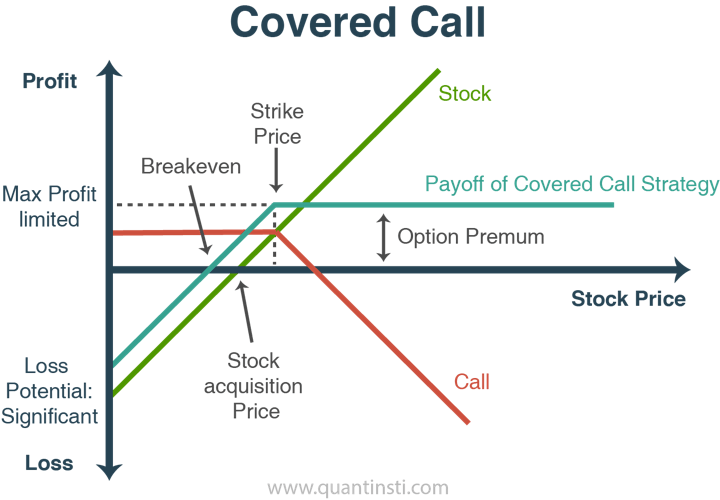
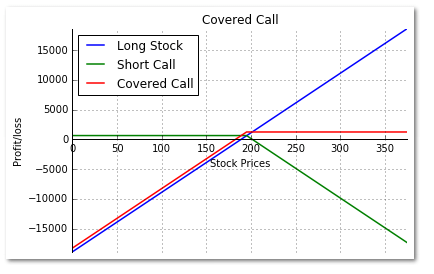
The figure above shows the payoff for a covered call as a combination of the long stock and the short call with a strike price (K).
Example:
Let us assume that a trader is long 1 share of ABC stock worth $20, and sells a call on the same with a strike of $23 for $2.
Case 1: If the stock goes up to $20<=P<$23, the call expires worthless and trader earns a net profit of $2 plus the gain in stock price; which is equal to ($2 + $23 - P). The profit ranges from $2 to $5.
Case 2: If the Stock price goes up to P >= $23, the buyer of the call will exercise the call and buy the stock from a trader for $23; hence the net profit for the trader will be ($23 -$20 + $2) = $5. The profit will be capped at $5.
Case 3: If the stock price goes down to P<$20, then the call option expires worthless, the trader now has $2 and the loss from the stock position is equal to ($2 + P - $20). Profit/Loss range from loss of $18 to gain of $2.
One can employ the covered call strategy by selling calls every month and thus, can generate monthly income by way of premiums.
The Risk-reward profile for covered call is as given below:
- Maximum risk - (Stock price paid - call premium received)
- Maximum reward – (Call strike - the stock price paid) + call premium received
- Breakeven – (Stock price paid - call premium received)
Now that you know all about the basics of the concept of covered call strategy, we will discuss the scenarios in which this strategy should be used.
When to use a covered call strategy?
The covered call strategy is employed in various scenarios, primarily to generate additional income from stock holdings.
By selling call options against shares, investors collect premiums, enhancing overall returns, particularly in low-volatility markets or when stocks are expected to remain stable. This strategy is favoured when investors hold a neutral to slightly bullish outlook on the underlying stock, allowing them to gain from premiums while participating in potential upside price movements.
Moreover, investors use this strategy to monetise overvalued stocks by selling call options at strike prices they consider acceptable. It can be particularly effective in sideways markets, where options premiums may represent a significant portion of potential returns, making it attractive for income generation.
Nevertheless, careful consideration of market conditions, asset volatility, and individual investment objectives is essential before implementing the covered call strategy.
There are a number of popular variations of the covered call strategy which we will discuss next.
Covered call strategy variations
Here are a few most popular variations of the covered call strategy:
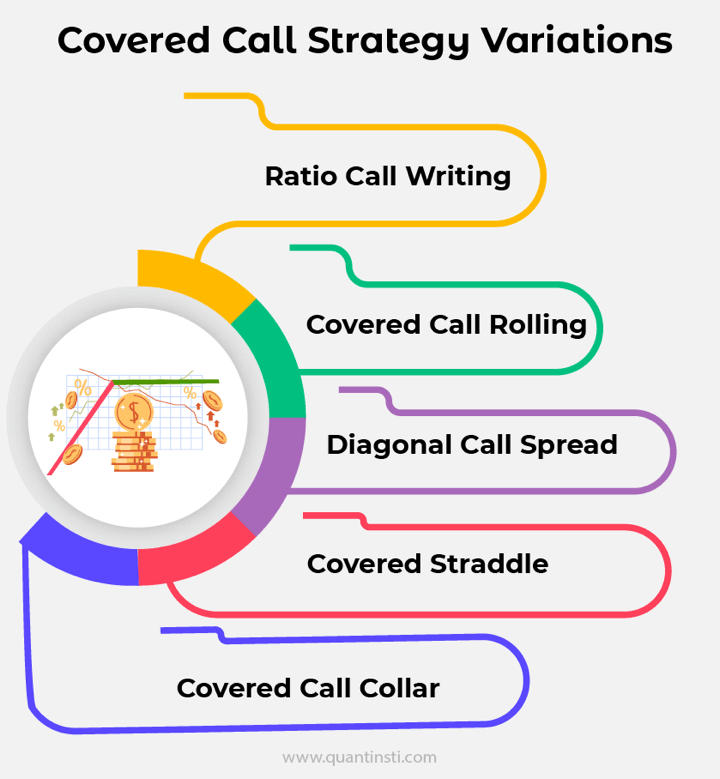
- Ratio Call Writing: In this approach, investors sell more call options than the number of shares they own. For example, they may sell two call options for every 100 shares they hold. This strategy increases income potential but also exposes the investor to greater downside risk if the stock price rises sharply.
- Covered Call Rolling: When the underlying stock's price approaches or exceeds the strike price of the sold call option, investors can buy back the option and sell a new one with a higher strike price and/or a later expiration date. This allows them to capture additional premium income while potentially benefiting from further upside potential.
- Diagonal Call Spread: Investors simultaneously sell a call option with a nearer expiration date and buy a call option with a later expiration date but at a higher strike price. This strategy allows for potential profit from both the premium received and any further price appreciation of the underlying stock.
- Covered Straddle: Instead of selling only call options, investors sell both call and put options against their stock holdings. This strategy generates income from both premiums and can be effective in markets with low volatility.
- Covered Call Collar: Investors combine a covered call with the purchase of a protective put option. This limits potential losses on the underlying stock while still allowing for income generation from selling call options.
These variations offer flexibility in adjusting risk and return profiles based on market conditions, individual preferences, and investment objectives. However, they also entail different levels of complexity and may require careful monitoring and management.
There are some points to note which portray the importance of covered call strategy in the portfolios which we will see next.
Importance of covered call strategy in investment portfolios
The covered call strategy holds significance in investment portfolios for several reasons. Here are a few reasons you should consider covered call strategy for your portfolio:
- Income Generation: It provides a steady stream of income through the premiums received from selling call options against the underlying stock. This income can enhance overall portfolio returns, particularly in low-interest-rate environments.
- Risk Management: Covered calls offer downside protection by reducing the effective purchase price of the underlying stock. The premiums received provide a cushion against potential losses if the stock price declines.
- Enhanced Returns: While capped, the potential profit from covered calls can still outperform traditional buy-and-hold strategies, especially in sideways or slightly bullish markets where stocks may have limited price movement.
- Flexibility: Investors can tailor covered call strategies to their risk tolerance, market outlook, and income needs by adjusting variables such as strike prices, expiration dates, and the number of contracts.
- Portfolio Diversification: Incorporating covered call strategies diversifies portfolio income sources beyond traditional dividends or interest payments, reducing overall portfolio risk.
- Reduced Volatility: By generating income from premiums, covered calls can dampen portfolio volatility, providing a smoother equity curve and potentially attracting risk-averse investors.
Overall, the covered call strategy offers a balanced approach to income generation and risk management, making it a valuable tool for investors seeking to enhance portfolio performance while managing risk effectively.
Now, we will discuss the real world example of the covered call strategy with AAPL stock.
Real-world example of covered call strategy with AAPL
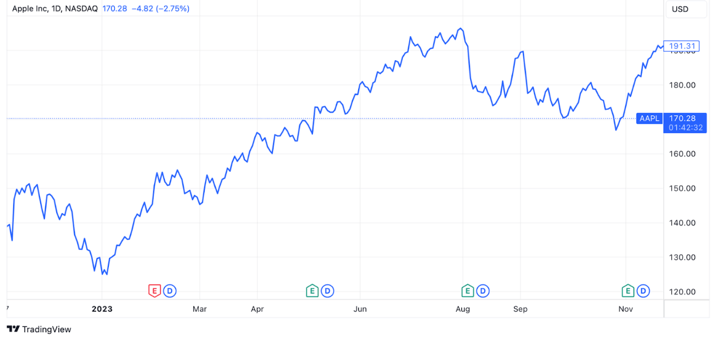
Let us take the example of early AAPL in early 2023. Seeing the historical data below, we can see how the traders might have utilised the covered call strategy.
To enhance this approach, traders can automate trading with TradingView to streamline their covered call execution and capitalize on market movements effectively.
Scenario: In the months from March to June 2023, a trader owned 100 shares of Apple (AAPL) stock, trading between $145 and $180 per share. She believed the stock price would likely remain the same or experience moderate growth in the following months.
Potential Covered Call Strategy: The trader decided to sell covered calls on her AAPL stock with a strike price of $200 and an expiration date six months away. At the time, the premium for this call option was around $5 per share, meaning she would receive $500 for selling the covered call (100 shares * $5 premium).
Result
Looking back at historical data, AAPL's price did indeed stay below $200 for the following six months, that is from June to December 2023. This scenario demonstrates how a covered call strategy could have generated income for the investor while still allowing them to retain ownership of the stock if its price remained stagnant.
Let us see the step by step guide for implementing the covered call strategy in Python.
Step-by-step guide to implementing covered call strategy in Python
Below is the code for the long stock, short call and covered call payoff chart in Python.
We use the matplotlib library to plot the charts. We first create an empty figure and add a subplot to it.
Finally, we add the title, labels, and the legend in the chart.
Output:
Going forward, we will see the risk management techniques specific to the covered call strategy that can help you with maximising gains.
Risk management techniques specific to covered call strategy
Risk management is crucial when implementing a covered call strategy. Here are specific techniques to manage risk:
- Strike Price Selection: Choose strike prices that align with your risk tolerance and market outlook. Selling call options with strike prices significantly above the current stock price may offer higher premiums but also increases the likelihood of loss if the condition holds true and it is exercised.
- Expiration Date Management: Select expiration dates that balance income generation with flexibility. Longer expiration dates typically offer higher premiums but may increase your ability to adjust your strategy in response to changing market conditions.
- Diversification: Diversify your covered call positions across different stocks, sectors, or ETFs to reduce concentration risk. Avoid overexposure to any single stock or sector, which can increase vulnerability to adverse price movements.
- Monitoring and Adjustment: Regularly monitor the performance of your covered call positions and be prepared to make adjustments as needed. If the stock price approaches or exceeds the strike price of the call option, consider rolling the option to a higher strike price or later expiration date to capture additional premium income and potentially mitigate losses.
- Risk-reducing Strategies: Consider implementing risk-reducing strategies such as buying protective puts or collar strategies to hedge against potential downside risk. Protective puts provide insurance against stock price declines, while collar strategies involve simultaneously buying protective puts and selling covered calls to limit both potential losses and gains.
- Position Sizing: Manage the size of your covered call positions relative to your overall portfolio size and risk tolerance. Avoid overcommitting to covered call strategies, especially in volatile markets, to maintain liquidity and flexibility.
- Market Analysis: Conduct a thorough analysis of market trends, volatility levels, and individual stock fundamentals before entering into covered call positions. Stay informed about economic indicators, corporate earnings announcements, and other factors that may impact stock prices and option premiums.
By employing these risk management techniques, investors can effectively mitigate risks associated with covered call strategies and optimise their potential for income generation and capital preservation.
Conclusion
Mastering the covered call strategy in Python offers a powerful toolset for navigating the complexities of options trading. We discussed how traders can utilise the knowledge and skills needed to implement covered calls effectively, from understanding the fundamentals to practical implementation using Python code.
Ultimately, mastering the covered call strategy in Python can open up opportunities for traders to enhance portfolio performance, generate income, and achieve their financial goals. With the right knowledge and tools at your disposal, you can navigate the dynamic landscape of options trading with confidence and precision.
If you wish to learn more about covered call strategy in Python, you can explore the course on Systematic Options Trading. In the world of modern trading, a systematic approach is a need. This course will help you create, backtest, implement, live trade and analyse the performance of options strategy. You will also learn to shortlist options, find the probability of profit, expected profit, and the payoff for any strategy. Moreover, you will be able to explore the options trading strategies like a butterfly, iron condor, and spread strategies. Last but not the least, you can also implement the course learnings in a capstone project.
File in the download
- Covered call strategy in trading - Python notebook
Author: Chainika Thakar (Originally written by Milind Paradkar)
Note: The original post has been revamped on 8th April 2024 for recentness, and accuracy.
Disclaimer: All investments and trading in the stock market involve risk. Any decision to place trades in the financial markets, including trading in stock or options or other financial instruments is a personal decision that should only be made after thorough research, including a personal risk and financial assessment and the engagement of professional assistance to the extent you believe necessary. The trading strategies or related information mentioned in this article is for informational purposes only.