
In this article, we learn how to create a system which can generate buy, sell, and automating orders as per signals generated by an intraday trading strategy based on 200 SMA and 50 EMA.
This article is the final project submitted by the authors as a part of their coursework in the Executive Programme in Algorithmic Trading (EPAT®) at QuantInsti®. Do check our Projects page and have a look at what our students are building.
This blog also provides the complete data files associated with this article in a downloadable format.
About the author
Rajesh Kumar is an EPAT Alumni. He has around 20 years of experience in IT and possesses good programming skills too. Currently, Rajesh is working in an IT firm, and he joined EPAT as he was interested in the stock markets and very much interested in Algorithmic Trading to avoid the emotion part which is an obstacle in the trading for any trader.
Topics covered in this project:
- Aim
- Strategy idea
- Dataset
- Motivation
- Objective
- Modules created
- Backtest program
- Trading Strategy
- Trading program flow
- Backtest Result of Trading Strategy
Aim
Create a system which can generate buy, sell, and automating orders as per signals generated by strategy detailed below. We will use Zerodha for real-time data and placing orders.
Strategy idea
This is an intraday trading strategy based on 200 SMA and 50 EMA. We will make use of 5 Min data. Below is the detail of the strategy:
- Retrieve 5 min data for Nifty.
- Calculate 200 SMA and 50 EMA.
- We’ll take a position for Long as well as Short. When the Long position is initiated, we’ll buy a Call option and when Short is initiated, we buy a PUT option. After performing backtest, I have added an extra 7 points to minimize whipsaws
- Similarly SELL is initiated when Nifty close is below 200 SMA and 50 EMA
- If Nifty close is in between 200 SMA and 50 EMA, then there is NO position.
- Partial profit is booked for 20 points
Note: Module to measure the performance of this strategy will also be created
Dataset
Real-time Nifty 5 min data
Motivation
I have been trading this strategy manually and know that it works. Sometimes, due to emotion I miss some trade or cut down my profits. I would like to automate this strategy so that this can be used as LFT by me.
Objective
Create a trading system which can generate buy, sell signals and automating orders as per signals generated by strategy detailed below.
We will use Zerodha for real-time data and placing orders.
Modules created
As part of this project, the following modules are created
For Backtest
- SMA-200 EMA 50 v2.0
Template program which can be used to backtest any strategy with daily data
- backtestingbase
Generic Module created which can be used in template program to do the calculation when BUY/SELL signals are generated
- check_performance
Generic Module created which can be used in template program to calculate following KPI’s
- Annualized Return
- Last 12 months Return
- Volatility
- Sharpe Ratio
- Maximum Drawdown
- Calmar Ratio (Annualized Return/ Maximum Drawdown)
- Volatility / Maximum Drawdown
- Best Month Performance
- Worst Month Performance
- % of Profitable Months & % Non-Profitable Months
- Number of Profitable Months/Number of Non-Profitable Months
- Average Monthly Profit
- Average Monthly Loss
- Average Monthly Profit/Average Monthly Loss
LIVE Trading program
- Strategy 200 SMA v3.0
A program incorporating my strategy for Live automated trading
Backtest Program for my Strategy
- SMA-200 EMA 50 v1.0
This program was created to test my strategy with 5 min data
5 min csv data from 27th June
- Nifty_5m - Full data
This data was used by my backtesting program SMA-200 EMA 50 v1.0
Backtest program
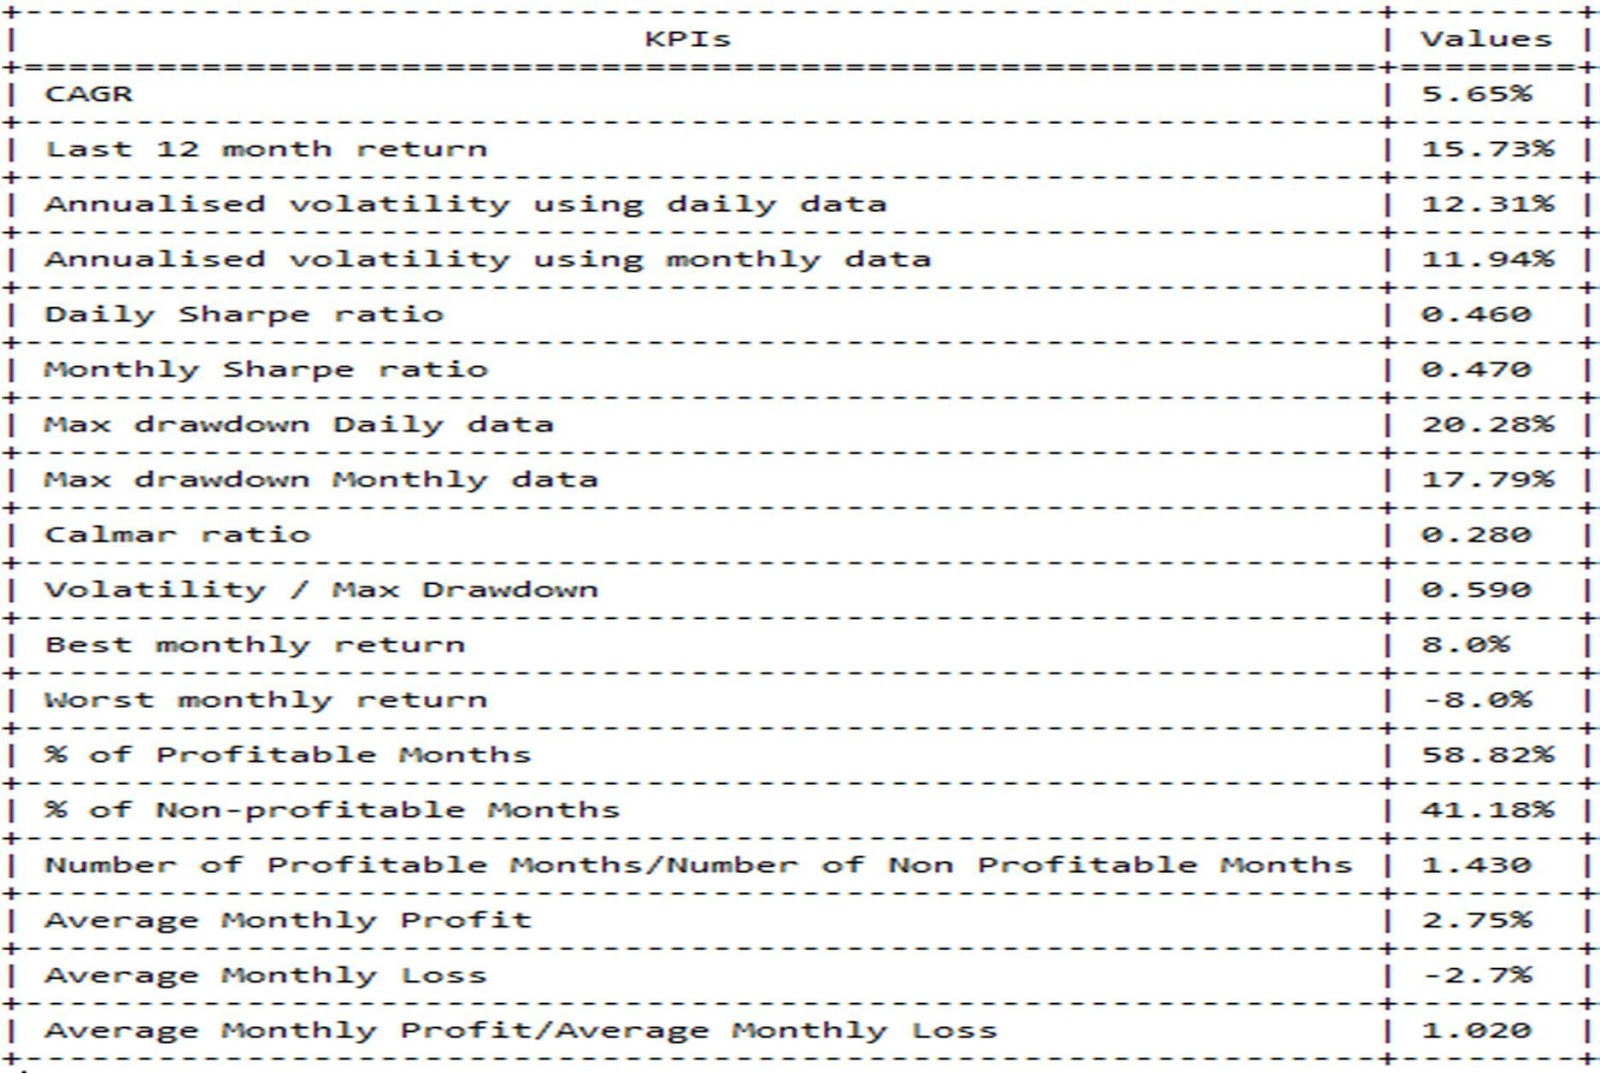
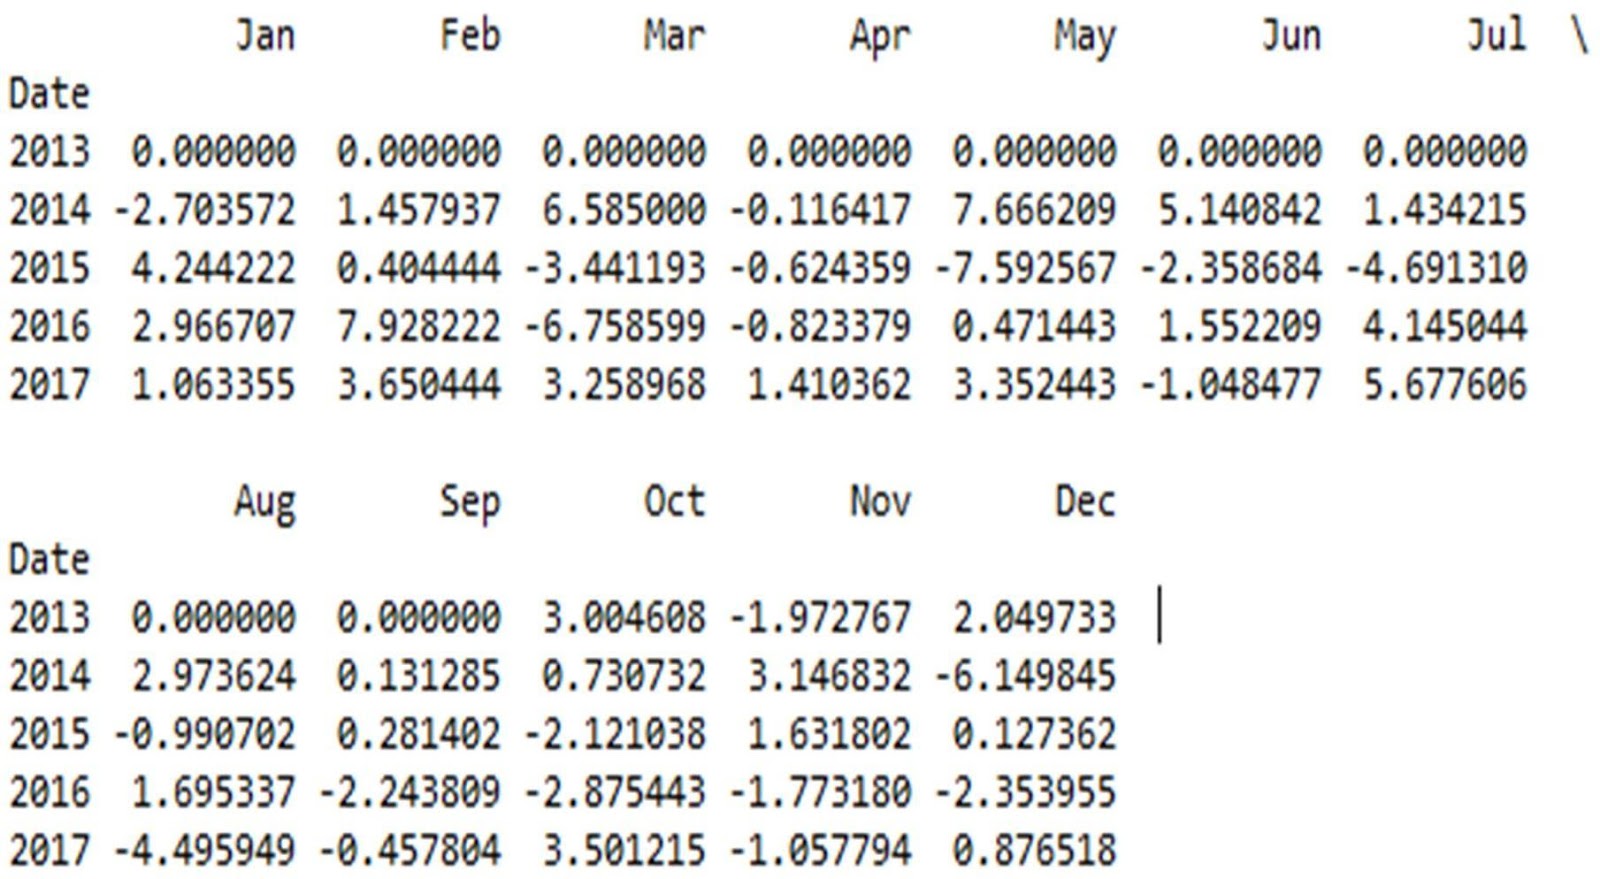
I created 3 generic modules for backtesting. This uses daily data and generates various reports and KPI’s. Below is generated sample by using 5 years daily data for my strategy

- KPIs
Trading Strategy
This is an intraday trading strategy based on 200 SMA and 50 EMA. We will make use of 5 Min data. Below is a detail of strategy:
- Retrieve 5 min data for Nifty.
- Calculate 200 SMA and 50 EMA.
- We’ll take a position for Long as well as Short. When the Long position is initiated, we’ll buy a Call option and when Short is initiated, we buy a PUT option. After performing backtest, I have added an extra 7 points to minimize whipsaws
- Similarly SELL is initiated when Nifty close is below 200 SMA and 50 EMA
- If Nifty close is in between 200 SMA and 50 EMA, then there is NO position.
- Partial profit is booked for 20 points
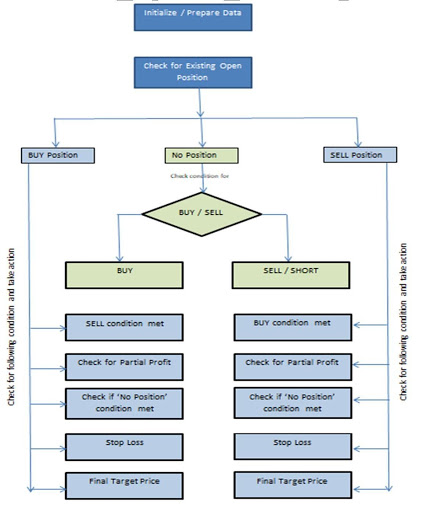
Trading program flow
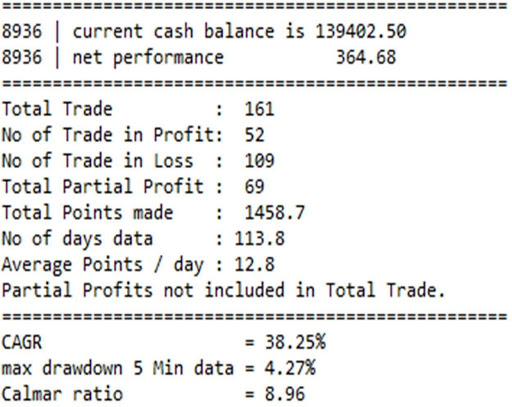
Backtest Result of Trading Strategy
5 min data from June 27th 2017 used for testing.
- Tested this with an initial capital of Rs 30,000.
- buy/sell 2 Lots for Nifty Call/Put.
- Below is performance result
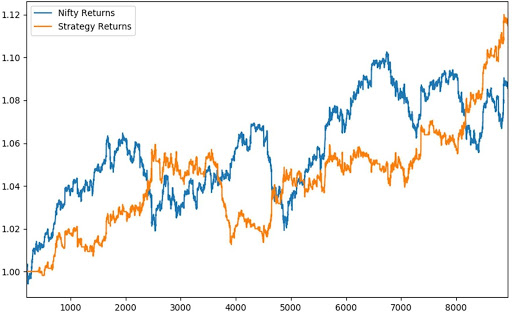
Below is a chart for Nifty Returns vs Strategy Returns
You can read more about Five Indicators To Build Trend-Following Strategies.
Conclusion
In this strategy, 5 mins data from NIFTY was used which gave around 8% returns from June 2017 till the end of 2017, but using this strategy provided a 12% return. The whole idea behind doing this project is to have enough confidence that one can create a generic model which can be used by anybody to perform backtesting to check the performance of their strategy (any strategy). Anyone having a real-time knowledge of trading and python (and if they have their own existing strategy) can use this model, add their data and build their own trading system. They can backtest, check the performance, and they can do trading in real-time.
Our course focuses on teaching the practical aspects of strategy development and backtesting Python frameworks, offering a hands-on approach to building and testing trading systems effectively. Learn to create adaptable models and optimize your strategies for better trading results.
You too can learn various aspects of Algorithmic trading with the Executive Programme in Algorithmic Trading (EPAT). The course covers training modules like Statistics & Econometrics, Financial Computing & Technology, and Algorithmic & Quantitative Trading. EPAT equips you with the required skill sets to build a promising career in algorithmic trading.
Disclaimer: The information in this project is true and complete to the best of our Student’s knowledge. All recommendations are made without guarantee on the part of the student or QuantInsti®. The student and QuantInsti® disclaim any liability in connection with the use of this information. All content provided in this project is for informational purposes only and we do not guarantee that by using the guidance you will derive a certain profit.
Files in the download:
- Data Files
- Python Codes
