By Zach Oakes
A Backtest is not in and of itself a development tool, the goal is not to see how great of an equity curve you can make. A GOOD backtest should refer to how accurately it reflects realtime trading, not how ‘good’ the system looks.
In this blog, we will cover:
Building Backtests
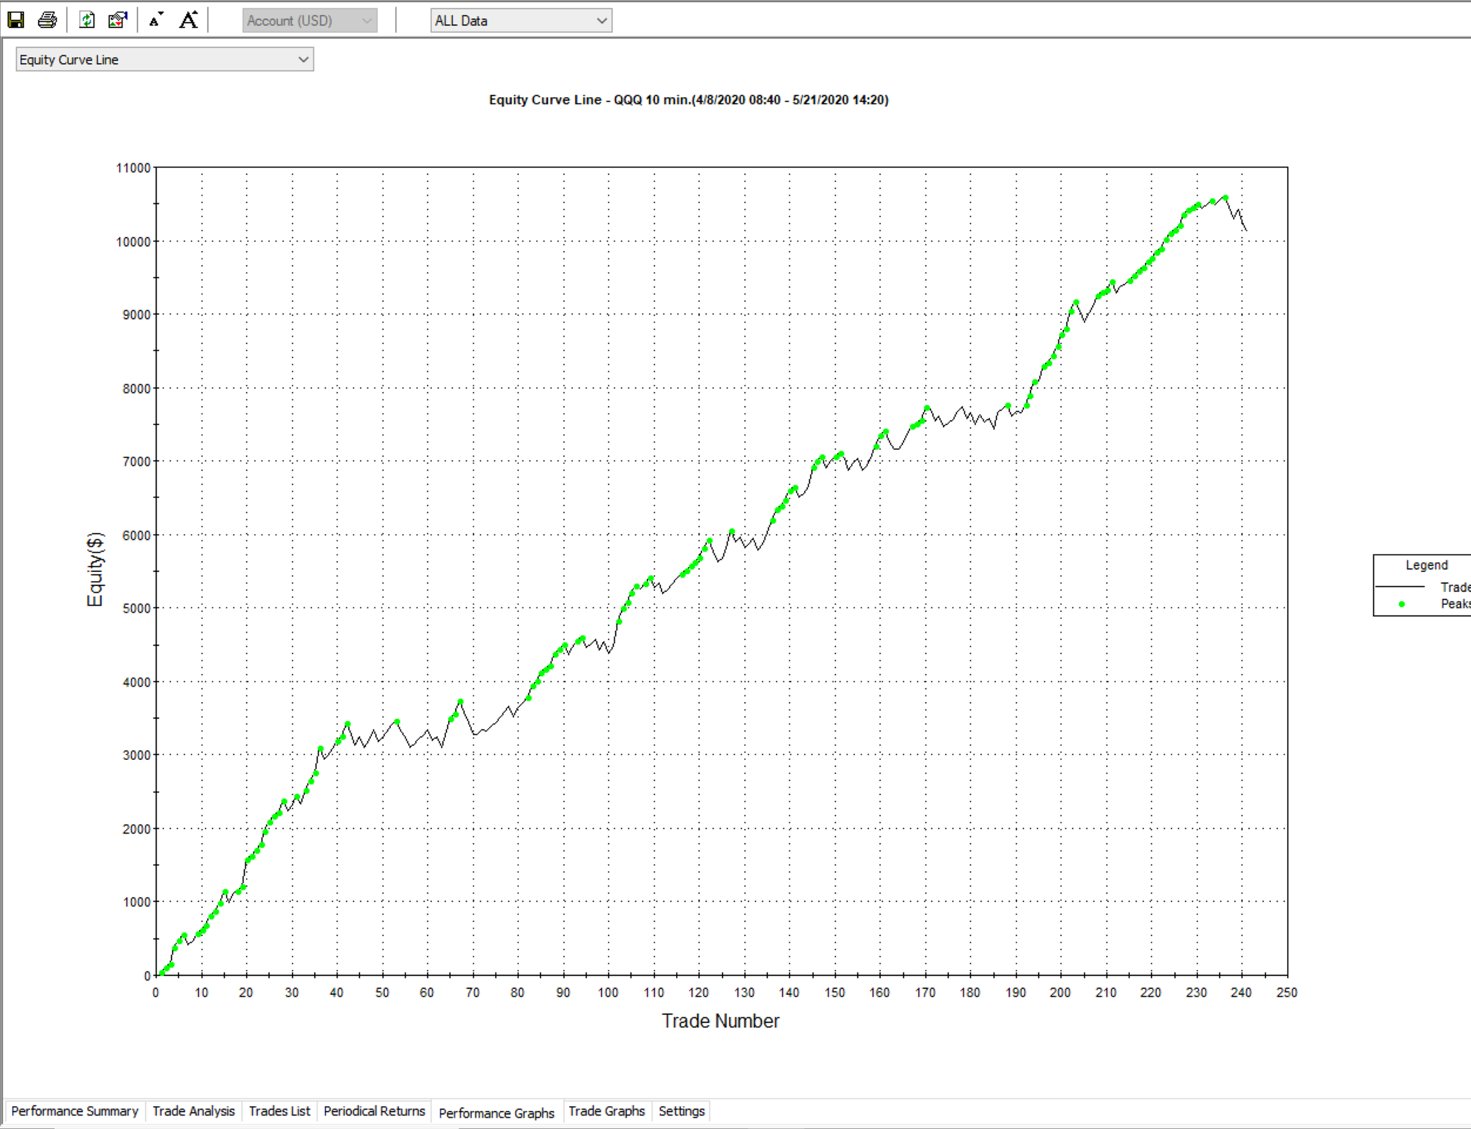
So you just finished writing your automated trading algo, and you’re nearing the moment of truth - the initial backtest. You’ve spent a few hours building this, so you’re really hoping the equity curve is at least positive sloping, and hopefully without any huge dips in it.
This moment will certainly define the past few hours spent working on this, and could even change your future with a good enough curve — a straight, green, upward-sloping line will bring sheer joy, while a choppy black/red line can deflate your self-worth. Let’s say for this example, your results are a gigantic, quadratic and upward sloping beast of a curve that simply does not stop.
The curve that will take you to the promised land, will crush anyone in your path, and make no apologies about its brilliance. We’ve all seen one of these — but how can we be sure that this backtest is valid, and that we can expect something within the realm of these results going forward?
There are a few tricks that can help us determine the probability of a backtest being accurate. First of all, let’s begin with mechanics and assumptions. Any backtest that does not model Commissions and slippage should not be considered a representation of the strategy. In some systems, this is an immaterial difference, but in others, it can change that curve drastically — I’ve seen it invert some scalping system’s equity curves.
Commissions, complications and details
So how much is enough — commission’s are usually fairly standard schedules of fees, so simply make them what they are. This stuff isn’t complicated, but it’s incredibly important not to overlook these minor details.
Slippage can be a bit more complicated, but a common estimate in Futures is $12.50 per side for market orders, and I think I use .02 - .10 per side for Equities/ETFs. I usually find this to be a pretty high estimate — but it’s important to model it on your execution history. If you also want to learn more, you can explore our futures trading course here.
Personally, I use about half of this — but that’s only because I’ve tested the systems extensively with my execution, and have found that $6 is much closer to my realized slippage. Review some of your real-time trades compared to paper trades, and see where they are filling relative to the sim account fills.
Not all instruments are equal here, so if you find ES (EMini S&P 500 Futures contract) has about 12.50 in slippage, that does not mean that KC (Coffee Futures Contract) will also have about $10 — I’ve seen KC trades fill $40 off in illiquid intervals. Be mindful of the instruments your testing on, and the easiest way to do this is to compare live to sim reports. It is well worth your time to do.
The strategy logic
So once slippage and commission have been either accurately or conservatively (estimated on the HIGH end) included in your backtest, let’s dig into the actual strategy logic. There are a few components that can be really effective in real-life but can also produce some outlandish backtest results — one of those things is a percent trailing stop.
In many backtest engines, (TradeStation, NT8, TradingView) the default setting is to backtest based on bars, rather than within the bars. What this means is that a long entry will simply look at the OHLC values to determine if your trailstop was executed — AKA it will look for a High - Close value that is greater than your % Trailing.
Incorporating automated trading with TradingView allows for trade execution within the bars, giving you a clearer view of market dynamics and enhancing the reliability of your backtesting results.
In real-time, you will find that your position can be executed hundreds of times within any given bar, before any close value — and this can show much larger average winning trades, thus average trades, and performance in general.
In backtests, engines will assume green bars were one upward movement, rather than an aggregation of many small upward movements with retraces back. All you have to do is compare any 30M chart to a 1-minute chart of the same interval — there’s a lot of movement in the middle that can very well trigger your trailing stop loss (and likely would live).
So how can we combat this backtest (hindsight) bias of most testing engines? Let’s see.
Combatting the Backtest bias
In TradeStation/Multicharts, you can enable Intra-Bar-Backtesting (or Bar Magnifier in MC) in the properties (and set the resolution to Minute, Second, or Tick), which should give you a much better idea of how your system will perform. This will take longer, but it’s far more accurate.
If there isn’t any setting available to do this, like in Python - you can run 2 datasets. One as the signal interval, for example, say 30M bars - to signal the entries; The other to track the Percent Trail Stops, say a Tick, 30 second, or 1M bar.
I will share an IB system where I test my trail-stops with a 5-second bar, vs a 60m bar for entries — implementing something like this is the most viable option for ensuring your own backtests are as accurate as possible.
If you’re not able to implement a smaller interval bar (maybe there aren’t any 1M or second bars or data available) — then you can implement a fixed Target value in place of your Trail Stop to give you an estimated worst-case fill value.
I have found it to be definitely worse performing than a trailstop, but not an entirely unreasonable estimation of your winning trades. An example would be to replace or simply combine a +$100 PNL trail-stop with a $90 - 120 fixed target.
Try to be honest with yourself about where you’re typically getting stopped out. This can also be done by using a $100 pnl Trail Stop and maybe a $150 fixed target, limiting your upside that the computer can create based on assumptions.
Backtesting checklist
Assuming you have made it this far, your backtests are definitely becoming much more down to earth, literally. There are still a few things that I’ve found to cause some crazy results through backtesting, so I’ll list them out for a final review.
- Entry and Exit within the same bar
- Weekend/Overnight Carry (+ luck)
- Small sample size (Include at least 100 trades and as many regimes as possible)
- Penny stocks / Illiquid names
- Universe includes leveraged ETF’s / ETN’s
- Universe includes redundant symbols (QQQ and TQQQ)
Conclusion
If you have completed this basic checklist, you should feel much better about any results that you are seeing. And if you haven’t ever considered this, please don’t get discouraged. Keep in mind that most professional money managers don’t beat the market — and try to. They focus on improving rather than meeting a specific level of performance.
Why does so much ride on a single line chart, and how can we be sure that a beautiful backtest is not just a cruel joke our computer is playing on us? Working through this checklist will make a significant improvement.
While we’re reviewing, let’s try to remember the purpose of a backtest. I will never trust a pretty backtest - there are too many assumptions being made even in the best ones. Let’s redefine what consists of a beautiful backtest, and in the meantime, let’s remember that they are simply a validation tool, not a tool for development.
You can improve your likelihood of success in trading by backtesting your trading rules on historical data. This course on backtesting trading strategies by Quantra is just what you need to get the best out of your trading. Learn everything from the basic steps, data, rules, risk management and more. Enroll now!
- Happy Trading!
Note from the editor: QuantInsti respects the author’s choices and preferences but we in no way endorse, support or suggest any brands in this article. The views are of the author’s completely. We prefer and promote usage of Python for Quantitative Trading.
Disclaimer: All data and information provided in this article are for informational purposes only. QuantInsti® makes no representations as to the accuracy, completeness, currentness, suitability, or validity of any information in this article and will not be liable for any errors, omissions, or delays in this information or any losses, injuries, or damages arising from its display or use. All information is provided on an as-is basis.