By Zach Oakes
Quantitative metrics are a widely debated topic, but per usual I find it best to keep it simple and focus on two key trading metrics to judge how a system should perform in the future.
By combining these metrics, you can create something I call expected edge, which has proven to be quite useful for selecting parameters, strategies, and even system allocations.
By utilizing different ‘styles’ of systems/parameters, you can further diversify existing signals, thus improve your bottom line.
In this blog, we will cover:
Introduction
Creating consistent and profitable trading strategies is never easy, and creating generalized automated entries and exits can sometimes be even harder. If you are new to building automated strategies, the Automated Trading for Beginners learning track will give you the groundwork needed before tackling these advanced concepts. There're so many factors to consider;
Do you approach it from a mathematical perspective, and try to find an edge purely in the numbers or a new representation/abstraction of the numbers?
Do you tackle it from a pattern perspective, and try to find various bar signals that tend to pre-empt consistent movements?
Of course, there's also the age-old debate of technicals vs fundamentals — should you use one, both, or neither?
While technicals can definitely help in discretionary trading by providing easy rules and markers to utilize in taking a more systematic approach, they typically don't provide great results on their own in automated strategies.
Technicals, however, can be really effective filters to further improve an entry that lacks efficiency, and Fundamentals can be invaluable for filtering down universes for a slight advantage (see this Reading list for the book on Fundamental alpha factors).
Oh boy — I didn't even get into the universe;
Should I trade single security, a fixed universe of say 10 securities, or maybe a dynamic universe sorted and filtered daily?
How am I ever going to get a strategy finished, let alone a profitable one?
Approach to take for a System
First of all, I tend to follow a rule of pragmatism to avoid complexity for complexity’s sake — i.e. keep it simple. So let's start with a single instrument, in the easiest platform for you (for me, TradeStation / Easylanguage, or Python) and pick an approach to take for a system.
Typically, I begin with patterns and then use a mathematical or technical concept to apply as a filter (for more info on finding ideas for strategies — see my article Quantitative Trading - Building Entry Ideas and Idea flow CONSTANTLY).
I also keep a generic stop/exit package that I add in to test entries in an apples to apples way (trail stop, target, and stop loss). Let's say we began with a moving average and envelope indicator strategy, and we have something that's slightly promising initially; what are the metrics we should be reviewing, and what values should we expect?
Setting up the system
First off — some ground rules: I start with single contract Futures, use a realistic commission and slippage ($3.10 + $5 per side), and start with a 3 year backtest (for intraday models — you want at least 500 trades, in various market conditions). So now what? What is there to look for?
Starting at the top in TradeStation — see how it returned for the net. This isn't a huge priority, but I mean obviously, we want to make sure it's making money. I typically don't consider intraday systems < 20% YoY to be worth focusing on further.
If I create a system that is profitable but doesn't quite meet my specs, I don't throw them away, I archive them for further development later — and I often go back to this archive to combine existing stuff or pull aspects from here to utilize so, it's good to have! Of course, in direct relation to the Net Return is the Drawdown, as a 20% return with an 80% drawdown is no longer that attractive.
Here we have our first balancing act — while yes any Return can be achieved with enough leverage, it cannot be achieved while maintaining a low drawdown. When Return scales linearly or exponentially with aggressive money management, and so does the Drawdown (DD)!
I look for a Calmar Ratio (Return / Drawdown ratio) of 4+, so 20k YoY And 5k DD would be my worst case. Ideally, I'm looking for something in the 10-20+ range, but a lot of those systems start out initially as 4’s.
Of course, you'll also notice here that tighter stops can in some cases help reduce DD, by limiting the size of losses — where in others it seems to do the opposite, simply increasing the likelihood of losses.
This brings us nicely to our next (and in my opinion, the most vital) metric balancing act — Win Rate and Avg Win: Loss.
Win Rate and Avg Win : Loss
The trade-off between a high win rate and a high average W:L (I’ll call it WL, calculated as avg winning trade / avg losing trade) is absolutely crucial to consistent system performance, as it determines how often you're winning, and what those wins are doing for your equity.
I like to think of the combination of these metrics as the Expected Value or Expected Edge of a trade, but more on that later. First — some general info on Win Rate x WL. Different kinds of systems tend to utilize very different ‘styles’ here, and there are all kinds of grey areas in between these ‘styles’.
Trend Following or Momentum system
Trend following strategy or Momentum trading system tends to go for a 30-50% Win Rate, with a WL of > 1, ideally 1.5 or 2.0, but in some cases as high as 4 or 5 (meaning the average win is 4 or 5x larger than the average loss).
I have found value in this style as a method of further diversifying existing systems. So using an example, and tying back into my Expected Edge method, let's compute the edge of a Trend system with 40% win rate, and a 2 WL.
WinPct x AvgW - LossPct x AvgL
.4 x 2 - .6 x 1== .8 - .6 = .2 expected edge
Mean Reversion or counter-trend style system
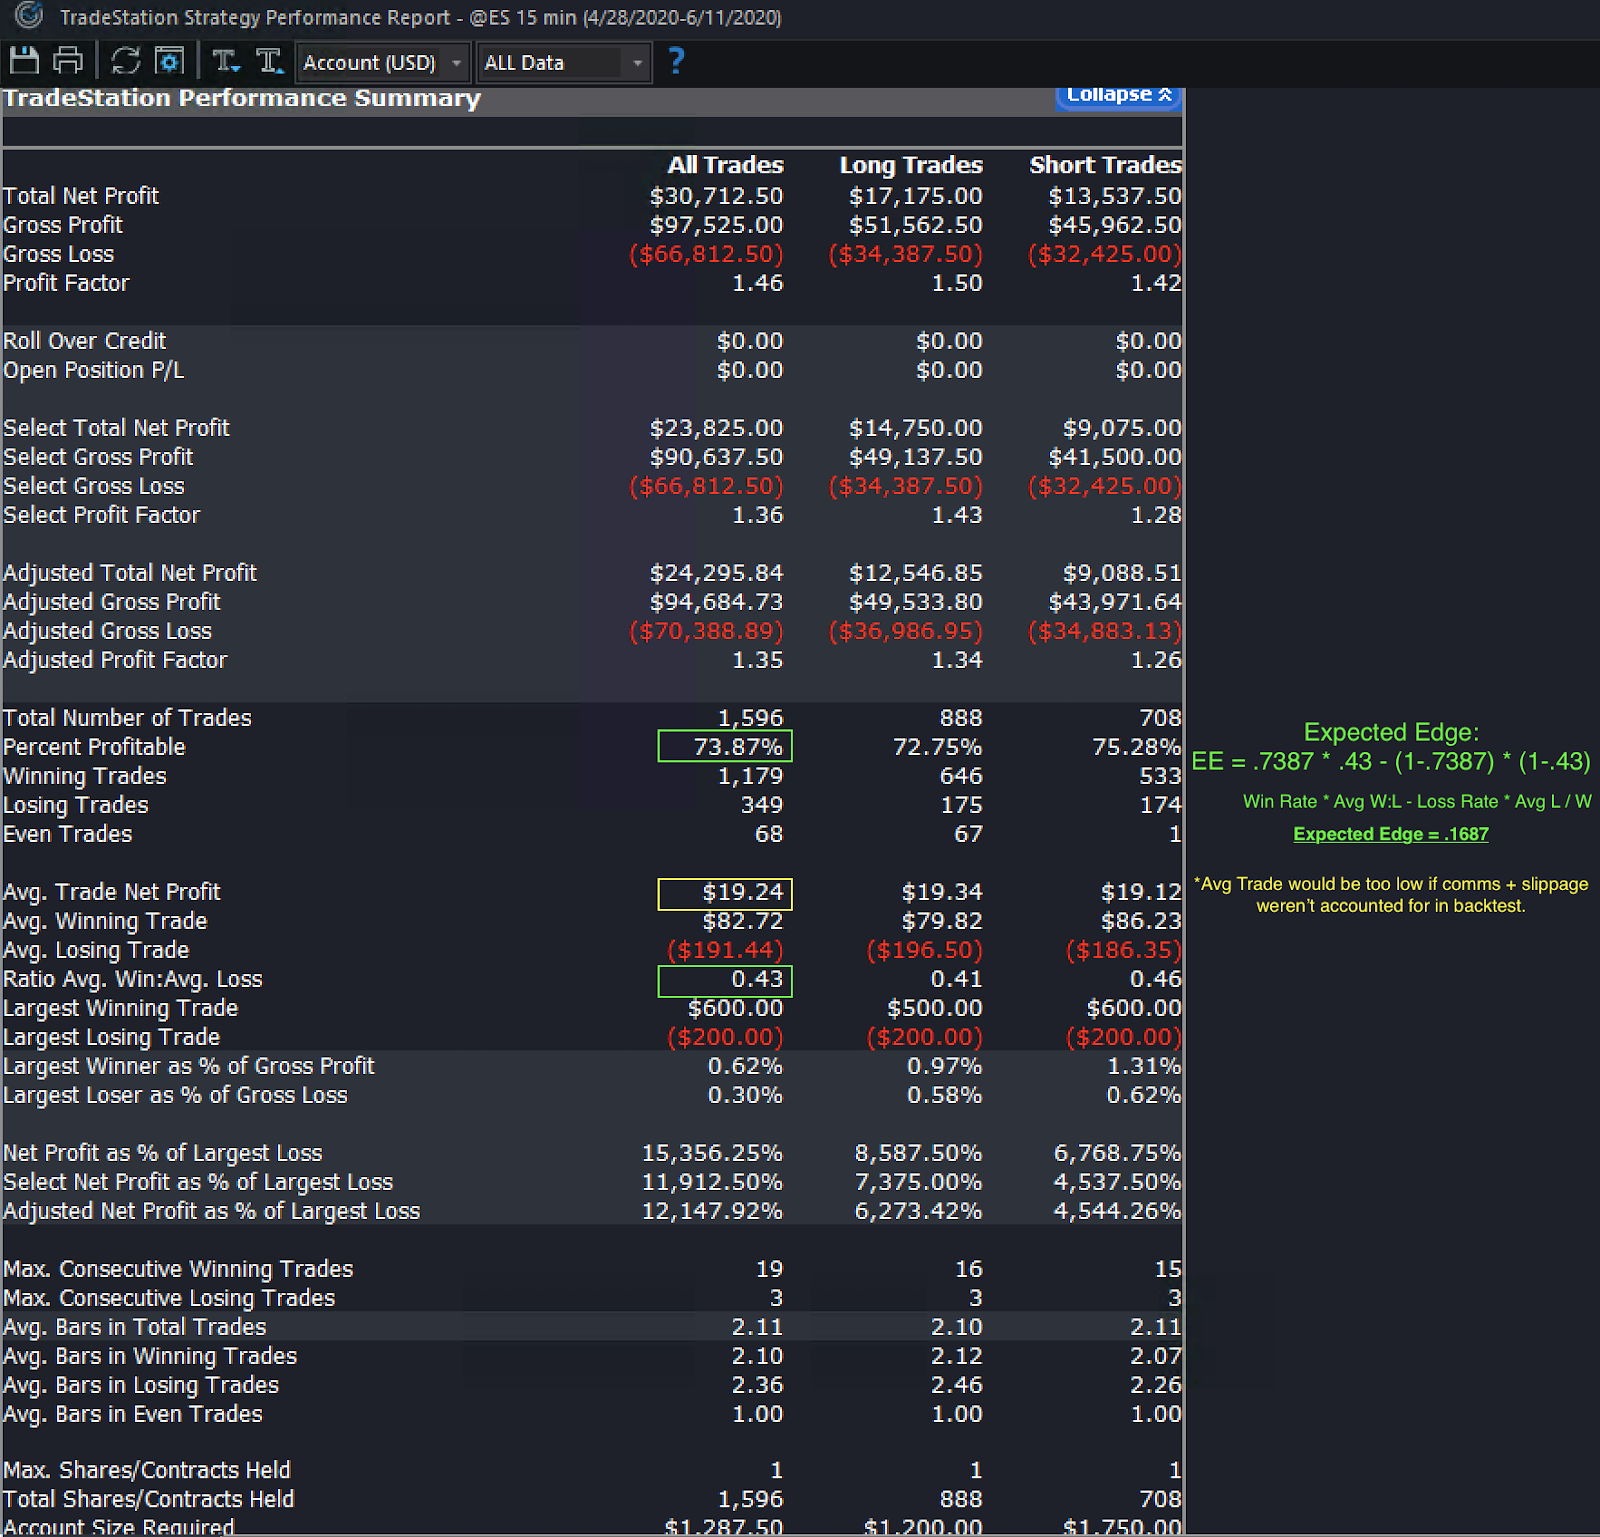
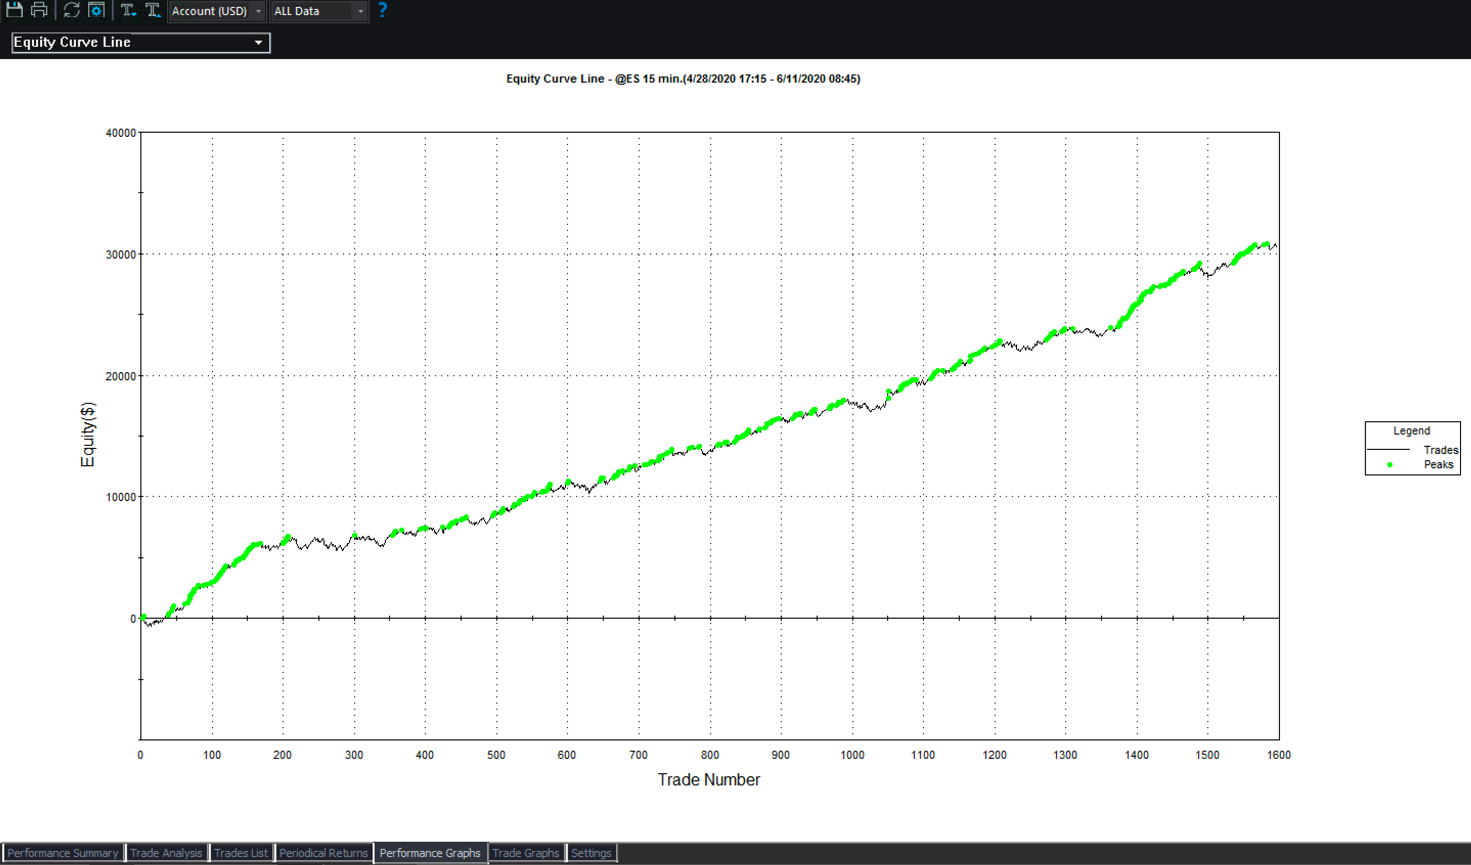
There's Mean Reversion trading or counter-trend style, typically with a higher win rate, and a WL < 1. This is where most of my systems would fit in, or somewhere between here and our third system style. These tend to have a 50-70 win rate, with a WL of .7 - 1.2, so more winners but winners and losers of about the same size.
Let's take a look at a stop / target parameter set that achieves this, and look at EE values for a system with 70% win rate, and a 1:1 win : loss.
.7 x 1 - .3 x 1 = .4 expected edge
The final system style is notoriously difficult to do, but can be incredibly profitable if achieved; this mythical blend is called Scalping. By focusing on mean reversion trading, traders aim to capitalize on these setups with greater consistency.
Scalping system
Scalping systems are usually the culprit when people have flawless, beautiful backtests that turn bad quickly in live trading — it's easy to cheat or engineer a perfect backtest with simple (false) assumptions in a scalping strategy (like No slippage, commission, and immediate execution).
Most of my systems probably fit in between scalping and countertrend — a common misconception about scalping is that it requires super lower intervals, but I've traded scalping systems on 30M bars for years without issue. These systems tend to have the highest win rate, and the lowest WL, sometimes painfully low.
Usually win rates are in the 65 - 90%, and WL of .2 - .4, and those .2’s — while tiny — must never fall anywhere below that value as they are key to keeping the system positive. If you think 90% win rate sounds like a dream: Trust me, finishing a day 8/10 and being up $10 has its frustrating moments too.
Let's try to avoid those days by tracking the expected edge, or better yet ensuring there is one.
.85 x .3 - .15 x 1 == .255 - .15 = .105
Nobody likes losing, let alone expecting to lose — but as you can see via Expected Edge it does tend to be a more consistent route to take than attempting a scalping system with almost no margin for error.
Scalping systems do exist, and I'll show you a few — but 90% win rates have their drawbacks as well. It is also worth noting again that I believe 90% of flawless backtests are flawed scalp systems; simply engineering with trail stops and lookback bias.
Balancing trade metrics
I encourage you to play around with these metrics to see what works, and what doesn't — I find I'm surprised by the edge in many balances that I find unattractive and find the little edge in blends I would expect to do well.
As you can see, it's not quite a breeze having these 90/10 systems as it typically consists of winning often, followed inevitably by a loss, wiping out hours of work. Based on your EE investigation, you can see how difficult it is to be profitable with these scalping systems, and the massive number of trades required in order to exploit this edge.
This is why I tend to be somewhere in the middle of Countertrend and Scalping, and I'm even beginning to see the value of the Trend style systems.
I also think I should point out — you can have a Trend system that has scalping style averages, and vice versa. These ratios are simply what is common in those styles of signals, but a 1:1 WL and 50% win rate don't automatically qualify your system as Mean Reversion.
I classify the systems based on what aspects of moves the signals tend to exploit, and what markets they excel in. To be clear, the presence of these ratios doesn’t necessarily classify the signals as that type of system.
Mixing Styles
Lately, I've found that using a blend of these styles in tandem has a lot of value — as they tend to balance each other out. They also change the daily correlation of systems and tend to create a small amount of diversity even within existing systems simply by choosing widely different parameters for a single core strategy. Time to let my ego (and win rate) take a back seat to the expected edge - if it somehow breaks I'll simply buy a new ego with my added edge’s winnings.
Conclusion
Return vs Drawdown tends to be a balancing act of suitability - or a measure of what suits your risk profile and risk aversion - but the expected edge is a factor in suitability and a key profitability metric.
You should consider both when deciding which systems to run with live. No matter your preferred ‘style’ - I find the balancing of these metrics to be one of the most vital decisions we will make.
It's important to consider these metrics when developing strategies, and when selecting parameters in walk forwards - choosing incorrectly can turn good systems into great ones, or great systems into losing ones.
- Happy Trading
Note from the editor: QuantInsti respects the author’s choices and preferences but we in no way endorse, support or suggest any brands in this article. The views are of the author’s completely. We prefer and promote usage of Python for Quantitative Trading.
Disclaimer: All data and information provided in this article are for informational purposes only. QuantInsti® makes no representations as to the accuracy, completeness, currentness, suitability, or validity of any information in this article and will not be liable for any errors, omissions, or delays in this information or any losses, injuries, or damages arising from its display or use. All information is provided on an as-is basis.