
The project aims at building an asset allocation strategy for stocks comprising the nifty bank index by leveraging daily returns prediction from a set of dynamic linear neural network in trading.
The neural network models are dynamic and updated on a daily basis at the end of each trading day providing for reactivity to changes in market and stock trends in general. Besides that, the linearity of models accounts for an easy explainability of the results.
The complete data files and python code used in this project are also available in a downloadable format at the end of the article.
This article is the final project submitted by the author as a part of his coursework in the Executive Programme in Algorithmic Trading (EPAT®) at QuantInsti®. Do check our Projects page and have a look at what our students are building.
About the Author

Mrinall Mahajan has graduated in Mechanical Engineering from IIT Kanpur, currently with Blackrock.
Trading and Investing is something that has always fascinated him and in a direction to make a career in the same, he cleared Financial Risk Management (FRM) from the Global Association of Risk Professionals (GARP).
He has been working in the analytics domain for the past 3 years having worked for some of the largest US banks. He is currently working with a leading US Bank in the credit card fraud risk modelling space.
As a next step towards getting hands-on experience with trading, he decided to leverage his analytical skills in order to develop something which could be profitable and requires minimal monitoring.
That’s when the idea for this project struck him and with the guidance from Quantinsti Team, he was able to execute it.
Defining the problem statement
Predict the percent change in the price of the stock from today’s close to close on the next day based on data till yesterday.
In simple words, if let’s say data is available to us on a daily frequency then based on the variables created on yesterday’s (d-1) data we want to predict the percent price change in close at next day (d+1) and close today(d).
Based on predictions we can know that if we buy the stock at today’s close whether or not will it turn profitable by tomorrow.
Based on the model results we want to make an asset allocation strategy that can leverage the BTST (Buy Today Sell Tomorrow) feature offered at relatively lower transaction costs as compared to intraday trades by various brokers.
Approached Solution
Part 1 - Model Development
We created the following set of dynamic neural network models:-
- Probability Predictor – Determines the probability of a positive return
- Positive Return Predictor – A model trained on only the positive returns instances which predicts the positive log value for the return
- Negative Return Predictor - A model trained on only the negative returns instances which predicts the negative log value for the return
Here log returns are used as dependent variable instead of percentage returns or price changes in order to maintain stationarity in series.
- Development Data – 2010 to 2015
- Validation data – 2016 to Apr’2018
- Out of Time Data – May’2018 to Dec’2020
The historical data taken for the stocks as given below:-
|
Bank/Company Name |
Symbol |
Weightage in Nifty Bank |
Data Available from |
|
HDFC Bank Ltd. |
HDFCBANK |
28.39% |
01-01-2010 |
|
ICICI Bank Ltd. |
ICICIBANK |
19.48% |
01-01-2010 |
|
Kotak Mahindra Bank Ltd. |
KOTAKBANK |
16.31% |
01-01-2010 |
|
Axis Bank Ltd. |
AXISBANK |
14.95% |
01-01-2010 |
|
State Bank of India |
SBIN |
9.56% |
01-01-2010 |
|
IndusInd Bank Ltd. |
INDUSINDBK |
4.37% |
01-01-2010 |
|
Bandhan Bank Ltd. |
BANDHANBNK |
2.58% |
27-03-2018 |
|
Federal Bank Ltd. |
FEDERALBNK |
1.33% |
01-01-2010 |
|
RBL Bank Ltd. |
RBLBANK |
1.06% |
31-08-2016 |
|
IDFC First Bank Ltd. |
IDFCFIRSTB |
0.85% |
06-11-2015 |
|
Punjab National Bank |
PNB |
0.46% |
01-01-2010 |
|
Bank of Baroda |
BANKBARODA |
0.66% |
01-10-2010 |
Part 2 - Strategy
The aim of the strategy is to distribute the available cash generated from cash inflow and sale of any existing positions amongst the 12 banking stocks on a daily basis.
The procedure followed to execute the strategy is as follows:-
- Get the probability (p) of positive next day return (future return) from the probabilistic model.
- Get the positive and negative log returns from the deterministic return models and convert the log values to percentages. Let’s say the positive percentage return is m and the negative percentage return is n.
- Calculate expected return(e) as p*m+(1-p)n. Convert the expected return to log and divide it by Volatility (standard deviation) of the last 5 days log return to get a ratio. Let’s call this ratio Sharpe.
- Modify the Sharpe as a minimum (0, Sharpe). For the stocks with 0 Sharpe sell the shares if holding in the proportion of expected losses (calculated from the expected return)/ [profits made till date] if profits are positive else sell all shares for that stock.
- For the stocks with positive Sharpe distribute the available cash from the sale of stocks and actual cash in the proportion of their Sharpe.
Part 3 - Risk Management
Apply a stop loss at 20% for investments made in each stock i.e. that if the market value of existing positions for a stock is less than 80% of value invested into it then sell all shares for that stock.
Model Development
The variables created as inputs to the models are as follows:-
|
Variable |
Dimension |
Description |
|
return_1d |
past returns |
last 1 day log return |
|
return_2d |
past returns |
last 2 day log return |
|
return_3d |
past returns |
last 3 day log return |
|
return_4d |
past returns |
last 4 day log return |
|
return_5d |
past returns |
last 5 day log return |
|
return_6d |
past returns |
last 6 day log return |
|
return_7d |
past returns |
last 7 day log return |
|
return_8d |
past returns |
last 8 day log return |
|
return_9d |
past returns |
last 9 day log return |
|
return_10d |
past returns |
last 10 day log return |
|
Open_Chg |
Changes |
log change for open last day |
|
High_Chg |
Changes |
log change for high last day |
|
Low_Chg |
Changes |
log change for low last day |
|
Range_Chg |
Changes |
log change for high-low range last day |
|
Volume_Chg |
Changes |
log change for volume last day |
|
Volatility5 |
Volatility |
standard deviation of last 5 day log returns |
|
Volatility20 |
Volatility |
standard deviation of last 20 day log returns |
|
MA5_ratio |
Ratios |
ratio of last day close to last 5 days moving average |
|
MA20_ratio |
Ratios |
ratio of last day close to last 20 days moving average |
|
High5_ratio |
Ratios |
ratio of last day close to last 5 days high |
|
Low5_ratio |
Ratios |
ratio of last 5 day low to last day close |
|
High20_ratio |
Ratios |
ratio of last day close to last 20 days high |
|
Low20_ratio |
Ratios |
ratio of last 20 day low to last day close |
|
return_1d_nifty |
past returns nifty |
last 1 day log return for nifty bank |
|
return_2d_nifty |
past returns nifty |
last 2 day log return for nifty bank |
|
return_3d_nifty |
past returns nifty |
last 3 day log return for nifty bank |
|
return_4d_nifty |
past returns nifty |
last 4 day log return for nifty bank |
|
return_5d_nifty |
past returns nifty |
last 5 day log return for nifty bank |
|
return_6d_nifty |
past returns nifty |
last 6 day log return for nifty bank |
|
return_7d_nifty |
past returns nifty |
last 7 day log return for nifty bank |
|
return_8d_nifty |
past returns nifty |
last 8 day log return for nifty bank |
|
return_9d_nifty |
past returns nifty |
last 9 day log return for nifty bank |
|
return_10d_nifty |
past returns nifty |
last 10 day log return for nifty bank |
|
MA5_ratio_nifty |
ratios nifty |
ratio of last day close to last 5 days moving average for nifty bank |
|
MA20_ratio_nifty |
ratios nifty |
ratio of last day close to last 20 days moving average for nifty bank |
|
High5_ratio_nifty |
ratios nifty |
ratio of last day close to last 5 days high for nifty bank |
|
Low5_ratio_nifty |
ratios nifty |
ratio of last 5 day low to last day close for nifty bank |
|
High20_ratio_nifty |
ratios nifty |
ratio of last day close to last 20 days high for nifty bank |
|
Low20_ratio_nifty |
ratios nifty |
ratio of last 20 day low to last day close for nifty bank |
|
Volatility5_nifty |
volatility nifty |
standard deviation of last 5 day log returns for nifty bank |
|
Volatility20_nifty |
volatility nifty |
standard deviation of last 20 day log returns for nifty bank |
|
Bollinger5_ratio |
Bollinger |
(price-lower bollinger)/(upper bollinger - lower bollinger) in last 5 days |
|
Bollinger20_ratio |
Bollinger |
(price-lower bollinger)/(upper bollinger - lower bollinger) in last 20 days |
|
ADX5 |
Momentum Indicator |
average direction movement index over 5 days |
|
RSI5 |
Momentum Indicator |
Relative Strength index over 5 days |
|
ADX20 |
Momentum Indicator |
average direction movement index over 20 days |
|
RSI20 |
Momentum Indicator |
Relative Strength index over 20 days |
|
correlation |
nifty correlation |
correlation of last 10 day's return with nifty last 10 day returns |
A common input data set was created in the first place. Then we moved on to analyze the variable trends for the 3 use cases – probability, positive return and negative returns model.
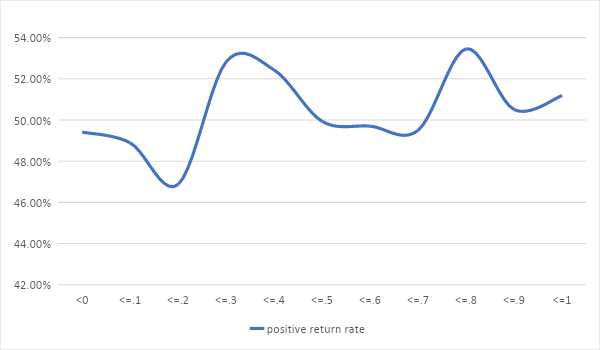
As an example, we are showing below the trends of the correlation variable in 3 models.
Model 1 - Probability Model Trend
Model 2 - Positive Return Model Trend
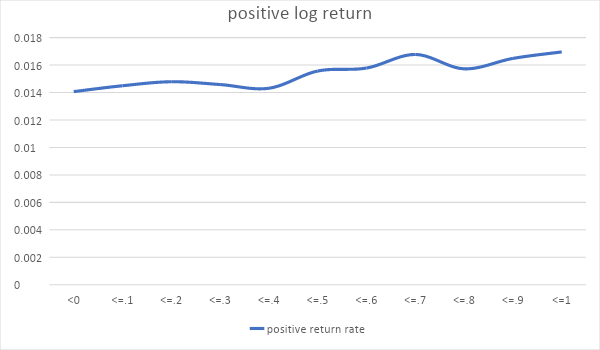
The trend signifies the assumption that for the upward move in prices a higher correlation of stock with market accounts for higher returns.
Model 3 - Negative Return Model Trends
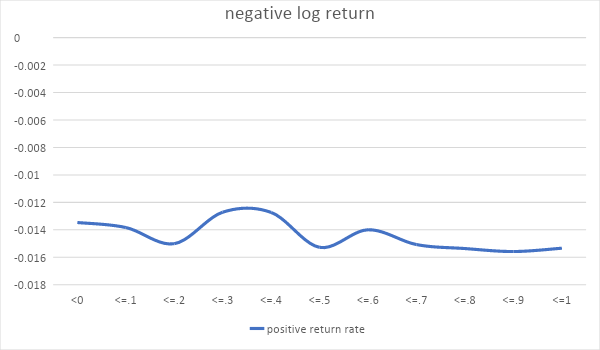
The trend shows that in general with increased correlation the negative impact on share prices is also increased.
After visualizing the trends we did variable reduction for each model specifically using advanced analytics techniques like variance inflation, variable clustering and backward selection along with a basic intuitive visualization of trends.
Note: The codes and resources for model development can be found towards the end of the blog.
After the variable analysis and reductions following variables were used as input into the models.
Probability Prediction Model
|
Variable |
Description |
|
return_1d |
last 1 day log return |
|
return_3d |
last 3 day log return |
|
return_5d |
last 5 day log return |
|
return_10d |
last 10 day log return |
|
Open_Chg |
log change for open last day |
|
High_Chg |
log change for high last day |
|
Low_Chg |
log change for low last day |
|
Volume_Chg |
log change for volume last day |
|
MA5_ratio |
ratio of last day close to last 5 days moving average |
|
MA20_ratio |
ratio of last day close to last 20 days moving average |
|
Low5_ratio |
ratio of last 5 day low to last day close |
|
High20_ratio |
ratio of last day close to last 20 days high |
|
Bollinger5_ratio |
(price-lower bollinger)/(upper bolinger - lower bollinger) in last 5 days |
|
Bollinger20_ratio |
(price-lower bollinger)/(upper bolinger - lower bollinger) in last 20 days |
|
RSI5 |
Relative Strength index over 5 days |
|
RSI20 |
Relative Strength index over 20 days |
|
return_1d_nifty |
last 1 day log return for nifty |
|
return_2d_nifty |
last 2 day log return for nifty |
|
return_3d_nifty |
last 3 day log return for nifty |
|
return_4d_nifty |
last 4 day log return for nifty |
|
return_8d_nifty |
last 8 day log return for nifty |
|
return_10d_nifty |
last 10 day log return for nifty |
|
MA5_ratio_nifty |
ratio of last day close to last 5 days moving average for nifty bank |
|
High20_ratio_nifty |
ratio of last day close to last 20 days high for nifty bank |
|
Low20_ratio_nifty |
ratio of last 20 day low to last day close for nifty bank |
|
Voltality20_nifty |
standard deviation of last 20 day log returns for nifty bank |
Positive Return Prediction Model
|
Variable |
Description |
|
return_1d |
last 1 day log return |
|
return_2d |
last 2 day log return |
|
return_3d |
last 3 day log return |
|
return_4d |
last 4 day log return |
|
Open_Chg |
log change for open last day |
|
Volume_Chg |
log change for volume last day |
|
Voltality5 |
standard deviation of last 5 day log returns |
|
Voltality20 |
standard deviation of last 20 day log returns |
|
MA5_ratio |
ratio of last day close to last 5 days moving average |
|
High5_ratio |
ratio of last day close to last 5 days high |
|
Low5_ratio |
ratio of last 5 day low to last day close |
|
High20_ratio |
ratio of last day close to last 20 days high |
|
ADX20 |
average direction movement index over 20 days |
|
RSI20 |
Relative Strength index over 20 days |
|
return_1d_nifty |
last 1 day log return for nifty |
|
return_2d_nifty |
last 2 day log return for nifty |
|
return_3d_nifty |
last 3 day log return for nifty |
|
return_4d_nifty |
last 4 day log return for nifty |
|
return_9d_nifty |
last 9 day log return for nifty |
|
return_10d_nifty |
last 10 day log return for nifty |
|
MA5_ratio_nifty |
ratio of last day close to last 5 days moving average for nifty bank |
|
Low5_ratio_nifty |
ratio of last 5 day low to last day close for nifty bank |
|
High20_ratio_nifty |
ratio of last day close to last 20 days high for nifty bank |
|
Low20_ratio_nifty |
ratio of last 20 day low to last day close for nifty bank |
|
Voltality5_nifty |
standard deviation of last 5 day log returns for nifty bank |
|
Voltality20_nifty |
standard deviation of last 20 day log returns for nifty bank |
|
correlation |
correlation of last 10 day's return with nifty last 10 day returns |
Negative Return Prediction Model
|
Variable |
Description |
|
return_1d |
last 1 day log return |
|
return_2d |
last 2 day log return |
|
return_3d |
last 3 day log return |
|
High_Chg |
log change for high last day |
|
Voltality5 |
standard deviation of last 5 day log returns |
|
Voltality20 |
standard deviation of last 20 day log returns |
|
MA20_ratio |
ratio of last day close to last 20 days moving average |
|
Low5_ratio |
ratio of last 5 day low to last day close |
|
High20_ratio |
ratio of last day close to last 20 days high |
|
RSI20 |
Relative Strength index over 20 days |
|
return_1d_nifty |
last 1 day log return for nifty |
|
return_2d_nifty |
last 2 day log return for nifty |
|
return_3d_nifty |
last 3 day log return for nifty |
|
return_4d_nifty |
last 4 day log return for nifty |
|
return_5d_nifty |
last 5 day log return for nifty |
|
return_9d_nifty |
last 9 day log return for nifty |
|
High5_ratio_nifty |
ratio of last day close to last 5 days high for nifty bank |
|
Low5_ratio_nifty |
ratio of last 5 day low to last day close for nifty bank |
|
High20_ratio_nifty |
ratio of last day close to last 20 days high for nifty bank |
|
Low20_ratio_nifty |
ratio of last 20 day low to last day close for nifty bank |
|
Voltality5_nifty |
standard deviation of last 5 day log returns for nifty bank |
|
Voltality20_nifty |
standard deviation of last 20 day log returns for nifty bank |
|
correlation |
correlation of last 10 day's return with nifty last 10 day returns |
Using the given variables the linear neural network models are developed which have a converging architectur (Learn neural network trading in detail in the Quantra course). A converging architecture is such that at the next hidden layer the number of nodes is half of that at the current layer.
For example: In the probability model there are 26 inputs i.e. 26 nodes at the input layer, then 13 nodes at the 1st hidden layer, 6 nodes at the 2nd hidden layer, 3 nodes at the 3rd hidden layer and finally one node at the output.
All hidden layer nodes have a linear function in this case and just the output layer has a sigmoid function. In the positive and negative returns model, all nodes including output have linear activation.
The development data used for training the model is from 2010-2015 – 5 Years.
The static equation coefficients obtained for each of the models are as follows:-
Probability Prediction Model
A linear equation for the log of odds log(p/1-p)
|
Variable |
Description |
|
return_1d |
last 1 day log return |
|
return_3d |
last 3 day log return |
|
return_5d |
last 5 day log return |
|
return_10d |
last 10 day log return |
|
Open_Chg |
log change for open last day |
|
High_Chg |
log change for high last day |
|
Low_Chg |
log change for low last day |
|
Volume_Chg |
log change for volume last day |
|
MA5_ratio |
ratio of last day close to last 5 days moving average |
|
MA20_ratio |
ratio of last day close to last 20 days moving average |
|
Low5_ratio |
ratio of last 5 day low to last day close |
|
High20_ratio |
ratio of last day close to last 20 days high |
|
Bollinger5_ratio |
(price-lower bollinger)/(upper bolinger - lower bollinger) in last 5 days |
|
Bollinger20_ratio |
(price-lower bollinger)/(upper bolinger - lower bollinger) in last 20 days |
|
RSI5 |
Relative Strength index over 5 days |
|
RSI20 |
Relative Strength index over 20 days |
|
return_1d_nifty |
last 1 day log return for nifty |
|
return_2d_nifty |
last 2 day log return for nifty |
|
return_3d_nifty |
last 3 day log return for nifty |
|
return_4d_nifty |
last 4 day log return for nifty |
|
return_8d_nifty |
last 8 day log return for nifty |
|
return_10d_nifty |
last 10 day log return for nifty |
|
MA5_ratio_nifty |
ratio of last day close to last 5 days moving average for nifty bank |
|
High20_ratio_nifty |
ratio of last day close to last 20 days high for nifty bank |
|
Low20_ratio_nifty |
ratio of last 20 day low to last day close for nifty bank |
|
Voltality20_nifty |
standard deviation of last 20 day log returns for nifty bank |
Positive Return Model
A linear equation for log returns
|
Variable |
Description |
Coefficient |
|
return_1d |
last 1 day log return |
0.112714604 |
|
return_2d |
last 2 day log return |
0.076917067 |
|
return_3d |
last 3 day log return |
0.137521163 |
|
return_4d |
last 4 day log return |
0.139919728 |
|
Open_Chg |
log change for open last day |
0.044385113 |
|
Volume_Chg |
log change for volume last day |
0.00109395 |
|
Voltality5 |
standard deviation of last 5 day log returns |
-0.00038334 |
|
Voltality20 |
standard deviation of last 20 day log returns |
0.056020129 |
|
MA5_ratio |
ratio of last day close to last 5 days moving average |
0.314374059 |
|
High5_ratio |
ratio of last day close to last 5 days high |
0.315460533 |
|
Low5_ratio |
ratio of last 5 day low to last day close |
0.204366401 |
|
High20_ratio |
ratio of last day close to last 20 days high |
0.133332253 |
|
ADX20 |
average direction movement index over 20 days |
0.001150683 |
|
RSI20 |
Relative Strength index over 20 days |
0.01172027 |
|
return_1d_nifty |
last 1 day log return for nifty |
0.267879993 |
|
return_2d_nifty |
last 2 day log return for nifty |
0.193813279 |
|
return_3d_nifty |
last 3 day log return for nifty |
0.161507115 |
|
return_4d_nifty |
last 4 day log return for nifty |
0.104044914 |
|
return_9d_nifty |
last 9 day log return for nifty |
0.039391026 |
|
return_10d_nifty |
last 10 day log return for nifty |
0.029924326 |
|
MA5_ratio_nifty |
ratio of last day close to last 5 days moving average for nifty bank |
0.247091874 |
|
Low5_ratio_nifty |
ratio of last 5 day low to last day close for nifty bank |
0.047915675 |
|
High20_ratio_nifty |
ratio of last day close to last 20 days high for nifty bank |
0.018904656 |
|
Low20_ratio_nifty |
ratio of last 20 day low to last day close for nifty bank |
0.055917718 |
|
Voltality5_nifty |
standard deviation of last 5 day log returns for nifty bank |
0.097226188 |
|
Voltality20_nifty |
standard deviation of last 20 day log returns for nifty bank |
0.048495531 |
|
correlation |
correlation of last 10 day's return with nifty last 10 day returns |
0.001289934 |
|
intercept |
|
-0.232171148 |
Negative Return Model
A linear equation for log returns
|
Variable |
Description |
Coefficient |
|
return_1d |
last 1 day log return |
0.124469906 |
|
return_2d |
last 2 day log return |
0.094707593 |
|
return_3d |
last 3 day log return |
0.098002963 |
|
High_Chg |
log change for high last day |
0.061372437 |
|
Voltality5 |
standard deviation of last 5 day log returns |
0.489989489 |
|
Voltality20 |
standard deviation of last 20 day log returns |
0.461109012 |
|
MA20_ratio |
ratio of last day close to last 20 days moving average |
0.143796369 |
|
Low5_ratio |
ratio of last 5 day low to last day close |
0.245543823 |
|
High20_ratio |
ratio of last day close to last 20 days high |
0.214187935 |
|
RSI20 |
Relative Strength index over 20 days |
0.017691486 |
|
return_1d_nifty |
last 1 day log return for nifty |
0.152266026 |
|
return_2d_nifty |
last 2 day log return for nifty |
0.149913758 |
|
return_3d_nifty |
last 3 day log return for nifty |
0.137844741 |
|
return_4d_nifty |
last 4 day log return for nifty |
0.135978788 |
|
return_5d_nifty |
last 5 day log return for nifty |
0.005645283 |
|
return_9d_nifty |
last 9 day log return for nifty |
0.035861455 |
|
High5_ratio_nifty |
ratio of last day close to last 5 days high for nifty bank |
0.303022981 |
|
Low5_ratio_nifty |
ratio of last 5 day low to last day close for nifty bank |
0.101814494 |
|
High20_ratio_nifty |
ratio of last day close to last 20 days high for nifty bank |
0.074914791 |
|
Low20_ratio_nifty |
ratio of last 20 day low to last day close for nifty bank |
0.029958185 |
|
Voltality5_nifty |
standard deviation of last 5 day log returns for nifty bank |
0.481154203 |
|
Voltality20_nifty |
standard deviation of last 20 day log returns for nifty bank |
0.024172308 |
|
correlation |
correlation of last 10 day's return with nifty last 10 day returns |
0.000418738 |
|
intercept |
|
-0.212120146 |
Static versus Dynamic Model
The model development of 2010-2015 (5 Years) of data gave us the static equations for all models. However, the good thing about a neural network is that its weights for different nodes can be updated by feeding in the new data.
This intuitively makes sense as the markets or stocks don’t really follow a fixed static equation all the time and we need a dynamic solution that could reflect those changes.
As a proof of concept for the same, we created a dynamic model by feeding data from 2016’Jan to 2018’Apr on a daily frequency and updating model weights. The equation for all 3 models showed changes over a period of time.
Next, we compared the results for the 2018’Jan to 2018’Apr period to see the difference. Here we are trying to compare the accuracies and precision for both model over these 4 months for different stocks.
To explain how we are building a predicting indicator, let’s say the probability model returns a probability p for the rise in price, and positive and negative return models gave x and - y as returns, then expected return e = p*x+(1-p)*(-y).
We say positive return predicted if e is positive and base our accuracy precision and recall on that.
Static vs Dynamic – Month Wise Split
|
Month |
Static |
Dynamic |
||||
|
Accuracy |
Precision |
Recall |
Accuracy |
Precision |
Recall |
|
|
2018-01 |
43% |
42% |
41% |
46% |
46% |
53% |
|
2018-02 |
46% |
42% |
89% |
53% |
40% |
35% |
|
2018-03 |
50% |
44% |
46% |
54% |
46% |
27% |
|
2018-04 |
50% |
48% |
46% |
50% |
48% |
53% |
|
Total |
47% |
44% |
54% |
51% |
46% |
43% |
As can be seen from the above stats the dynamic model is more accurate and precise in its predictions as compared to the static model. Also, there is a great possibility of model results improving in future as more and more data is fed into it.
Static vs Dynamic – Stock Wise Split
|
Symbol |
Static |
Dynamic |
||||
|
Accuracy |
Precision |
Recall |
Accuracy |
Precision |
Recall |
|
|
AXISBANK |
46% |
41% |
67% |
51% |
41% |
42% |
|
BANKBARODA |
50% |
45% |
56% |
51% |
45% |
36% |
|
FEDERALBNK |
51% |
49% |
47% |
49% |
45% |
37% |
|
HDFCBANK |
46% |
39% |
24% |
61% |
61% |
53% |
|
ICICIBANK |
48% |
42% |
76% |
50% |
39% |
36% |
|
INDUSINDBK |
48% |
48% |
37% |
49% |
50% |
43% |
|
KOTAKBANK |
46% |
58% |
43% |
53% |
64% |
51% |
|
PNB |
40% |
34% |
63% |
53% |
37% |
37% |
|
SBIN |
45% |
40% |
75% |
49% |
36% |
38% |
|
RBLBANK |
50% |
50% |
60% |
41% |
41% |
43% |
|
BANDHANBNK |
69% |
40% |
67% |
54% |
29% |
67% |
|
IDFCFIRSTB |
45% |
41% |
53% |
49% |
44% |
50% |
|
Total |
47% |
44% |
54% |
51% |
46% |
43% |
As can be seen for most of the stocks as well the dynamic model is coming out to be much more accurate and precise.
Strategy
Based on the dynamic model results we implemented some variants of a Buy Today Sell Tomorrow (BTST) strategy. The backtest period was from 1st May’2018 – 10th Dec’2020 which is 2.61 years.
The benchmark strategy to compare with is taken as buy and hold strategy on nifty bank index. The variant that came out to be the best choice was a monthly SIP with Stop loss for an investment in each stock at 20%. The SIP amount in our case was taken as INR 20,000 per month.
Below are the statistics for the same:-
|
Statistics |
Benchmark |
Monthly SIP |
|
Max ROI |
26.89% |
131.87% |
|
Min ROI |
-33.83% |
-22.92% |
|
Max Drawdown |
47.86% |
55.39% |
|
Final ROI |
19.70% |
53.31% |
|
YOY Return |
7.14% |
17.80% |
As can be seen that the strategy generates at least more than 10% year on year returns as compared to the benchmark strategy of buying and holding bank nifty. The overtime performance of strategy can be seen in the below chart:
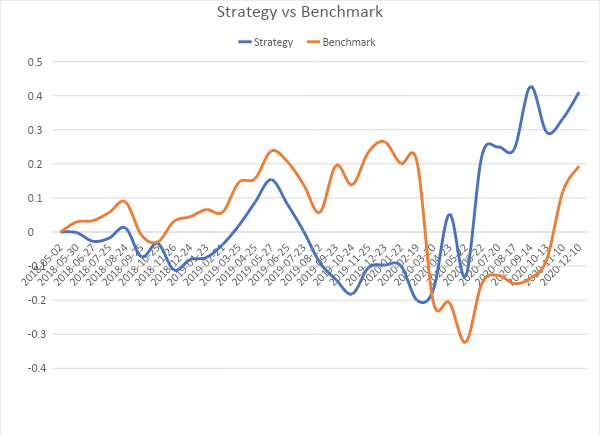
As can be seen from the chart that though the strategy lags a bit from the benchmark in the initial years it outperforms it in the more recent period.
Limitations
- The backtest doesn’t account for any transaction costs, however, for this strategy, the minimalistic transaction cost is available by various brokers. However in order to further fine-tune it one can sell only the delivered shares rather than open positions.
- There is some requirement of implementing a market microstructure strategy in order to obtain the best price for buying or selling the stock on a day.
- An automated application to execute the strategy on daily basis will be required. This has been worked upon by creating an app on the KITE platform of Zerodha.
Results
At the time of documenting this project 11th Feb’21, the model has given approximately 5% return on investment over a month’s period.
The details can be seen in the table below:-
|
Symbol |
Money Invested |
Market value |
P/L |
Shares Hold |
Shares in Demat |
LTP |
|
HDFCBANK |
1,387.15 |
1,581.75 |
194.60 |
1 |
1 |
1,581.75 |
|
ICICIBANK |
6.20 |
- |
-6.20 |
0 |
0 |
632.15 |
|
KOTAKBANK |
7,066.20 |
7,808.20 |
742.00 |
4 |
4 |
1,952.05 |
|
AXISBANK |
- |
- |
- |
0 |
0 |
734.80 |
|
SBIN |
16.55 |
- |
-16.55 |
0 |
0 |
392.25 |
|
INDUSINDBK |
4,256.60 |
5,114.00 |
857.40 |
5 |
5 |
1,022.80 |
|
BANDHANBNK |
376.15 |
- |
-376.15 |
0 |
0 |
331.20 |
|
FEDERALBNK |
779.70 |
745.65 |
-34.05 |
9 |
8 |
82.85 |
|
RBLBANK |
2,483.95 |
2,673.55 |
189.60 |
11 |
11 |
243.05 |
|
IDFCFIRSTB |
719.21 |
758.25 |
39.04 |
15 |
13 |
50.55 |
|
BANKBARODA |
412.75 |
398.50 |
-14.25 |
5 |
4 |
79.70 |
|
PNB |
228.40 |
118.35 |
-110.05 |
3 |
3 |
39.45 |
|
Market Money |
17732.86 |
19,198.25 |
1,465.39 |
|
|
|
|
Cash in hand |
2267.14 |
1886.55 |
-380.59 |
|
|
|
|
Total |
20000.00 |
21,084.80 |
1,084.80 |
|
|
|
|
ROI |
5.42% |
|
|
|
|
|
Codes
The codes and detailed analysis of this strategy can be found here.
Conclusion
An active daily portfolio rebalancing asset allocation strategy for nifty bank stocks leveraging the dynamic linear models can help generate annual returns of close to 20% within an approximate span of 3 years.
If you want to learn various aspects of Algorithmic trading then check out the Executive Programme in Algorithmic Trading (EPAT). The course covers various training modules and equips you with the required skill sets to build a promising career in algorithmic trading.
In order to assist individuals who are considering pursuing a career in algorithmic and quantitative trading, this case study has been collated based on the personal experiences of a student or alumni from QuantInsti’s EPAT programme. Case studies are for illustrative purposes only and are not meant to be used for investment purposes. The results achieved post completion of the EPAT programme may not be uniform for all individuals.
