
What would you do when a slowing momentum starts to display some strength? EPATian Vijayabhasker Iyer explains how you can trade with low ADX, and other momentum indicators, in his EPAT project. He shares a technical strategy deployed to capture short term potential price up move.
The complete data files and python code used in this project are also available in a downloadable format at the end of the article.
This article is the final project submitted by the author as a part of his coursework in the Executive Programme in Algorithmic Trading (EPAT®) at QuantInsti®. Do check our Projects page and have a look at what our students are building.
About the Author

Vijayabhasker Iyer is a Learning & Development professional with over 15 years of experience in BFSI. He has worked with multinational financial institutions, reinsurance broker, domestic KPOs/BPOs and holds a Certificate in Insurance from the Chartered Insurance Institute (UK). He is currently the site lead for capability development in one of the Global banks.
Vijay’s constant endeavour to learn and acquire new skills attracted him to the world of trading. After completing an introductory course in Technical Analysis from Kredent Academy, Kolkata, he went on to clear Chartered Market Technician (CMT) level one exam in 2018.
To continue pursuing his passion and further strengthen his skills, he registered for EPAT in 2020, an all-encompassing curriculum offered by QuantInsti in the field of quant/ algo-trading. The knowledge Vijay attained through course lectures and assignments has been put into practice in this project under the mentorship of Ishan Shah.
Strategy in brief
This is a technical strategy deployed to capture short term potential price up move when a slowing momentum starts to display some strength.
Requirements
Technical Indicators
- Exponential Moving Averages – 21, 42 & 63 Period
- Average Directional Index – 14 Period
- MACD – 12, 26, 9
Optional Indicators
- Stochastic
- RSI Indicator
- nsepy & get_history
- datetime
- pandas & numpy
- matplotlib.pyplot
- talib
Strategy Parameters
- EMA 21 has to be above EMA 42 which has to be above EMA 63
- ADX to be less than or equal to 25 & greater than previous day value
- Current MACD Histogram bar has to be higher than the previous day’s
- Optional filters like Stochastic & RSI can be added, however, it may significantly reduce the number of trades
Strategy Explanation
ADX is a technical indicator which helps us determine how strong or weak a trend is. Generally, during consolidation phases, the ADX falls while in a trending market it rises. A low ADX may also signal an interim weakness or consolidation in the overall uptrend or downtrend momentum.
Our strategy is to look for such opportunities and place a short term trade with any sign of strength displayed by this momentum indicator while considering a couple of other confirmations too.
Figure 1 illustrates how ADX works: From the left, as the price moves up, the ADX rises signalling a strong uptrend. And as it falls, you can see the trend losing momentum or price consolidating in the middle. And to the right, as the price falls, the ADX slopes up again signalling a potential downtrend.

In this strategy, we are looking to execute only LONG trades. Hence, the exponential moving averages chosen are 21, 42 & 63 to identify a market which is most likely trending up. When the ADX starts to slope up from the levels of 25 or below, we are anticipating the upward trend to start/continue.
To add an additional confirmation, we look for MACD Histogram, another momentum indicator from the MACD family, to also increase from its previous values.
Based on this we place a BUY trade at the end of the day and then carry our position forward T+3. In other words, at the end of day 4 from the trade date, we square off our position.
Data for Back Testing
Nifty Daily data from NSEPy for the period 1 Jan 2012 to 31 Dec 2020
Python Code
Step 1 - Importing Libraries, Extracting data from nsepy & Creating Technical Indicators
Step 2 - Strategy Codes
Step 3 - Return Calculation & Stats
Cumulative Return 1.4848092455641986
Hit Ratio - Train Df:  0.6666666666666666
count    78.000000
mean      1.213762
std       0.117640
min       0.990115
25%       1.123847
50%       1.210715
75%       1.296299
max       1.484809
Name: Cumulative_Return, dtype: float64
Step 4 - Plotting returns in a chart for visual analysis
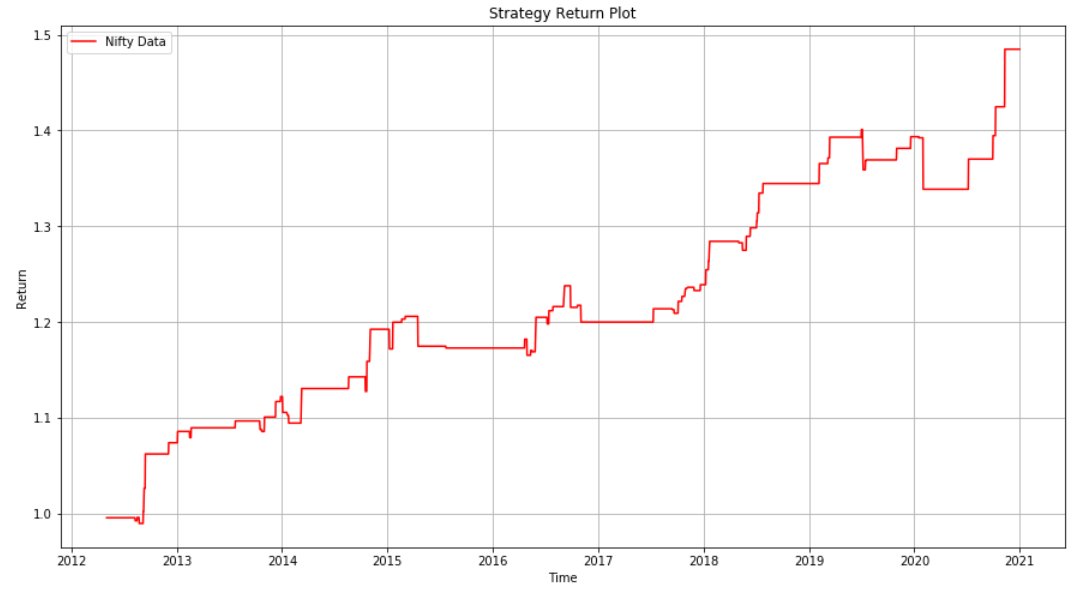
Back Testing Results - Explanation
- This strategy was primarily tested on Indices like Nifty & Bank Nifty from the National Stock Exchange (India)
- The range of this data series was 1 Jan 2012 to 31 Dec 2020
- With a total of 78 trades, the cumulative return of this strategy was about 48% while the hit ratio stood at 67%
Final Notes
- nsepy is a good data source for backtesting, however, this strategy may call for live data as the trades are placed and squared off just before the market closes for the day
- Like any other strategy, you may try several permutations and combinations with this one too and optimise your parameters
- Python codes are provided at the end of this article
If you want to learn various aspects of Algorithmic trading then check out the Executive Programme in Algorithmic Trading (EPAT). The course covers various training modules and equips you with the required skill sets to build a promising career in algorithmic trading.
File in the download: ADX - Strategy Final Code
Disclaimer: The information in this project is true and complete to the best of our Student’s knowledge. All recommendations are made without guarantee on the part of the student or QuantInsti®. The student and QuantInsti® disclaim any liability in connection with the use of this information. All content provided in this project is for informational purposes only and we do not guarantee that by using the guidance you will derive a certain profit.
