
This project is aimed to share an example about how to use quantitative techniques of online machine learning in trading strategies development and improvement.
Online learning allows for deeper automation of algorithmic trading in comparison with traditional regular model retraining with subsequent cross-validation. This is because such models can adapt their parameters on the fly while being used in real-time trading simultaneously.
The real production strategies are far more complex than the ones which are used in the project as examples and include much deeper automation of a wider range of parameters. Nevertheless, incorporated online models have universal application and could be applied to different kinds of trading strategies from passive investing to high-frequency trading (HFT).
This article is the final project submitted by the author as a part of his coursework in the Executive Programme in Algorithmic Trading (EPAT®) at QuantInsti®. Do check our Projects page and have a look at what our students are building.
About the Author

Evgeny Tishkin has over 10 years of various experience in algorithmic trading and HFT working at several proprietary trading firms and hedge funds as a quantitative developer, chief software architect, quantitative analyst and chief technical officer.
For one of the algorithmic hedge funds working as CTO, he created a complete low-latency multi-exchange algorithmic trading infrastructure and high-frequency trading framework from scratch.
Evgeny won 2nd place among more than 4000 quantitative researchers from 100 countries around the world in XTX Markets Global Forecasting Challenge in 2019.
Evgeny holds a master’s degree in computer science from Samara State Aerospace University. Additionally, he acquired a speciality in “Machine learning and data analysis” from Moscow Physical-Technical Institute.
Project Idea
The idea behind this project is to create a quantitative strategy that improves sector investing.
Stocks considered
I will take the Big Tech sector as an example and will take FANGAM stocks (Facebook, Apple, Netflix, Google, Amazon, Microsoft) + QQQ (NASDAQ 100 ETF)
Steps
I perform the following steps:
- Calculate equal part buy-and-hold investing starting from 2005.
- Calculate every month equal part rebalancing portfolio.
- Try to improve Sharpe and Calmar ratios using smart entries and exit based on statistical arbitrage ideas: online linear regression, online PCA, Kalman filter. "Online" means a day-by-day retrainable model for a lookback period which precedes the current day for which we calculate the forecast.
- Try to improve results from previous steps using market regime filtering using Hidden Markov Models
I omit trading costs here because they are negligible in low-frequency trading. I took the data from Yahoo Finance resource starting from 2005 to include the financial crisis of 2008-2009 years.
Techniques Used
I use the following techniques:
Monthly portfolio rebalancing
This rebalancing improved Sharpe but did not improve Max drawdown and made Calmar lower. When rebalancing I reallocate capital equally in each stock every month.
A more effective way to perform this procedure by measuring VAR for the whole portfolio using volatility and pairwise correlation information. This is a well-known approach based on Modern Portfolio Theory but this is out of the scope of this work.
Online Regression
Online means we train the model each day and take data for training with some lookback period from the dataset. Linear regression assumes a linear approach for modelling the relationship between target and explanatory variables.
In our case, I use linear regression to find optimal coefficients for the statistical linear spread between correlated stocks. Before applying this method I made sure all stocks in our portfolio are highly correlated with each other with a Pearson coefficient above 0.9.
Based on the results of everyday training I calculated residual (error) for a target for the current day. The usage residuals will be explained further. They are used for signalling when to buy or sell stock.
Online PCA (Principal Components Analysis)
PCA is an approach based on eigenvalues and eigenvectors of the matrix for extraction orthonormal non-correlated components of variance.
It is used for solving different problems in data analysis. I use it for factors or features extraction in the way described in this resource.
So a couple of principal components are extracted using PCA and used as features for approximating the target price.
Components are linear combinations of initial portfolio stock prices. Target stock price is predicted using these extracted features and online linear regression. Then we calculate residuals.
Kalman filter
Kalman filter is a well-known algorithm in statistics and control theory that uses time series of measurements (stock prices in our case) for producing more accurate estimates of target variables.
I use the Kalman filter for evaluating coefficients of online regression which explain target (target stock prices) variable buy “independent” variables (other stock prices from portfolio).
A similar approach is described in the book “Algorithmic trading: winning strategies and their rationale” of Dr. Ernie P. Chan but in application to statistical arbitrage. It is very similar to the online linear regression approach and calculate statistical spread coefficients but do not use a lookback period at all.
Instead of this period, the Kalman filter is parameterized by the "delta" parameter which influences the "adaptiveness" of the filter.
Hidden Markov Models
This model is based on the Markov process or Markov chains and assumes that there is another process Y with observable variables (stock prices for example) which depends on current Markov process X with hidden states (market “regimes“). Markov chain itself assumes that the probability of the next state depends only on the current state attained.
Expectation-Maximization algorithms are used for unsupervised extraction parameters of Gaussian distributions of observable variables (stock prices as an example) for each state and the sequence of hidden states themselves.
I consider the market regime (uptrend, downtrend, volatile market, congestion etc) as a hidden market state which could be characterized with a set of parameter distribution with specific parameters determined by optimization. Again I use an online variant of the training model. The states extracted could be used for filtering trading entries and exits.
Methodology
In these models, I use percent differences from the yearly exponential moving average of stock prices as features and targets. For the lookback period, I used one year (252 trading days).
Trading Approach
I try to decrease the risk of the portfolio using active portfolio management based on statistical arbitrage technics for entry and exit long-only positions. I use online day-by-day calculations to determine undervalued/overvalued states of stock RELATIVELY to other similar stocks in the sector.
Then I will use calculated residuals (target_value - predicted_target_value) as an indicator of RELATIVE VALUE of the stock. I will buy the stock on local lows and sell on local highs of their RESIDUALS. Residuals are calculated using the models described above.
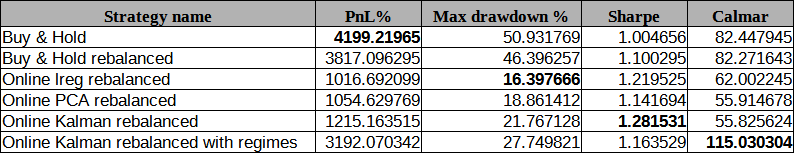
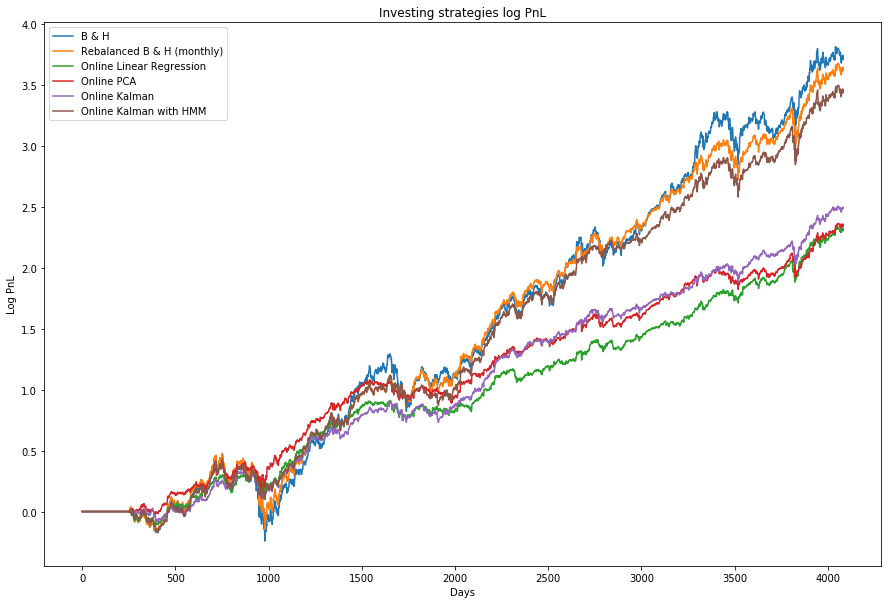
As a result, all models showed noticeable improvement of Sharpe ratio and Max drawdown which makes trading using them are more attractive in term of risk carried. But the Calmar ratio is decreased. I try to improve it using models’ exits filtering.
I try to increase time in potentially profitable positions via adaptive market regimes detection. While we are in a favourable regime for holding long positions we skip exits by residuals "overvalued" states.
As features, we take QQQ as a benchmark indicator of the sector and also add VIX to the dataset. QQQ is a NASDAQ 100 ETF that tracks the 100 largest non-financial companies listed on the Nasdaq stock exchange. VIX is a real-time market index representing the market's expectations for the volatility of the S&P500 index (as a market benchmark) over the coming 30 days.
We will use their deltas and also add forward target (price delta with future prices also 30 days ahead) to the dataset allowing the model to extract states considering target also! This is a trick.
In the case of the online hidden state where the target variable is above zero, we skip exit and proceed to hold long positions till the state become unfavourable.
Result
As a result, the risk taken is higher and Sharpe and Max DD become worse still above the Buy & Hold baselines. And what is important Calmar ratio is increased and exceeds the baseline also.
You can see the strategies comparison table and chart below.
Summary
So, the key takeaways and learnings from this project are:
- Stocks relative pricing could be used for more effective entries and exits price points selection.
- For the relative price, we could take prices of other correlated instrument prices for example from the stocks of the same sector and put them as inputs into some quantitative model for calculating the fair price of a concrete stock.
- Residuals from the fair price are a suitable measure of overvalued/undervalued states of stock.
- Online machine learning helps to build automated real-time pricing models.
Conclusion
The approach applied is too simple to beat the market (Buy & Hold strategy) in terms of Total Profit because it does not use anything but the simple end of day Close price of stocks.
However, we have managed to overcome Buy & Hold strategy risk by using multiple entries & exits determined by online relative pricing techniques.
If you want to learn various aspects of Algorithmic trading then check out the Executive Programme in Algorithmic Trading (EPAT). The course covers various training modules and equips you with the required skill sets to build a promising career in algorithmic trading.
Files in the download
- data_bigtech - Excel file
- epat_project_evgeny_tishkin - Python notebook
Disclaimer: The information in this project is true and complete to the best of our Student’s knowledge. All recommendations are made without guarantee on the part of the student or QuantInsti®. The student and QuantInsti® disclaim any liability in connection with the use of this information. All content provided in this project is for informational purposes only and we do not guarantee that by using the guidance you will derive a certain profit.
