
By Kristof Leroux and Rekhit Pachanekar
As a quant trader involved in quantitative trading, you are always on the lookout to create and optimise your trading strategies. Backtesting forms a very important part of this process. And for backtesting, access to historical data is a necessity. Once your historical data is downloaded and structured as a dataframe, the natural next step is technical analysis using Python building indicators directly from that OHLCV data using pandas and numpy. But it’s a very daunting task to find decent historical price data for backtesting your trading strategies.
While a simple google search can give you the end of day data for any stock, it can be a task to download and get it ready for your strategy code. If you are creating a portfolio which requires a number of different asset classes, then the time required would be immense. Wouldn’t it be simpler if you could just run a few lines of code and receive the data.
This blog will do just that. We will look into free and paid solutions, all of which have an easy to use Python Stock API wrapper around their services. For each type of solution, we will look at which asset type (stocks, ETF’s, FX, commodity futures, options, treasury and even crypto). These resources provide information for and how to retrieve it in various ways with - of course - an example in python code.
To further enhance your approach to cryptocurrency trading, explore our Crypto Trading Course, which covers key strategies like calendar anomalies, Ichimoku Cloud, Aroon, and RSI indicator.
This article is structured as follows:
- Free solutions for Historical Data using Python stock API
- Yahoo! Finance - Getting data using Python stock API
* Getting data of a single asset using Python stock API
* Getting data of multiple assets using Python stock API
* Getting data of different types of assets using Python stock API
* Getting data with different time frequencies using Python stock API
* Caveats of getting data from Yahoo! Finance - Quandl - Getting data using Python stock API
* Caveats of getting data from Quandl
- Yahoo! Finance - Getting data using Python stock API
- Resources to get Free Historical Data
- Paid solutions for Historical Data using Python stock API
* Alpha Vantage - Getting data using Python stock API
* Twelve Data - Getting data using Python stock API - Resources to get Paid Historical Data
Free solutions for Historical Data using Python Stock API
Before moving on to getting historical stock market data analysis using Python Stock API, here is comprehensive tutorial on creating your own Python trading bot and delving into the exciting world of algorithmic trading.
Getting financial data from the right source is important. While many free data providers exist, you have to make sure that the quality is good. The issue with free data is that there could be some inconsistencies in the readings, or sometimes a few fields as well.
Thus, always do a check on the data once you have retrieved it. Now, let’s see some providers in detail.
Yahoo! Finance - Getting data using Python Stock API
Yahoo! Finance is part of Yahoo’s network and was sold in 2017 to Verizon Media.
It is the largest business news website in the United States by monthly traffic and provides financial news, data and commentary including stock quotes, press releases, financial reports, and original content.
They provide market data on Cryptocurrencies, regular currencies, commodity futures, stocks and bonds, fundamental and options data, and market analysis and news. Yahoo Futures data is also widely referenced for tracking futures market trends and insights. If you also want to learn more, you can explore our futures trading course here.
Yahoo used to have its own official API but this was shut down in 2017, it went back alive somewhere in 2019.
The code examples are made in Google Colab, but can, of course, be executed within any jupyter notebook server or local python file (with the dependencies installed beforehand). We will use the famous matplotlib to chart our data.
Getting data of a single asset using Python stock API
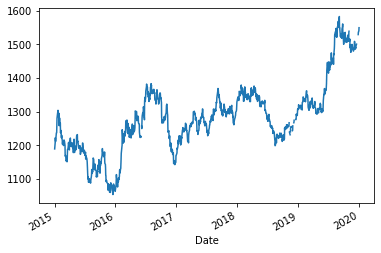
For starters, we begin with the retrieval of the daily historical price data of a single ETF, let’s use SPDR S&P 500 ETF Trust (SPY) as an example, and plot these data.
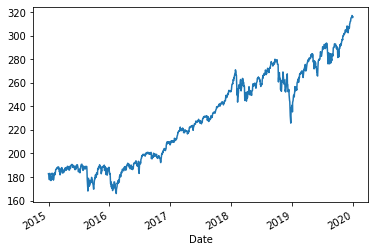
That was easy right? With only a couple of lines of code, we could retrieve a lot of data points and visually present them to the user.
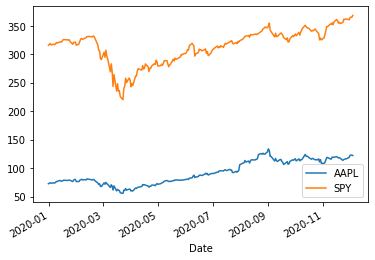
Getting data of multiple assets using Python stock API
In most cases, we will need to retrieve more assets at the same time. By simply extending our last example to also retrieve the data Apple (AAPL), we would come to this:
Getting data of different types of assets using Python stock API
Along with the stock market, Yahoo! Finance gives us access to a variety of different assets.
Here is an example in which we retrieve historical data for the crypto coin Bitcoin in USD (BTC-USD), the currency pair (EURUSD=X), a commodity future like Crude Oil (CL=F), an ETF (ARKK), a specific call option on Apple (AAPL210115C00018750) and a US Treasury bond (10 years) (^TNX).
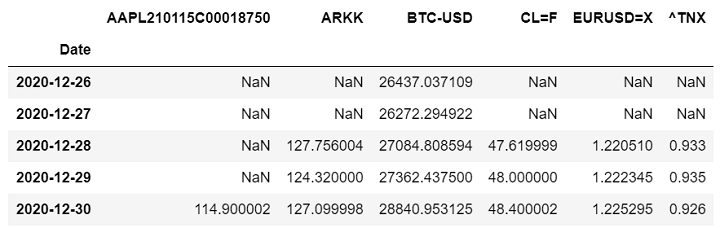
Do note that options have an expiry date and the call option “AAPL210115C00018750” expired on 15 January 2021. Thus, the data might show NaN after expiry.
Getting data with different time frequencies using Python stock API
All the different examples mentioned so far gave us a data point for each day, which is good for backtests over long periods of time. But sometimes we need more granularity to test our strategies like a data point for each hour, every 30 minutes or even each minute.
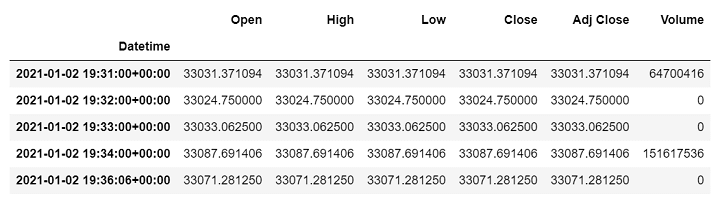
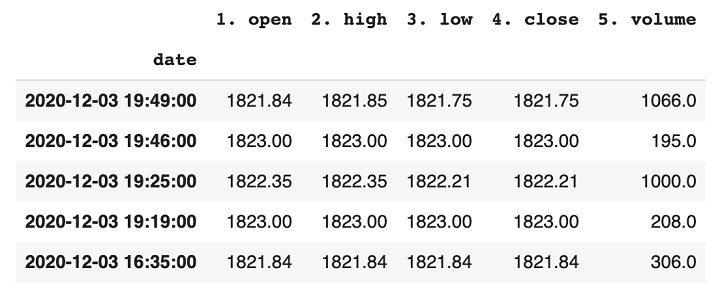
In this example, we get the price history data of Bitcoin in USD for the last 5 days with a minute frequency, so we will get price and volume data for each minute during these 5 days.
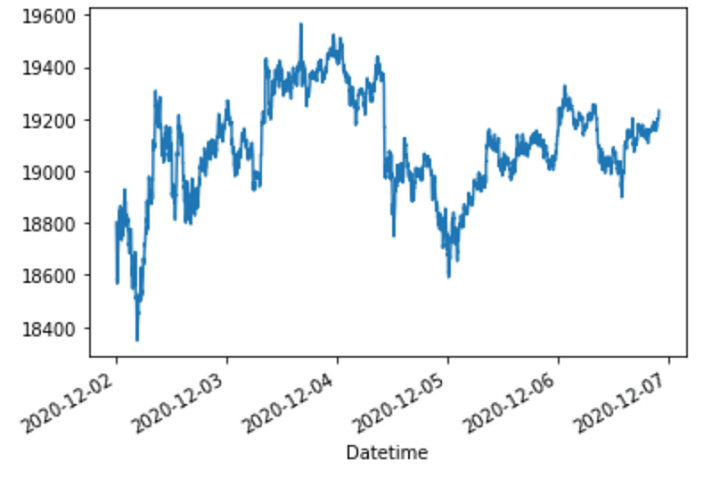
It is not evident that the data is of minute frequency. Thus, let us see the table containing all the data.
Input: data.tail()
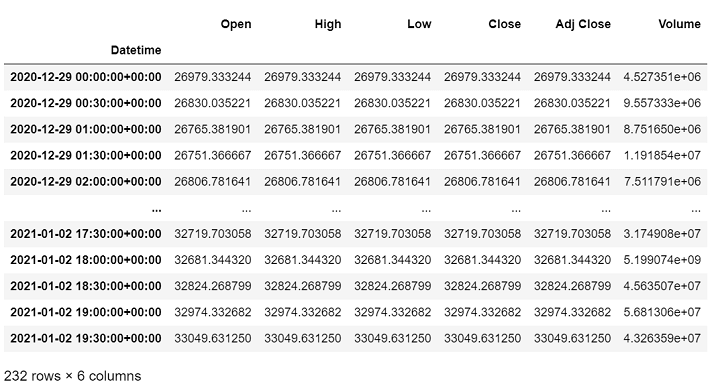
You can also resample the data into 30 minute time periods if you want, by using the “resample” function.
Here, “30T” means time of 30 minutes and “.mean()” indicates that we are taking the average of all the values from the 30 minute time period.
Input: data.resample('30T').mean()
Caveats of getting data from Yahoo! Finance
Although Yahoo! Finance is free, it’s API is also unstable at times. So if this concerns you a lot, you will have to look at alternatives or even paid solutions.
Quandl - Getting data using Python stock API
Quandl was founded in 2011 and Founder Tammer Kamel wanted to create a new Wikipedia for Numeric Data. They don’t work with providers but scrape everything from websites or other sources they can find.
The result is Quandl became a sort of "search engine" for numerical data.
Quandl Python API delivers all its data in standard form, so you find your desperately needed data fast and use it out of the box.
Quandl has indexed 2 million financial and economic time-series datasets, including:
- 85 global stock market indexes;
- spot and futures prices for 70 commodities and 10 commodities indexes;
- 60 futures contracts with prices, commitments, and historical and continuous contract data;
- exchange rates against US dollar for 200 currencies; and
- global overviews which provide snapshot data for key stock indexes, commodities prices, interest rates and exchange rates.
To use Quandl, you will need a free API-key to get access to the Quandl API.
Create an account at Quandl, after setting everything up, you will find your API KEY in your account settings. So don’t forget to insert your key in the example code.
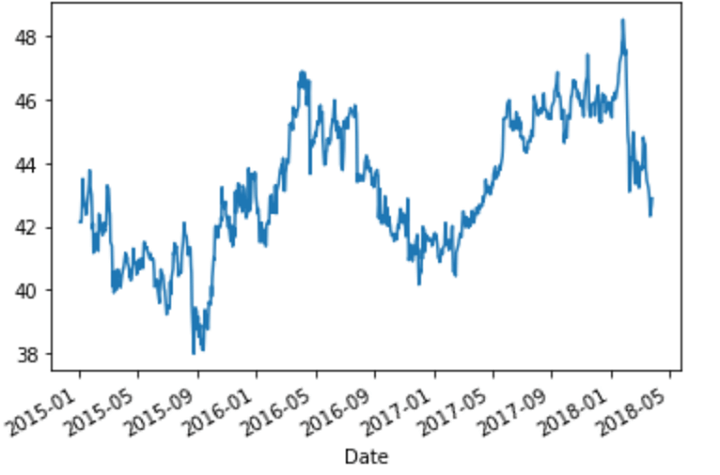
In the next example, we will get historical price data from Coca-Cola from the last 5 years.
You can even access continuous futures data from Quandl, as shown below:
Caveats of getting data from Quandl
Quandl offers a lot for free but also has paid premium services, the most premium data do have sample data you can use for free.
Check this for all data available and whether it is free or paid premium.
Resources to get Free Historical Data
There are a lot of other options available for getting free historical data like
- FXCM
- Google Finance (even in spreadsheets)
- Alpha Vantage
- World Trading Data
- Intrinio
- EOD Historical Data
- TwelveData and IEX
Suggested reads:
- How to Use Financial Market Data for Fundamental and Quantitative Analysis
- Stock Market Data And Analysis In Python
Paid solutions for Historical Data using Python stock API
As your requirements for data sets increases, you will find that the historical data provided by free resources to be incomplete. It is at this point where you would look for paid solutions.
Depending on your budget and requirements, there are a plethora of options. Let's look at a few ones in depth now.
Alpha Vantage - Getting data using Python stock API
Alpha Vantage can be said as a new entrant, considering the fact that they were founded in 2017 and are a part of the accelerator Y combinator.
Alpha Vantage is creating APIs from aggregated data from all kinds of financial information sources into one centralized place and allows users to share the data with other users.
They also use supervised machine learning algorithms that continuously improved the data quality based on user feedback.
In other words, the more users of Alpha Vantage, the more intelligent the system grows. Through this, the constant feedback of data allows more information to be brought into the cloud.
They support stocks, foreign exchange and crypto historical data, technical indicators, and sector performance.
Twelve Data - Getting data using Python stock API
Twelve Data was founded in 2009 and is getting more traction lately.
The main features of the services they provide include:
- Real-time and historical data via API
- Plotting dynamic charts
- Large technical indicators list (~100)
- Quote streaming via WebSocket
The main goal of the TwelveData project is to create a single place where all Pythonistas will get instant access to all financial markets and its analysis only with a few lines of code.
As with Quandl, we first need to sign up on their website and get our API_KEY here . Again don’t forget to insert your key in the example code.
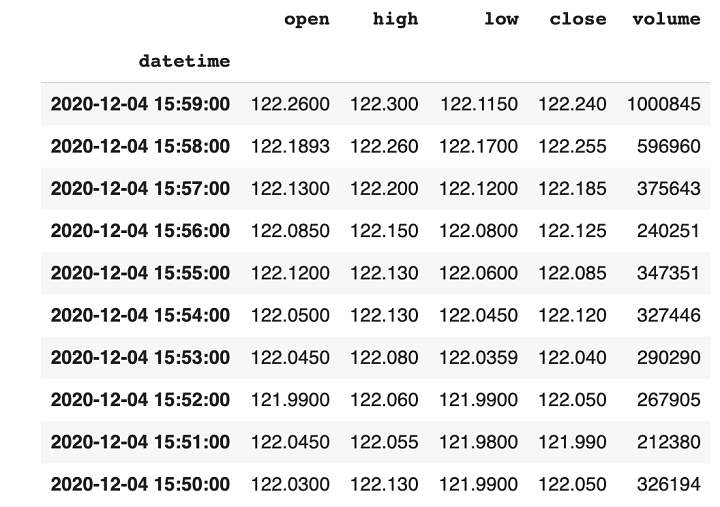
We will try to accomplish something similar as we did with Yahoo! Finance API. Here we are retrieving the minute frequency price/volume data from Apple (APPL), we only ask for 10 data points and we can even set our timezone to datetime stamps that can be transformed automatically to your timezone.
Resources to get Paid Historical Data
As was the case with the free solutions, there are also a lot of alternatives to Twelve Data and Alpha Vantage, a non-exhaustive list would be:
- Kinetick
- Quanthouse
- Trading Economics
- Thomson Reuters Refinitiv
- Activ
- Morningstar
Additional Suggested reads
- Turning data into insights and building strategy using Python
- Converting Tick-By-Tick Data To OHLC Data Using Pandas Resample
Note: All the sources mentioned in this blog are to be viewed as examples only. We do not endorse them and nor should we be held responsible for any issues with respect to the data quality or correctness of the data that they offer.
Conclusion
As we have seen, there are a lot of options to get historical price/volume data.
The greatest differences are:
- free or paid,
- a stable API or not,
- quality of data,
- the amount of asset types they provide, and
- the size of the datasets.
You have seen not only the different data providers but also how to extract data from them using the Python stock API.
As we have said before, access to good quality historical data is an important part of backtesting your trading strategy. These data providers are free as well as paid. You can check out the course on Quant trading strategies and Models to know how you can create and backtest different trading strategies.
Disclaimer: All investments and trading in the stock market involve risk. Any decisions to place trades in the financial markets, including trading in stock or options or other financial instruments is a personal decision that should only be made after thorough research, including a personal risk and financial assessment and the engagement of professional assistance to the extent you believe necessary. The trading strategies or related information mentioned in this article is for informational purposes only.
