Macroeconomics is a vast topic, but at its core is similar to the financial planning of a family. Every family knows that they have to balance their income, expenditures and savings. We use a simple equation here, Income = Expenses + Savings, hoping that the Savings component is maximised every time. Macroeconomics is similar, except it deals with the entire country’s money! Or in some cases, even a group of countries.
Let us go through the topics discussed in this blog:
- Definition of Macroeconomics
- Brief History of Macroeconomic Policies
- Macroeconomic factors
- Macroeconomic policies
- Macroeconomics and the Financial markets
- Resources to learn about macroeconomics
Definition of Macroeconomics
Macroeconomics is the study of the forces affecting the national economy as a whole. The government of a country tries to look at factors such as the GDP, unemployment rate, inflation rates and formulates policies to keep them at healthy levels. Compared to microeconomics which looks at the individual consumer or company, macroeconomics looks at the big picture and checks how the country is performing. Furthermore, depending on its goal, the country develops the monetary and fiscal policies to steer the economy towards a bright future.
Wait! While Macroeconomics can be complex and simply cannot be covered in one article, we will try to focus on a few key concepts. Just remember one thing, whether it is the family or the government, everyone wants you to have a better future than today.
Before we delve into the factors, let us go through the past to understand how macroeconomics has evolved over the decades.
Brief History of Macroeconomic Policies
While there have been a lot of theories in the past, it is said that the quantity theory could be the first to look at the big picture. One if its version, by Irving Fisher was simply,
M * V = P * Q
Where,
M = Money supply
V = Money velocity (Number of times the unit of currency used to purchase goods/services at a certain time)
P = Price level
Q = Quantity of goods produced.
In normal scenarios, we usually have money velocity and Quantity of goods produced as constant. Thus, increasing the money supply (M) would lead to an increase in price levels.
For example, let’s say the economy consists of only one good, i.e. a mobile phone. Now, if we increase the money supply, it means more people have more money. Now they all want to buy a mobile phone, but the quantity of mobiles being produced is constant. According to the normal supply-demand situation, the manufacturer increases the price of mobile phones, discouraging some buyers. Thus, even though we had an increase in money supply, the increase in price level negated it.
Fun fact: This is exactly how inflation works and essentially, the central banks of most countries or the federal reserve in the U.S. does on certain occasions to make sure the economy doesn’t hit a bump on the road.
While this equation holds true in most scenarios, sometimes it could falter. How?
It is assumed that usually lowering the prices of goods would help in clearing them. However, in the time of the great depression, the economists couldn’t explain how goods were left unsold and workers unemployed.
At this point, Keynesian economics took hold and evolved into the field which is now considered macroeconomics. While not the actual reality, it was seen that as the recession started, companies started spending less on goods. Even the common man started holding on to money rather than spending it somewhere. This created a multiplier effect as nobody was willing to spend more than necessary. Thus the economy declined sharply and resulted in the great depression.
While there are several theories and schools of thought, it is generally agreed that the economy should be a mix of free-market and government managed to make sure it doesn’t become unstable.
Let us now get down to the basics and understand the parts of the big picture we call macroeconomics.
Macroeconomic factors
As we have said before, macroeconomics looks at the big picture, i.e. how is the economy performing? To help us answer this question, macroeconomists have come up with certain factors which are as follows:
Gross domestic product (GDP)
In simple terms, GDP gives us the monetary value of how much the country produces in a year. Think of a family which comprises 2 sons and 2 daughters. The sisters produce electric bicycles which cost them $1 million. While the brothers built customised bike engines which cost them $1 million. Thus, you will say that the family’s GDP was $2 million in a year.
In a similar manner, you will calculate the monetary value of all the products which are made in a country.
To give you an idea, here are some GDP figures for the year 2019:
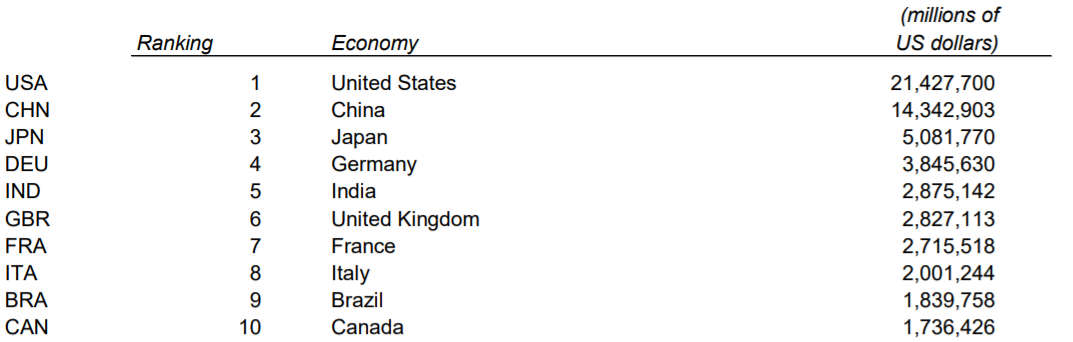
(Source: Gross domestic product 2019)
Yes, you are right in wondering how you get these figures, considering a country has so many different sectors and private as well as public enterprises. Usually, the country has a dedicated governmental agency which collects and calculates the country’s GDP figures.
In fact, you can also see the world GP over the years, as given below:
How do you calculate the GDP?
Broadly speaking, there are three ways to calculate the GDP, which should give you the same figure. Let’s see what these are:
A. Output (or production) method - In this method, you calculate the final value of all the goods produced, but subtract the value of any intermediate goods consumed in the process. Taking the family’s example, if one electric cycle is valued at $1000, but the steel and material used is worth $700. Then the final value will be $300.
B. Expenditure method - This method is a bit opposite to the earlier method, where we calculate the spending in the country. A simple formula for the expenditure approach is as follows:
GDP = C + G + I + NX
Here, C refers to consumption by mostly individual or private companies.
G refers to Government spending,
I represents an investment in capital goods
NX = Exports - Imports
In simple terms, it is assumed that any spending will occur in either of the four terms and thus, if add them all up, we will get the value of total spending or expenditure, which is called the GDP.
C. Income approach - As the name implies, the income approach simply tells us to add up all the wages, rents, interests or profits earned. This will tell us how much the country earned and is the GDP.
This was an oversimplification of the approach to calculating the GDP. In the real world, we also have to take into account the inclusion (or exclusion in some cases) of taxes, subsidies and rebates, which could distort the real number.
Another factor which is important while calculating the GDP is the effect of inflation.
But why is Inflation so important?
The GDP figure which does not take into account the inflation is called the nominal GDP. Now suppose the GDP of a country stood at $100 million in 2018. Due to certain factors, the country actually produced the same number of units in all sectors. But due to inflation of 5%, the nominal GDP stood at $105 million.
Hence, to an outsider, it would look like the country’s economy grew by 5% when the reality was that nothing changed. Thus, we used GDP adjusted for inflation to get a clear view of how the country is performing. This is called Real GDP.
Real GDP is always counted with reference to a base year. For example, the base year in the US is 2012 while in India it is 2011-12.
But now you are wondering how different countries can be compared to each other. For example, while India and the UK are close to each other when it comes to the GDP figures, the population figures are totally different.
This is why you use Real GDP per capita to understand how countries are performing. Thus, even though India might have a GDP figure larger than the UK, it is worse off since it has to distribute this number with a larger population.
The GDP per capita is given below:
Some macroeconomists have gone further and use the purchasing power parity (PPP) for comparing different economies. Purchasing power parity tries to compare similar expenses among different countries.
For example, in the table below, we see that for a similar expense of rent, you have to pay ten times more in country A than B. Thus, the PPP in country A is 10 times country B.
|
Type of expense |
Country A |
Country B |
|
Rent for 2 room flat |
1000 |
100 |
|
Food and groceries |
500 |
50 |
|
Total |
1500 |
150 |
Let us move further on the next macroeconomic variable.
Unemployment Rate
The unemployment rate is simply the percentage of the working population which is unemployed. There are two types of unemployment:
- Frictional unemployment: In this type, the unemployment is due to the people in between jobs or the transition period between two jobs.
- Cyclic unemployment: As the economy contracts or grows, certain jobs can become redundant and companies are forced to let go of its employees.
A low unemployment rate indicates that the economy is sufficient to generate new jobs as new people enter the workforce. Think about it, if there is high unemployment, it leads to people taking the first jobs they get. For example, a highly qualified specialist would take up a job as a pizza delivery person since there are no jobs for their specialisation. This leads to dissatisfaction in the employed workforce as well as unrest among the unemployed.
But if a low unemployment rate is good for the economy, is 0% unemployment the best?
The answer is not as straightforward as it seems. Research suggests if there are no unemployed people, there is no competition among the workforce and companies might be inclined to hire unskilled workers or the first person to apply for a job. This can lead to reduced efficiency and ultimately slow down the progress of the economy.
Thus, while a low unemployment rate helps stabilise the economy, 0%, as well as a high unemployment rate, is undesirable.
Let’s move to the next vital macroeconomic variable
Inflation rate
The inflation rate tells us how much the price of a good has increased. For example, if one loaf of bread was priced $1 in 2019 but increased to $1.05, then we would say the price inflated by 5%.
In a similar manner, the inflation rate for an economy is calculated by identifying the price level for a certain basket of goods. These will include food items, apparel, housing, electronic items, education expenses, etc. Once these items are identified, you calculate the price levels every year to get an estimate of how much the inflation has reached.
The inflation rate of the world is given below:
Does high inflation mean bad news for the economy?
The answer to this question is complicated because at first glance you would like to say yes. But if you get down to the basics first, let’s answer why inflation occurs?
It is a simple case of demand and supply. If there is a demand for a product with less supply, the prices are bound to rise. In normal scenarios, inflation can be an indicator that the economy is actually booming.
Taking the example of mobile phones used earlier, if the price is increased and people still buy it, it will be a sign that the existing environment is not able to meet the demand. Thus, new entrants would enter the market leading to more jobs, goods produced and in turn more spending, which increases the GDP.
In fact, during the 2000s, India and China had a high inflation rate along with high GDP figures. Of course, there are cases when the economy could crash heavily due to unchecked inflation, called hyperinflation. Thus, governments and central banks always keep an eye on the inflation rate to make sure it does not go haywire.
This brings us to the next macroeconomic variable.
Interest rate
The interest rate is another macroeconomic variable which tells us the state of the economy. The interest rate is decided based on the inflation rate as well as the liquidity requirements of the economy.
The federal reserve in the U.S. keeps revising the interest rate to keep a check on inflation. We will talk about the Federal reserve’s role later on in the blog.
A low interest rate usually encourages companies to borrow money which is then used for expansion and in turn helps the economy grow. However, if the inflation rate keeps on increasing, the interest rate is increased, which discourages individuals and companies from borrowing and in turn, reduces the liquidity in the market. Thus, the demand is usually lowered and inflation decreases.
These were a few macroeconomic variables which help us understand the state of the economy. But can we control these factors?
In a manner of speaking, yes. Let’s find out how in the next section.
Macroeconomic policies
There are namely two types of policies which are used to give optimum macroeconomic figures.
Monetary policy
The monetary policy is decided by the central government such as the Federal Reserve in the US. The central bank usually sets the interest rate levels for banks which in turn control the liquidity of money in the economy.
For India, The RBI sets the policy and implements various measures such as setting the repo and reverse repo rate to make sure that the Indian economy is functioning smoothly. To understand more, you can visit the official website here.
Similarly, the Monetary Authority of Singapore implements the monetary policy in Singapore.
Fiscal policy
The government sets the fiscal policy for the economy by announcing special plans for certain regions or industries and even giving stimulus packages to certain sectors in times of hardship. The tax structure can also be amended to either stimulate the economy or prevent it from overheating. The government can influence the GDP of the country by investing in key projects which are too large for private enterprises.
Do the macroeconomic factors and policies impact the financial markets? Let’s find out in the next section.
Macroeconomics and the Financial markets
Think about it, you are an investor looking to go long on a pharmaceutical company. During a recent budget session of the government, it was announced that the tax on pharmaceutical products will be reduced by 20%.
You know that this would lead to an increase in revenue for pharmaceutical companies. You will immediately buy the company’s shares. Other traders share this sentiment, and in a short time, the company’s stock price has increased. And at this time, there has been no change in the working of the company.
Let’s take another case, a company is in the growth phase and looking for expansion in other markets. Thanks to the reduction in the lending rate, the company gets access to credit and uses this money to establish a factory in another region. Since the company’s products are already in demand, traders know that the new factory will add revenue to the company. Thus, the company’s share price increases.
During the Trump administration, certain policies were formulated to promote manufacturing in the U.S. itself. This provided incentives to source locally made products instead of sourcing products from outside the country. This impacts the companies who are heavily reliant on other countries and do not find good quality replacements among the local communities. However, a company can take advantage of these policies and cater to this market which did not exist before.
In contrast, certain economies formulate their policies to attract foreign investment. Earlier a closed economy, India opened its door to foreign investments with a series of reforms starting from 1991. This has led to economic progress and made access to foreign capital benefitting both the investors as well as the Indian companies. The IT sector has flourished due to these policies.
These were some examples of how macroeconomic factors can influence stock prices. It is well known that the US stock market experiences a short term jump every time the Federal Reserve reduces the interest rate. Thus, some traders actually schedule their trades on days the Federal Reserve schedules their meeting. You can learn more about these types of event based trading methods in our course on event-driven strategies.
How do you learn about macroeconomic factors further? Let’s see in the next section.
Resources to learn about macroeconomics
The following are a few books which are used by students of economics at a graduate or postgraduate level as well
- Principles of Macroeconomics, by N. Gregory Mankiw
- Macroeconomics: Principles, Problems, & Policies, by Campbell McConnell, Stanley Brue, Sean Flynn
- Macroeconomics, by Paul Krugman; Robin Wells
- The Macro Economy Today, by Bradley Schiller and Karen Gebhardt
- FRED, Federal Reserve Bank of St. Louis. Data base to get macroeconomic time series data.
- World Bank Open Data | Data
With the advent of digital learning, you can also enrol for e-learning courses on various web platforms to study macroeconomics.
Conclusion
Macroeconomics is the study of quantitatively assessing how an economy is performing. You have gone through the different macroeconomic factors such as the GDP, unemployment rate and interest rates. You have also understood how fiscal and monetary policies affect these macroeconomic variables. Further, you have seen how macroeconomic factors can influence the stock markets.
Disclaimer: All data and information provided in this article are for informational purposes only. QuantInsti® makes no representations as to accuracy, completeness, currentness, suitability, or validity of any information in this article and will not be liable for any errors, omissions, or delays in this information or any losses, injuries, or damages arising from its display or use. All information is provided on an as-is basis.