For a trader, the knowledge of trading ideas is a boon since it leads to the success of your trades. We will discuss these essential aspects in this article about trading ideas.
This article covers:
- What is meant by trading ideas?
- Sources to generate trading ideas
- Evaluating and backtesting the trading ideas or strategies
What is Meant by Trading Ideas?
Trading ideas are simply the scenarios you build as the blueprint for actual trading or before executing the trades in the stock market. For instance, when you see that a stock moves in a particular direction in a situation, you anticipate its high as well as low movements and the time frame.
Hence, a repetitive occurrence is what makes you a bit certain about the movement of the stock. Although you can not be completely sure about the anticipated direction, you can at least increase the likelihood of gaining more with the help of trading ideas.
Let us move forward, and find out the ways to generate trading ideas.
Sources to Generate Trading Ideas
The main source for generating trading ideas should be more of your experience and learning than the clearly pointed out rules. It is of utmost importance that you carve your own successful path in trading and for that, you need to generate trading ideas.
Below, we have enlisted the most important things which can help you take the right steps and these are:
Free resources
- Blogs & forums
- Research papers
Premium resources
- Learning from experts and their experiences through courses
- Books
Blogs & forums
Blogs and forums help increase your knowledge of trading and trading strategies.
You can go through the complete list in this unconventional guide to the best websites for Quants.
Some of these websites & forums are:
- Quantitative Trading (Ernest Chan)
- Quantpedia
- ETF HQ
- Elite Trader Forums
- Wealth Lab
- Quantocracy
- Machine Learning Mastery
- Blackarbs
- QuantConnect
- KDnuggets
Research papers
Research papers play a crucial role since you get to learn in depth and understand the robustness of different trading factors observed over a period.
For example, Jegadeesh and Titman conducted research on momentum trading and found that stocks that performed the best over a three- to 12-month period tended to perform well over the subsequent three to 12 months. While this research was mainly conducted in US markets and even other developing countries, you could try creating a similar trading strategy and backtesting it in other markets or assets to see if it works there. For a structured approach to doing this, the Quantra course on backtesting trading strategies python covers the complete process from data sourcing to performance evaluation.
Some of the well-known websites for finding research papers are:
Also, you can learn to use research papers with the course on Event Driven Trading Strategies. By possessing this skill, you can study the research papers for gaining immense knowledge.
Learning from experts and their experiences through courses
For understanding and learning trading, one very successful way is also to be in touch with successful traders. For creating a professional network you can use LinkedIn and be active on various platforms and forums, this helps understand the movements of the market along with the actions that these traders take. Since there are many strategies existing, you can do a constant study on what works best for each trader and in which situation.
Find out which strategy works for whom in what situation and then create your own trading strategy. If you are exploring options as part of your strategy toolkit, a good starting point is to revisit options trading basics before building your own approach.
Learning helps build confidence in your knowledge and enables you to utilize strategies for various trading opportunities. Quantra's courses on trading are an excellent resource, offering multiple options in categories such as:
- Data Science
- Sentiment Trading
- Forex and Cryptocurrency Trading
- Quantitative Trading
- Machine Learning
- Options Trading
- Python for Trading
- Jobs Preparation
If you are new to automating strategies, the Automated Trading for Beginners learning track is the ideal starting point among these resources. Designed with expertise and inbuilt theory, practical knowledge, infrastructure, data, community support etc. they help a quick grasp of various trading ideas. Althemore, these courses are the extract of hundreds of hours of research and study, which is presented in an easy to understand language and setup.
Institutions/co-authors/experts which contribute to the above courses and learning tracks:
- MCX
- NSE Academy
- FXCM
- Interactive Broker
- Multi Commodity Exchange
- Thomas Starke
- Dr. Terry Benzschawel
- Dr. Ernest Chan
- Laurent Bernut
Books
Books on trading are extremely helpful in gaining a lot of knowledge, requiring time and effort to study. And if you enjoy reading books, you will not regret going through these essential books on Algorithmic Trading or this reading list for trading enthusiasts.
Here you will find all the books which are knowledgeable with regard to contemporary and automated forms of trading.
Here’s an interesting list that can be of immense help to get the best out of trading:
- Quantitative Trading: How to Build Your Own Algorithmic Trading Business (Wiley Trading)- Dr Ernest Chan
- Algorithmic Trading and DMA: An introduction to direct access trading strategies- Barry Johnson
- Option Volatility & Pricing: Advanced Trading Strategies and Techniques- Sheldon Natenberg
- Volatility Trading- Euan Sinclair
- Python for Finance - Yves Chan
- Derivatives Analytics With Python - Yves Chan
- Listed Volatility & Variance Derivatives - Yves Chan
Let us move forward and check out how backtesting and evaluating trading ideas/strategies is important.
Evaluating and Backtesting the Trading Ideas or Strategies
Evaluating trading strategies helps you improve your trading outcomes by using statistical analysis and measures the performance (strengths and weaknesses) of your trades. For traders who want to build indicator-based signals from scratch, our guide on technical analysis using Python walks through the full implementation of moving averages, RSI, Bollinger Bands, and ATR with complete Python code.
Learning the Advanced algorithmic trading strategies will help you with applying the right strategy for your trades.
There are some metrics to find out the potential risk in your portfolio, on the basis of which you can decide your trading strategy. These known metrics are:
- Annualized volatility - This implies the standard deviation of the daily returns of a model in a year. As volatility is the measure of risk, the higher the volatility, the riskier the strategy will be.
The formula for annualized volatility is $$σ_{P} = σ_{DAILY}{\sqrt P}$$
Above, P= no. of trading days
$$σ_{P}= Standard\;deviation\;of\;number\;of\;trading\;days\;or\;252\;days$$
$$σ_{DAILY}= Standard\;deviation\;of\;every\;day$$
Or Daily percentage change = (Current closing price - Yesterday’s closing price)/100
You can find out the daily percentage change for an year on Excel by applying the formula. Then, you can find out the standard deviation of the total of daily percentage change and multiply it with the square root of 252 which is the number of trading days.
This calculation will give you the percentage of movement of a stock or the index. This percentage can help you predict the market, and on the basis of this prediction, your trading strategy’s performance can be evaluated. Although, this may not provide you with the exact movement of the stock or index, it still is considered a reliable calculation.
- Sharpe ratio - This is the ratio of Annualized return/Annualized volatility which implies the reward/risk ratio or the risk adjusted returns of a particular strategy.
Sharpe ratio is given by the following equation:
Sharpe ratio = (Rp - Rf) / σ
Where,
Rp= Mean portfolio return
Rf= Risk-Free rate
σ= portfolio’s standard deviation
For example, Suppose you expect that your portfolio has an annualized return of 12%. If risk-free rate is 7% and your portfolio carries a 8% standard deviation. The Sharpe ratio for your portfolio would be calculated as:
Sharpe Ratio = (12% - 7%)/ 8% = 0.625
This ratio helps you to find out if your strategy takes care of your reward as compared to the risk present in the market.
- Maximum drawdown - The maximum drawdown is the measure of maximum high to subsequent low before the new high is reached in the stock trend.
In your trading or investment period, your portfolio reduces in value multiple times. These reductions in value are known as drawdowns. The maximum of these drawdown values gives us an estimate of maximum loss a portfolio can incur. Technically, it is defined as the maximum loss from peak to trough for a portfolio.
It can be expressed in the formula as :
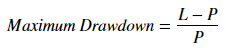
where,
P = Maximum value before the largest drop
L = Lowest value before the new high
Let’s say your portfolio has an initial value of $10,000. It increases to $50,000 over a period of time, before falling to $7500. It then rebounds to $55,000, before falling again to $48,000. The maximum drawdown, in this case, is
(7500 – 50000) / 50000 = -85%.
A low value of maximum drawdown is preferred as it indicates that losses from investment in the portfolio are less. In other words, there won’t be any significant loss of your capital. This feature is sought by large institutional investors.
Moreover, an experience in the trading domain brings you a whole lot of knowledge that you can not receive from only the theoretical sources. When you are an experienced trader, you realise that the emotions are of no use in the market. Hence, your trading ideas and strategies are supposed to be based entirely on logic. Here logic is to find out the edge in the market and by understanding how the performance of the stock has been, it is possible to anticipate the future performance. Although, by analysing the past performance of the market there is no guarantee that the performance will go as anticipated.
Then eventually once you gain experience and confidence with regard to the decisions you make, you can start off with different types of trading such as scalping and so on.
Backtesting
Backtesting is the process of testing a trading strategy using historical data to determine the effectiveness of that strategy. Backtest results usually show the strategy’s performance in terms of some popular performance statistics like Sharpe Ratio, Sortino ratio, which help to quantify the strategy’s return on risk. If the results meet the necessary criteria, the strategy can be implemented with some reasonable degree of confidence.
You can learn all about backtesting a trading strategy here.
You can backtest and do the performance analysis using a backtesting platform like Blueshift and find out the viability of your strategy/trading idea.
You can begin with paper trades which are those trades where one can buy or sell securities without risking any real money. This whole mechanism of using virtual money for placing paper trades is known as “Paper Trading.”
Once you start gaining confidence over your trading strategies or techniques, you can start the live trading. Live trading involves real money and thus, getting into live trading implies real profits and real losses.
This video provides a deeper insight into Live Trading:
Also, you can indulge in this hands-on masterclass recording, by Dr Hui Liu and Aditya Gupta where they explain how you can create an algorithmic trading strategy and implement it in live markets. They explored the universe of trading strategies, created a sample strategy, backtested it, and analysed the results here:
Conclusion
Having a good understanding and knowledge of generating, evaluating and backtesting trading ideas is extremely important in the trading domain since the application of right strategies in particular situations helps improve your trading experience.
The main aspect of becoming a successful trader is the strategy behind each trade which suits the particular market situation.
Disclaimer: All data and information provided in this article are for informational purposes only. QuantInsti® makes no representations as to accuracy, completeness, currentness, suitability, or validity of any information in this article and will not be liable for any errors, omissions, or delays in this information or any losses, injuries, or damages arising from its display or use. All information is provided on an as-is basis.