
It is challenging to find out the behaviour of financial markets based on countless news and events that impact the markets and the economy ie. Market Regimes. In this project, EPATian Fahim Khan explains how you can detect a Market Regime with the help of a hidden Markov Model.
This blog also provides Fahim's complete project, data files and HMM files in a downloadable format.
This article is the final project submitted by the authors as a part of their coursework in the Executive Programme in Algorithmic Trading (EPAT®) at QuantInsti®. Do check our Projects page and have a look at what our students are building.
About the Author

Fahim Khan is an EPATian based in Mumbai, India. He has an engineering degree in electronics and is presently pursuing his Masters from WorldQuant University.
Fahim is presently an Assistant Consultant at TCS. He has an interest in Machine Learning and Deep Learning. He enjoys exploring new technology and domain. As a hobbyist, he is currently exploring how to utilize ML/DL skill set in finance and algorithmic trading.
Project abstract
There is always a challenge for quantitative traders to find out the frequent behaviour of the financial markets due to change in government policies, negative news, regulatory environment and other macroeconomic effects. Such periods are known as Market Regime.
These various regimes lead to adjustments of asset returns via shifts in their means, variances, covariances, autocorrelation and autocovariances. This impacts the effectiveness of time series methods that rely on stationarity.
There is a clear need to detect these regimes, effectively. This aids optimal deployment of quantitative trading strategies and tuning the parameters within them.
Here I use Hidden Market Models, to detect market regimes and accordingly adjust the strategy being used.
Data required
I have taken 120 days of intraday data from Zerodha for the following tickers.
- NIFTY50
- HDFCBANK
- ICICIBANK
- KOTAKBANK
- ONGC
- INFY
- RELIANCE
- HDFC
- LT
- IOC
- SBIN
- HINDUNILVR
- MARUTI
- ITC
- TCS
It is always advisable to go for intraday data to get better results for detecting market regime using HMM.
Procedure
As the main focus is on the detection of the market regime, I have used a moving average strategy. As in the case of HMM, we can only have partially observable data, it becomes very important to choose our observable data very carefully.
For moving average strategy, I have chosen the daily returns as the observable variable. We can also have a daily standard deviation, daily volatility as observable variables.
The project is divided into the following modules (abstract not pythonic):
1. Backtesting Code
In this module, I created a simple framework for backtesting. Using this we can:
- Keep track of transactions
- Be able to do things like calculating trade price after factoring in the brokerage (I took Zerodha rates for illustrations)
- Also, look at the code for simulating buying and selling orders
- Check the possible number of shares that can be bought given the budget etc.
- It also functions to give the backtesting statistics like Sharpe ratio, PnL, Performance etc.
- Other custom stats can be added here.
The code in backtesting classes is used as the parent class for the strategy classes.
Another class which is responsible for maintaining the portfolio details of every symbol on which we want to run the backtesting strategy is created. Here we can find out which symbol is performing well for our backtesting strategy and we can focus on those symbols in live trading.
2. The HMM Model
It is important to split the data into training and test data into appropriately sized parts. As I have only 120 days of inter-day data it was difficult for me to have a 70:30 ratio so I have decided to split it into 50:50 ratio.
Please note that more the amount of data better would be the result.
If you have large data then I would suggest you go with a 70:30 split which can be optimized.
The HMM model is implemented using the hmmlearn package of python. From this package, we chose the class GaussianHMM to create a Hidden Markov Model where the emission is a Gaussian distribution. This means that based on the value of the subsequent returns, which is the observable variable, we will identify the hidden variable which will be either the high or low low volatility regime in our case.
It is important to choose the observable variable very carefully as on this variable model is going to be fit.
Here in the moving average strategy, the observable variable is daily returns but we can also use:
- standard deviation,
- volatility,
- forward volatility (for options) etc.
This module, basically, gives us the best sequence of regimes or no-regimes. The model generated by this module was saved in a pickle file.
3. Strategy Execution & Comparison
Here we create two classes which are child classes from the class in the backtesting module.
- In the first one, we run the moving average strategy without inputs of the regime from the HMM model.
- In the second one, we use the prediction about the regime from the HMM model.
The strategy is run using only the test data in both cases. The training data is used only for training the Gaussian HMM. This is so that comparison can be made between the two scenarios.
After running the first vanilla moving average strategy class and generating the stats we load the model we created in the Gaussian HMM module. Then we iterate over the testing data returns and keep appending them to a list. And then we predict the regime based on this list using the already trained HMM model.
Based on the prediction we make a decision.
- If we have no position and the volatility prediction says high we continue to take no position.
- If we have no position and the volatility prediction says low and there is an average crossover, we buy and take a long position.
- If there is no crossover we continue with no position.
- If we have a position and the volatility prediction is high we sell and end our position.
And similarly for other situations as well.
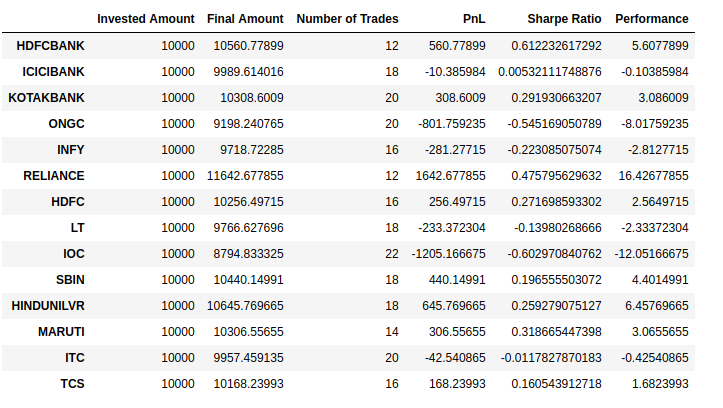

We can see that there are a bunch of securities which have performed well without using HMM such as KOTAKBANK, HINDUNILVR and RELIANCE. But our profit is not negative. It is just that we earned a little less profit.
Now if we compare the result for security ONGC, INFY, LT, SBIN. We can see that loss has been reduced sharply for a strategy using HMM. In fact, one of the security TCS which was in loss is giving us profit.
If you see the overall picture, we can conclude that strategy with HMM may give you a little less profit but it will save you from the major losses during regime change. We can use HMM with any strategy for risk management purposes.
Limitations of project
The result we are comparing is just for 120 days of inter-day data. We can actually use a larger data set to see how HMM performs with your strategy for risk management.
Further scope of the project
We can do a lot of things to improve the HMM model. I will try to do the following in the future:
- Running different strategies with HMM such as mean reversion strategy, pair trading strategy.
- Changing observable variable to std deviation, volatility etc
- Optimizing training and test data split by using a large data set.
If you want to learn various aspects of Algorithmic trading then check out the Executive Programme in Algorithmic Trading (EPAT). The course covers training modules like Statistics & Econometrics, Financial Computing & Technology, and Algorithmic & Quantitative Trading. EPAT equips you with the required skill sets to build a promising career in algorithmic trading.
Disclaimer: The information in this project is true and complete to the best of our Student’s knowledge. All recommendations are made without guarantee on the part of the student or QuantInsti®. The student and QuantInsti® disclaim any liability in connection with the use of this information. All content provided in this project is for informational purposes only and we do not guarantee that by using the guidance you will derive a certain profit.
Files in the download:
- The Complete Project - PDF file
- All Data Files - Daily and Intra-day
- HMM Models folder
