By Chainika Thakar (Originally written by Vibhu Singh)
Mean reversion is a financial theory suggesting that asset prices and historical returns eventually revert to their long-term mean. This blog explores how mean reversion works in trading, its importance, and various strategies for its implementation. We will discuss common indicators, risk management techniques, and real-life examples of mean reversion trading strategies.
Whether you are a novice or an experienced trader, this comprehensive guide on mean reversion strategies offers valuable insights and resources.
This blog covers:
- Introduction to mean reversion
- Importance of mean reversion in trading
- How does mean reversion work in trading?
- Common indicators used in mean reversion
- Strategies for mean reversion in trading
- Example of a mean reversion trading strategy with Python
Introduction to mean reversion
The theory of mean reversion implies that markets tend to overreact to news and events, causing prices to move away from their historical mean. Over time, however, prices correct themselves and move back toward the average mean. This phenomenon is often observed in time series data in which the future path of the series is influenced by its deviation from the historical mean. This concept of trading is popularly known as the financial time series analysis in which the analysis of the time series data can help with seasonal trading (event-driven) and volatility trading.
In practical applications, mean reversion is a popular strategy in algorithmic trading. Traders may buy undervalued assets, anticipating they will revert up to the mean, and sell overvalued assets, expecting a reversion down to the mean. Mean reversion can aid in risk management by helping identify when an asset is likely overbought or oversold. This can inform better decision-making in trading and investment strategies.
Let us now see the importance of mean reversion in trading for a better understanding.
Importance of mean reversion in trading
Mean reversion is a significant concept in trading for several reasons as mentioned below:
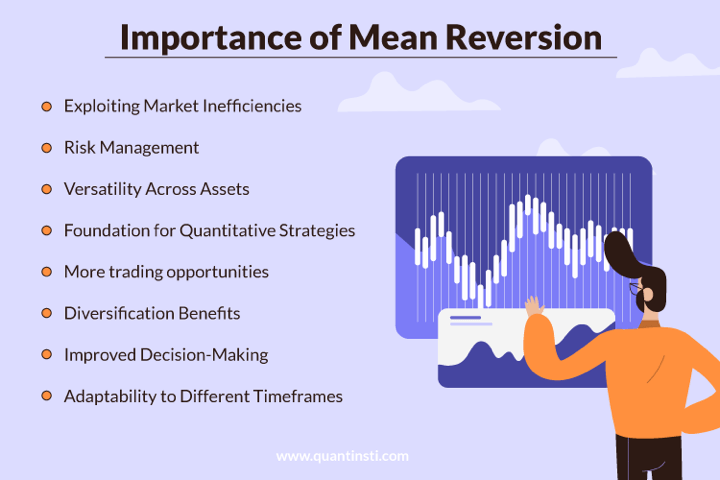
- Exploiting Market Inefficiencies: Markets often overreact to news and events, causing prices to deviate from their intrinsic values. Mean reversion strategies aim to exploit these inefficiencies by buying undervalued assets and selling overvalued ones, thus capitalising on temporary mispricings.
- Risk Management: Mean reversion helps in managing risk by identifying extreme price movements. By recognising overbought or oversold conditions, traders can avoid entering positions at unsustainable levels and can set more effective stop-loss orders to limit potential losses.
- Versatility Across Assets: Mean reversion strategies can be applied to various asset classes, including stocks, commodities, currencies, and bonds. This versatility allows traders to use a consistent approach across different markets, enhancing their overall trading strategy.
- Foundation for Quantitative Strategies: Many quantitative trading strategies are built on the principle of mean reversion. It serves as a foundation for more complex models, such as statistical arbitrage and pairs trading, which rely on the assumption that related assets will revert to their historical average prices or spreads.
- More Trading Opportunities: Mean reversion strategies often involve taking advantage of short-term price fluctuations, which can lead to more frequent trading opportunities and incremental gains.
- Diversification Benefits: Mean reversion strategies can complement other trading approaches, such as trend following or momentum trading. This diversification helps in balancing the portfolio, as mean reversion strategies typically perform well in range-bound markets, while trend-following strategies excel in trending markets.
- Improved Decision-Making: Mean reversion provides clear criteria for trade entries and exits. This structured approach can help traders make more objective decisions, reducing the influence of cognitive biases and emotional reactions to market movements.
- Adaptability to Different Timeframes: Mean reversion can be applied to various timeframes, from intraday trading to long-term investments. This adaptability makes it a valuable tool for traders and investors with different time horizons and objectives.
Let us now move to the working of mean reversion in trading.
How does mean reversion work in trading?
Mean reversion in trading works on the principle that asset prices fluctuate around their historical average, and when prices deviate significantly from this average, they are likely to revert.
Here's a breakdown of how mean reversion operates in trading:
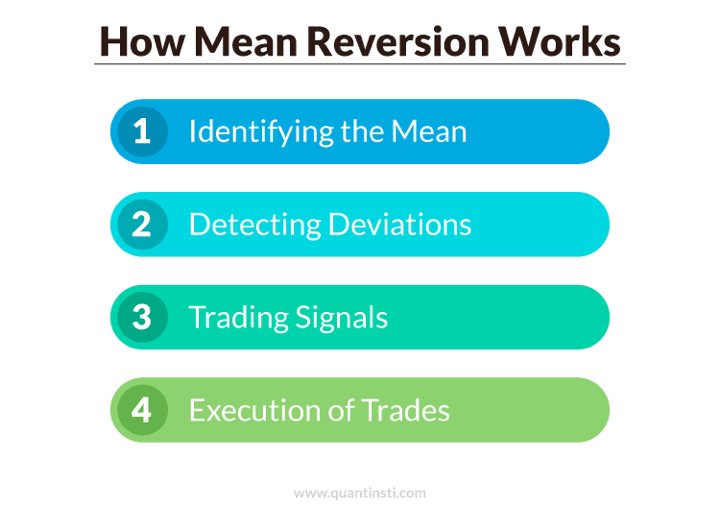
Step 1 - Identifying the Mean
The first step in mean reversion trading is identifying the historical average or mean price of an asset. This can be done using various statistical measures Exponential Moving Average (EMA), Weighted Moving Average (WMA), and Simple Moving Average (SMA).
Step 2 - Detecting Deviations
Once the mean is established, traders look for significant deviations from this mean. These deviations indicate potential trading opportunities such as overbought and oversold conditions.
Step 3 - Trading Signals
Mean reversion strategies generate trading signals based on these deviations:
- Buy Signal: Generated when the price falls below the mean (oversold condition). The expectation is that the price will rise back to the mean.
- Sell Signal: Generated when the price rises above the mean (overbought condition). The expectation is that the price will fall back to the mean.
Step 4 - Execution of Trades
After identifying trading signals, traders execute their trades:
- Entry Point: A trade is entered when the asset's price deviates significantly from the mean. For example, buying when the price is below the mean and selling when it is above.
- Exit Point: The trade is exited when the price reverts to the mean or reaches a predetermined level that indicates the reversion has occurred.
Next, we will discuss the common indicators used in mean reversion trading.
Common indicators used in mean reversion
Traders use various tools and indicators to implement mean reversion strategies effectively:
- Bollinger Bands: Bands plotted around a moving average that expands and contracts based on volatility. When prices move outside these bands, it signals overbought or oversold conditions.
- Relative Strength Index (RSI): Measures the speed and change of price movements. RSI values above 70 indicate overbought conditions, while values below 30 indicate oversold conditions.
- Moving Average Convergence Divergence (MACD): Shows the relationship between two moving averages of prices, indicating potential buy and sell signals when the lines cross.
Next, we will discuss the strategies for mean reversion and the implementation of the same in the trading domain.
Strategies for mean reversion in trading
By understanding and implementing mean reversion strategies in quantitative trading, traders can potentially exploit temporary price deviations and enhance their trading performance.
Here are several common strategies for mean reversion used by traders:
- Moving Average (SMA) Crossover Strategy: This strategy involves comparing short-term and long-term SMAs. When the short-term SMA crosses above the long-term SMA, it signals a potential buying opportunity, anticipating that the price will revert upwards. Conversely, when the short-term SMA crosses below the long-term SMA, it signals a selling opportunity.
- Bollinger Bands: Bollinger Bands consist of a moving average and two standard deviation lines. When the price moves outside the bands, it indicates an overbought or oversold condition. Traders can buy when the price falls below the lower band and sell when it rises above the upper band, expecting a reversion to the mean.
- Relative Strength Index (RSI): The RSI measures the speed and change of price movements. An RSI above 70 indicates an overbought condition, while an RSI below 30 indicates an oversold condition. Traders use these signals to anticipate mean reversion by selling overbought assets and buying oversold assets.
- Pairs Trading: This involves trading two correlated assets. When the price of one asset deviates significantly from its pair, traders can short the overperforming asset and buy the underperforming asset, expecting their prices to converge again.
- Statistical Arbitrage: This strategy involves using statistical models to identify price deviations between related assets. Traders exploit these deviations by taking long and short positions, expecting the prices to revert to their historical relationship. It is one of the popular types of trading strategies in quantitative trading.
Going ahead, we will see an example of the mean reversion strategy with Python.
Example of a mean reversion trading strategy with Python
Here, we will use Cointegrated Portfolio Trading as an example, which is a part of statistical arbitrage. In this type of trading strategy, trading signals depend on two or more cointegrated instruments. Pairs trading is one of the most famous examples of a cointegrated trading style. Since we are using two cointegrated instruments to make a trade, therefore the name pairs trading!
But it’s not always a pair, it could also be triplets or could be more than that. If you find five cointegrated stocks, you can make a portfolio of that and do the trading. The cointegration test can be conducted with the Augmented Dickey Fuller Test. This section of the example will focus on the concepts of pairs trading and a trading strategy based on that.
To learn more about Mean Reversion Trading Strategies using market data and statistical concepts, below is a brief video.
Here are the concepts we will cover in this example:
- Principle of Pairs Trading
- Correlation vs Cointegration
- Selection of Pairs
- Pairs Trading in Python
Principle of Pairs Trading
Let’s say you have a pair of instruments with similar fundamentals, belonging to the same sectors and similar economic links. For example, stocks like Google and Microsoft or Facebook and Twitter. Since they have similar fundamentals, you expect both stocks to behave similarly. You also expect the ratio or spread of such stocks to remain constant with time. However, due to a temporary change in the demand and supply and other factors, there might be a divergence in the spread between the pairs.
In such scenarios, one security outperforms the other. According to the mean reversion principle, you expect this divergence to revert to normal with time. In such scenarios, when there is a temporal divergence, you can perform the pairs trade. That’s buying the underperforming security and selling the outperforming security.
Below is a short, educational video that explains the fundamentals of pairs trading strategy in about 3 minutes.
Correlation vs Cointegration
Most of the people are confused between correlation and cointegration, and they often think they are the same. But that’s not the case. When two price series move in the same or opposite direction, then there is some correlation between the price series. If one price series moves in either up or down direction and other price series also move in the same direction, there is a positive correlation between them.
While one price series moves in the upward or downward direction, the other moves opposite to that, then both series are negatively correlated.
Cointegration is a statistical property of two or more price series that indicates if a linear combination of the series is stationary, then both series are cointegrated with each other.
In other words, cointegration implies trying to figure out whether two or more price series move together or not in such a way that their combined movements remain stable over time. If this combined series is stable, the original series is considered cointegrated and can be used for pair trading.
For example, if the linear combination of two stocks is stationary, both stocks are cointegrated with each other. A price series is said to be stationary if its mean and variance are constant over time.
Understanding the stationary data definition is key to distinguishing correlation from cointegration. Stationary price series provide a solid foundation for analyzing long-term relationships. Explore further to see how this concept can enhance your analysis and trading strategies.
Statistical test for cointegration: Augmented dickey fuller or ADF test is one of the statistical tests for cointegration. In Python, this can be easily done through the statsmodels library of Python.
As explained in the principle of pairs trading, the spread between stocks must converge to the mean over time for pairs trading to work. That is, both stocks must be cointegrated with each other.
Just looking at the correlation between the stocks might give you spurious results because the prices of the two stocks may keep on increasing without ever mean-reverting. It is a misconception that the two correlated instruments must be cointegrated and vice versa.
Selection of Pairs
- How to select stock pairs?
Suppose you have a large universe of stocks. The first step is to segregate stocks based on market capitalisation, sector, daily traded volume etc. After segregating, you can check for a correlation between the securities in each group. The correlation helps to filter the number of pairs to a more manageable set. Once you get the securities in a small set of groups, you can check for cointegrated pairs within the group and select the cointegrated pairs. - How to select forex pairs?
The basic idea behind selecting pairs in forex is similar to that of stocks. We need to find countries that have similar economic fundamentals.. - How to select pairs in the futures market?
In the futures market, there are not many good pairs, even with similar economic exposure. This may be due to differences in demand and supply. Therefore, in the futures, you can’t merely rely on economic exposure for choosing pairs.
Pairs Trading in Python
Steps to implement pairs trading in Python
- Step 1 - Select forex pairs
- Step 2 - Calculate the ratio and check for cointegration
- Step 3 - Create feature to generate trading signals
- Step 4 - Define entry and exit point
- Step 5 - Calculate cumulative returns
Step 1 - Select forex pairs
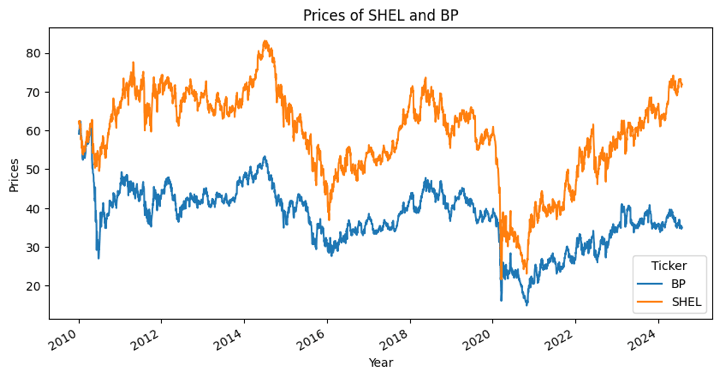
As discussed above, we select pairs having similar economic fundamentals.
Output:
Step 2 - Calculate the ratio and check for cointegration
We calculate the ratio between the currency pairs. If the ratio is stationary, then we can say that the currency pairs are cointegrated. We are using an ADF test to check whether the ratio is stationary or not. One thing to remember while using the ADF test is that the test result changes by changing the order of the ratio.
Output:
The series is stationary
p-value =  0.0032407953901051174
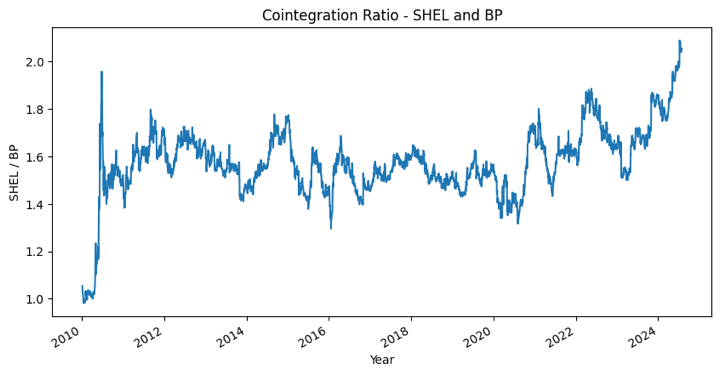
The p-value from the ADF test for the SHEL/BP ratio is less than the 0.05 significance level. Therefore we can say that the ratio is stationary.
Let’s take a look at the cointegrated ratio to make sure this makes sense with the code below.
Output:
Step 3 - Create feature to generate trading signals
The absolute ratio isn’t very useful in statistical terms. It can be observed through the above ratio graph that it does not look like it moves around a stable mean. We need to normalise the ratio. This is done using z-score.
Z score is defined as:
Z Score = (Value — Mean) / Standard
Output:
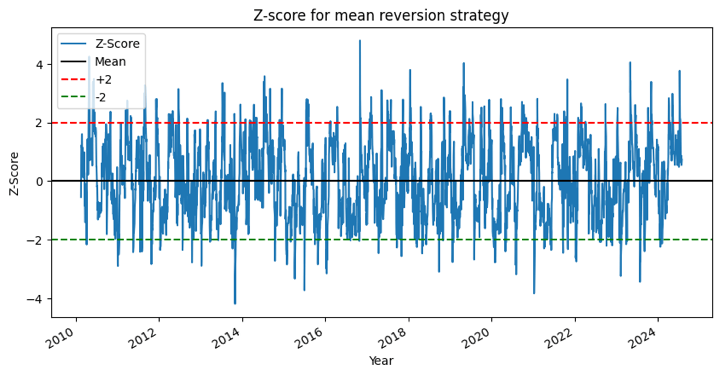
Now it’s easier to observe that the ratio moves around the mean, but sometimes it diverges from the mean, which we can take advantage of.
Step 4 - Define entry and exit points
If the z score crosses below the lower threshold, then we buy and exit the position when it reaches the mean. If the z score crosses above the upper threshold, then we sell and exit the position when it reaches the mean.
Step 5 - Calculate Cumulative returns
Output:
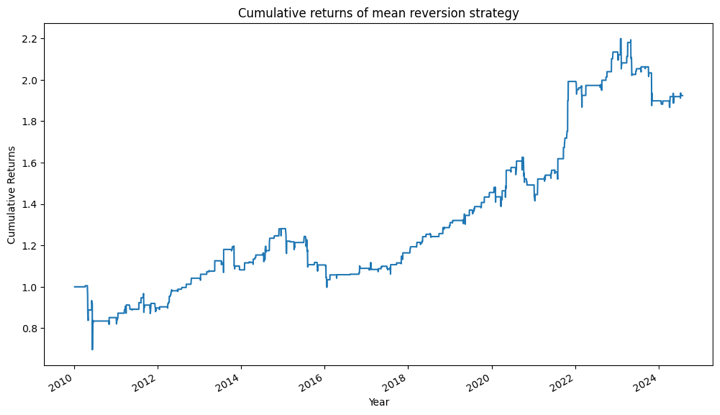
Further Improvements
The strategy can be further optimised using different values of the lookback period of the moving average and standard deviation.
Features to generate trading signals
The feature that we used to define the entry and exit position is the z-score. You can use a different variant of the z-score such as:
z score: (15-day moving average — 50-day moving average) / 50-day standard deviation
Another approach is to use the Bollinger Band for signal generation.
Stop loss
You can set the stop loss above and below your threshold level.
For example, in the above strategy, the set threshold was plus/minus 2 standard deviations. You can set the stop loss at plus/minus 3 standard deviations. When the ratio/spread crosses that threshold, you can exit the position. Another approach is to exit the position when a prefixed loss is hit.
Holding Period
You can keep the position for a day, week or month and exit after that. How long you can keep the position can be found using a concept known as the half-life. It tells how long it would take the time series to revert to the mean. It gives an idea of the expected holding period for a particular trade.
When you exit the position based on time, you will wait for the price to revert to mean to initiate new positions.
Below is the video that discusses Mean Reversion and Z-score, mean reversion principles which suggests that prices tend to move around the historical mean over time. Also, it mentions that the z-scores can be used to identify the deviation from the mean and generate the appropriate trading signals.
Conclusion
Mean reversion strategies offer valuable insights and techniques for traders seeking to capitalise on market inefficiencies. By understanding the fundamentals of mean reversion, traders can develop and implement effective strategies that exploit temporary deviations from the historical mean.
This comprehensive guide covers essential aspects such as identifying mean reversion opportunities, using common indicators, and applying various strategies, including pairs trading and statistical arbitrage.
Additionally, risk management practices tailored to mean reversion trading, such as position sizing, stop-loss orders, diversification, and volatility assessment, are crucial for optimising performance and mitigating potential losses. Whether you're a novice or an experienced trader, mastering mean reversion strategies can enhance your trading discipline, and improve decision-making.
The course on Mean Reversion Strategies, authored by Dr. Ernest P Chan (Managing member of QTS Capital Management, LLC.)., covers the topic in detail as it is devised to help you identify trading opportunities based on Mean Reversion theory. After learning from this course, you can create different mean reversion strategies such as Index Arbitrage and long-short portfolios using market data and advanced statistical concepts.
File in the download
- Mean reversion strategies in trading - Python notebook
Note: The original post has been revamped on 26th August 2024 for recentness, and accuracy.
Disclaimer: All data and information provided in this article are for informational purposes only. QuantInsti® makes no representations as to accuracy, completeness, currentness, suitability, or validity of any information in this article and will not be liable for any errors, omissions, or delays in this information or any losses, injuries, or damages arising from its display or use. All information is provided on an as-is basis.


