
Are you looking to enhancing the performance of trades based on widely used technical indicators such as the Simple Moving Average (SMA) and Relative Strength Index (RSI)?
This blog is just what you need!
By creating an easily adaptable framework to optimize exit conditions using an unbiased 70:30 train-test split, vectorised backtesting is applied to various historical datasets.
Through an iterative process, each trading strategy on each specific data set is given a complementary percentage target price (TP) and stop loss (SL) which maximizes profit given the “train” dataset. Identical parameters are imposed on the remaining “test” dataset, and a side-by-side comparison of initial specification versus the tweaked limits is made.
This article is the final project submitted by the author as a part of his coursework in the Executive Programme in Algorithmic Trading (EPAT) at QuantInsti. Do check our Projects page and have a look at what our students are building.
About the Author

Sim Yee Kai is currently serving mandatory National Service in Singapore. He has yet to enter university but is under scholarship to pursue a Double Degree in Computer Science and Business Administration at National University of Singapore (NUS). He is amongst the youngest learners at EPAT.
Project Introduction
This EPAT Final Project seeks to provide a framework that allows for the identification of the best or most favourable exit conditions in strategies that rely on a percentage-based approach when deciding the ideal level at which to close their positions.
Many strategies mainly focus on the entry conditions and attempt to forecast the direction of movement in the price action of the underlying security within a price action trading system. However, I believe that exit conditions are as or more important than entering trades, allowing for greater risk management and possibly higher profits during successful trades.
Strategy
As the objective of the project is to generate a versatile and adaptable structure that allows for flexibility in the implementation of new trading strategies with varying exit conditions, I have executed 3 simple trading ideas.
The first strategy is a basic simple moving average (SMA) crossover which generates a bullish signal when the 50-day SMA (short-term moving average) crosses above the 200-day SMA (long-term moving average), indicating a more positive sentiment in the market within the shorter time frame. On the other hand, a bearish signal will be generated when the 50-day SMA crosses under the 200-day SMA.
Next, I made use of a momentum indicator known as the Relative Strength Index (RSI) to generate my signals. When RSI dips below 30, it is an indicator the underlying security is oversold, generating a buy signal. If RSI exceeds 70, it is then considered overbought, generating a sell signal.

Last but not least, I implemented an exponential moving average (EMA) crossover strategy. The EMA is similar to the SMA, measuring trend direction over a period of time. However, EMA will apply more weight to data that is more current. Akin to the SMA crossover, a buy signal is generated when the 50-day EMA crosses above the 200-day EMA and a sell signal is generated when the 50-day EMA crosses under the 200-day EMA.

In alignment with the inspiration for this project, the settings for the indicators used are easily modifiable, allowing a user to adjust the short term SMA to 7-day rolling mean and long term SMA to 14-days as an example.
Data
The dataset used are commonly traded US equities and a list of common forex pairs. For this project, we use daily data over 10 years from 2012 to 2022.
US equities (20): 'AAPL', 'MSFT', 'GOOG', 'AMZN', 'TSLA', 'NVDA', 'TSM', 'XOM', 'V', 'UNH', 'META', 'JNJ', 'JPM', 'WMT', 'MA', 'CVX', 'LLY', 'PG', 'HD', 'NVO'
Forex (13): 'EURUSD=X', 'JPY=X', 'GBPUSD=X', 'AUDUSD=X', 'NZDUSD=X','EURJPY=X', 'GBPJPY=X', 'EURGBP=X', 'EURCAD=X', 'EURSEK=X', 'EURCHF=X', 'EURHUF=X', 'EURJPY=X'
Backtest
To backtest the strategies, I used Python with yfinance to import relevant data from Yahoo Finance. pandas, numpy and talib were used to handle the data and to generate trading indicators and signals. Finally, matplot was used to visualize the findings.
Via vectorized backtesting, the code loops through each day, identifying if a buy/sell signal is generated. If a signal is present, a trade is entered and only exited when either the take profit (TP) or stop loss (SL) level is reached. At any time, only one position can be entered.
Each dataset was split into a ‘train’ and ‘test’ dataset in a 70:30 ratio. Within the ‘train’ dataset, a variable TP (1.01 to 1.10 times entry price with a 0.01 step) and SL range of (0.99 to 0.89 times entry price with a -0.01 step) is used.
This means that vectorized backtesting is done on each ‘train’ dataset multiple times with different exit conditions each time, generating different returns and results.
At the end, the combination of TP and SL which generated the highest returns is considered to be the ‘best’ parameters for the given dataset and strategy. Using the ‘best’ TP and SL, the same strategy is run on the remainder of the data– the ‘test’ dataset.
The returns from the ‘test’ dataset are then compared to ‘buy and hold’ returns and the returns from ‘control’ which has a fixed ratio of 1.01 TP and 0.99 SL for the same period of time.
This course will guide learners step-by-step through the process of backtesting trading strategies using Python, teaching them how to optimize their strategies and evaluate their performance with realistic backtests.
Key Findings
From the results below, we can infer a few conclusions for each dataset.
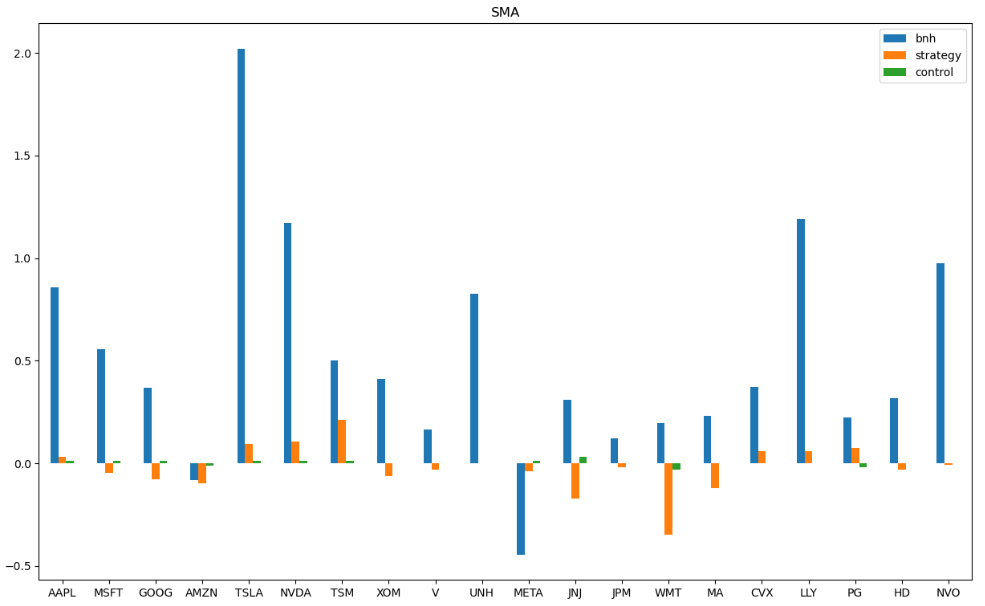


On the stocks dataset:
- Strategy returns appear to be rather negligible for both crossover strategies on the stocks as compared to the ‘buy and hold’ returns. This may be partially attributed to survivorship bias as these publicly listed stocks have been in circulation for at least 10 years and are generally popular household names. The optimized exit conditions do not necessarily provide a significant edge over the ‘control’ set up.
- The supposedly ‘optimized’ exit conditions appear to underperform as compared to the ‘control’ on multiple occasions while using the RSI indicator, suggesting that the idea of an optimal TP and SL combination fails to works in this instance.


On the forex dataset:
- Strategy returns appear to be rather encouraging for selected forex pairs using the SMA crossover, trumping ‘buy and hold’ returns and ‘control’ returns on multiple pairs. Outwardly, it seems that XXXUSD pairs respond relatively encouragingly towards the given strategy.
- There also appears to be instances within combinations of forex pairs and strategies in which optimizing the exit conditions substantially affected the profitability of the strategy while keeping entry conditions constant. In the case of EURGBP and EURCAD while using the RSI indicator, an optimized exit would have resulted in noteworthy profits, in stark contrast to the crushing losses of the ‘control’ setups.
- For the EMA strategy, it could be noted that strategy returns appear to have greater volatility as compared to the ‘control’ setups, with non-conclusive overall effectiveness.
Future Extensions
Granted, the strategies implemented in this project were simple and straightforward.
However, the beauty of such a framework enables a user to modify existing code to suit his/her own strategies with their unique entry conditions with ease, giving flexibility of utilization. This can allow for widespread applicability and accessibility.
To allow for a deeper investigation into the effectiveness or the profitability of such an idea, we could use a larger dataset consisting of a greater variety such as Exchange Traded Funds (ETF) or commodities like gold or crops.
A different timeframe could also be imposed to yield a distinctly foreign result to infer and draw conclusions from.
As for the methodology for choosing the optimal TP & SL combination, a wider range of TP & SL could be chosen (ranges which can conveniently be altered as inputs) or perhaps machine learning algorithms could be applied.
If you too want to learn various aspects of Algorithmic trading then check out this algo trading course which covers training modules like Statistics & Econometrics, Financial Computing & Technology, and Algorithmic & Quantitative Trading. EPAT equips you with the required skill sets to build a promising career in algorithmic trading. Enroll now!
File in the download
- Complete Python Code of the project
Disclaimer: The information in this project is true and complete to the best of our Student’s knowledge. All recommendations are made without guarantee on the part of the student or QuantInsti®. The student and QuantInsti® disclaim any liability in connection with the use of this information. All content provided in this project is for informational purposes only and we do not guarantee that by using the guidance you will derive a certain profit.
