
This project will help you learn how you can predict the price trend of metals using Machine Learning in your trading practice. It will take you in a stepwise manner, leading to using a computer vision to create a Convolutional Neural Network (CNN), which can predict the price movement.
The complete data files and python code used in this project are also available in a downloadable format at the end.
This article is the final project submitted by the authors as a part of their coursework in the Executive Programme in Algorithmic Trading (EPAT®) at QuantInsti®. Do check our Projects page and have a look at what our students are building.
Author
Holger Busch has over 25 years of experience in his career in the financial sector, specifically in the industry of credit institutions and mutual funds. In 2001 he founded his own boutique consulting company.

As an expert witness appointed by the German court, he has accompanied numerous large outsourcing agreements between renowned credit institutions, mutual funds and insurance companies and large service providers. In addition, he is active in the market providing extensive expert opinion.
Holger holds a master’s degree in computer science from the University of Kaiserslautern where he studied at the German Research Center for Artificial Intelligence (DFKI). Additionally, he acquired an MBA in economy and law from the University of Kaiserslautern.
Project abstract
In this projectm, we look at the prediction of the price trend of metals (precious and non-precious metals, but not for gold) for the next trading day. e.g. silver, platinum, palladium, copper, etc. The selection criteria for the metals should be that they should not be strongly sensitive to sentiment because they do not depend on only one or two mining companies in the world or mined in only a small region of the world.
The strategy for the prediction is that often the markets, which open and close on the same day before the market is used for trading anticipate the trend. This has to be differentiated from global trends for the whole market segment or specific securities.
Therefore machine learning based on neural networks should be used to differentiate between these reasons for the price trends. Learn more about the applications and role of neural network in trading to enhance your skills. The type of neural network has to be selected in the project.
Data sources
Data sources should be
- FXCM
- Quandl Python API or
- Oanda
The following should be used in detail:
• Development of prices in markets, which open on the same trading day before the market, should be used for the trading strategy, for the same or other relevant securities.
• Development of other prices and indicators, e.g. mining company stocks, fx-rates, over a relevant time before this trading day where the prediction is for.
Project motivation
My motivation for this project is that I did my Diploma/Master in computer science, 25 years ago, at the German Research Center for Artificial Intelligence (https://www.dfki.de/en/web/). Many basic concepts of machine learning are still in use today, but many new things arose. I want to catch up with the actual state-of-the-art of machine learning in the financial domain.
Introduction
The use of candlestick patterns is for some traders a successful method to predict price movements of some securities. Here computer vision should be used to create a CNN, which can predict the price movement.
The paper about candlestick and computer vision for the prediction of stock price movements: (“Using Deep Learning Neural Networks and Candlestick Chart Representation to Predict Stock Market”, Rosdyana Mangir Irawan Kusuma, Trang-Thi Ho, Wei-Chun Kao, Yu-Yen Ou and Kai-Lung Hua) was helpful for this approach. However, they used it for a few single stocks from Asian stock markets.
Computer vision on candlesticks to predict price movement
Download of data
Data from the CFD-Broker FXCM were downloaded from all CFD-instruments who exist at this broker and have at minimum data for 450 days. The software tried to download the last 2500 daily prices backwards from the 10th of January 2020. This is approximately 10 years for instruments with 252 price days per year or 7 years for instruments with 360 price days per year.
Candlestick creation
With daily data trading candlestick pattern images were created. The candlestick images were created with a fixed number of days per picture. The test includes candlestick images with 32 days and a 7 pixel per candle width and with 56 days and a 4 pixel per candle width.
Example picture 32 days and 7 pixels per candle width:

Example picture 56 day and 4 pixels per candle width:
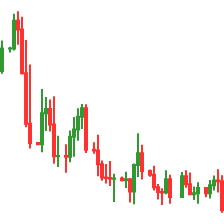
The picture size was always 224x224 pixels. The picture does have a gap when there is no data that exists for this day. (E.g. weekends) For the calculation of open and close price the mean of bid/ask open and bid/ask close is used.
Label creation
For the definition of the classes, the price movement of the next trading day after the last candle in the actual candlestick image was used. The price movement is calculated as the difference between the open and close price on the next day.
From this, there were three classes defined.
1. Class with Label ‘0’: The price of next-day moves not up or down more than 0.8%
2. Class with Label ‘L’: The price of next-day moves up more than 0.8% and there is no drawdown of more than 1%
3. Class with Label ‘S’: The price of next-day moves down more than 0.8% and there is no drawdown of more than 1%.
The open price of the following days is used as a 100% basis. 0.8% is chosen to include all costs of trading and the spread between the buy and sell.
Training the CNN
For the training different Resnet models 34, 50 and 101 were tested. Learn about ResNets here.
The best error rates have the Resnet 34 model.
The Resnet34 initial weights are pre-loaded from Pytorch.org. For normalization, the ImageNet stats were used. Tests without this normalization show increased error rates.
Also, all CFD-Instruments were tested with candlestick pictures with 7-pixel candle width and 32 daily candles per picture and with 4-pixel candle width and 56 daily candles per picture. Not for all instruments were the results better with more candles in the picture. Therefore, for each instrument, the best picture type was selected.
For implementation, the fast.ai library was used. For the initial training, a maximum of 6 epochs is used.
For the final training, the learning rate parameter is optimized, and up to three more epochs were used to train the CNN.
For validation, approximately 15% of the images were selected randomly and not used for training. These images were only used for the validation.
All instruments of the supplier were used which have a final error rate below 15%. Table of all instruments with a final error rate below 15%
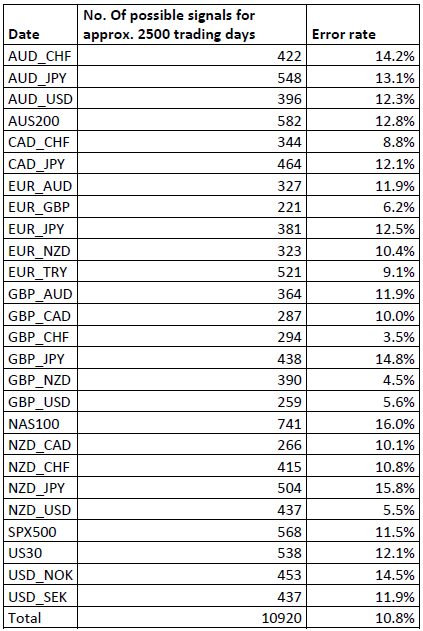
This results in 3.7 possible signals per trading day.
The software
The software is divided up into two parts. One part for the generation of the images, the training of the models and the export of the models. The other part is for automated trading with the use of these models.
For the first part, the software is written in Python using Jupyter Notebooks. The second part is written in Python.
The following table shows the components of the software and their function:
Part 1: Generation of the models
| File | Function |
| Change_TZ_daily_data_files.ipynb | Changes the time data from UTC to NYC-time zone, because the trading is done in the NYC time zone |
| Create_candles_images_08.ipynb | Creates the candle images |
| Delete_Sat_Sun_daily_data_files.ipynb | Deletes data for Saturday and Sunday from the data, because there are sometimes data errors and data are provided for Saturdays or Sundays |
| Export_models_batch_08.ipynb | Exports the trained models |
| Get_FXCM_30m_data_selected.ipynb | Get 30-minute data, which is used to calculate the price move on the next day an to check if the maximum drawdown is below 1% |
| Learn_Candles_batch_08.ipynb | Does the initial training of the models |
| Merge_30m_data_files.ipynb | Merges the 30 Minute data files. This is needed because the request of 30-minute data for 10 years at once is forbidden at the provider's interface |
| Optimize_learn_candles_08.ipynb | This is for the final hand optimization of the models |
| Optimize_learn_candles_batch_08.ipynb | This is for automatic optimization of the models |
Part 2: Automated trading
| File | Function |
| candles.py | Creates the candle images for the prediction |
| files.py | Helper functions for file handling |
| instruments.py | List of instruments and key numbers for each instrument |
| log.py | Function for logging |
| predictor.py | Does the prediction with the pre-created candle images |
| trading_api.py | Contains the functions for trading |
| trading_day.py | Contains the functions for controlling the automatic trading |
| watchdog.py | Contains a watchdog which checks regularly if the trading software is still running and working. If not, it restarts the process. |
Results
Let’s explain the chart for silver as an example for the strategy.

This chart is from a back test for one year from 01st April 2019 to 31st March 2019. The instrument is an XAU/USG CFD from the broker FXCM with a leverage of 1:20.
It uses a stop-loss at a 1% down. For this back test the models were trained with data from 01st June 2010 to 31st March 2019.
After several tests, the software has been running in a live environment since the 15th of January. The CNN delivers the probability of the prediction for every prediction.
For safety, only predictions with a minimum probability of 55% are used. Up until the 15th of March the software trades on 9 days. There were 6 positive trades and 3 negative trades. The losses of the negative trades have the same amount as the wins of the positive trades. Therefore, overall 3 positive trades remain.
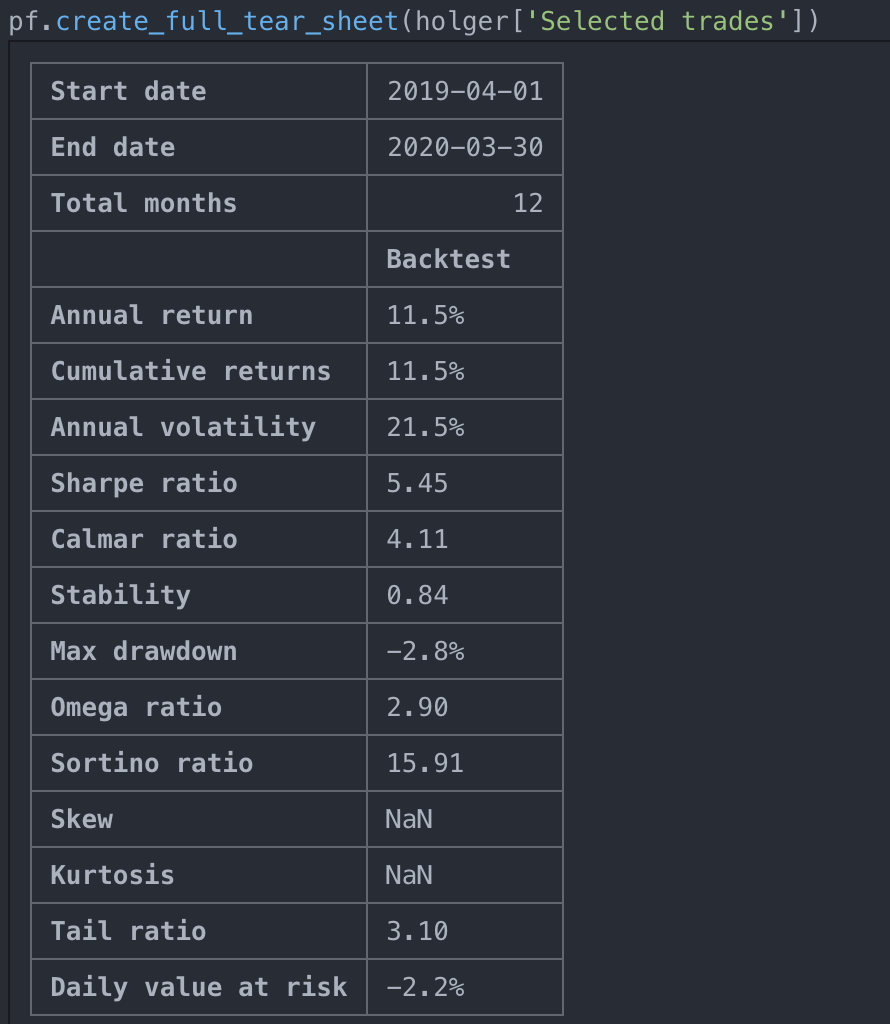
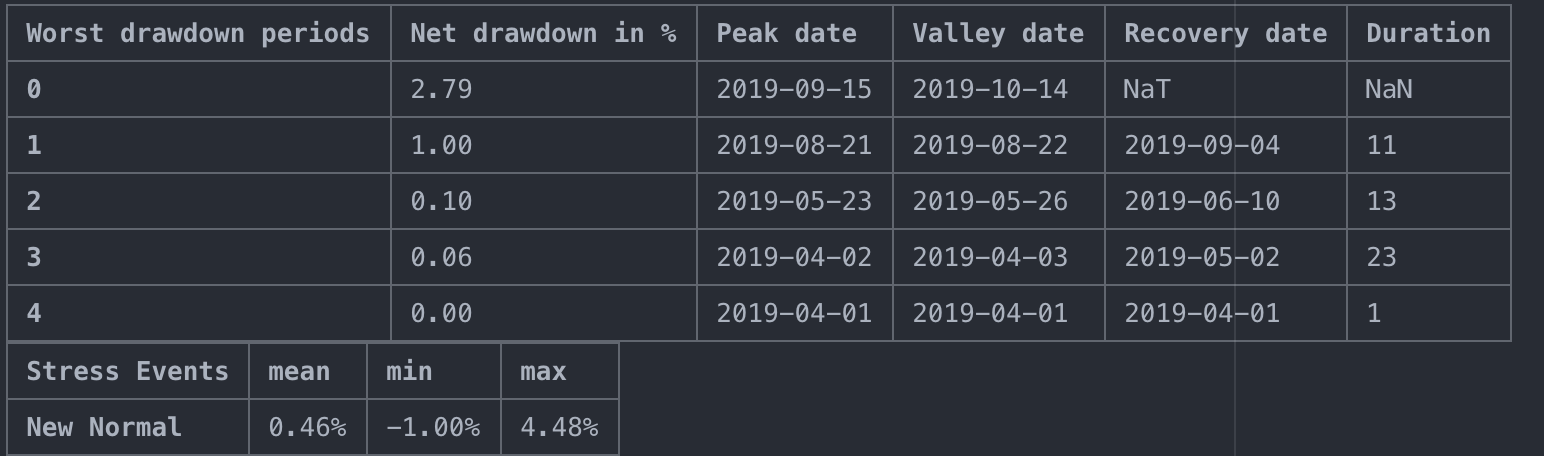
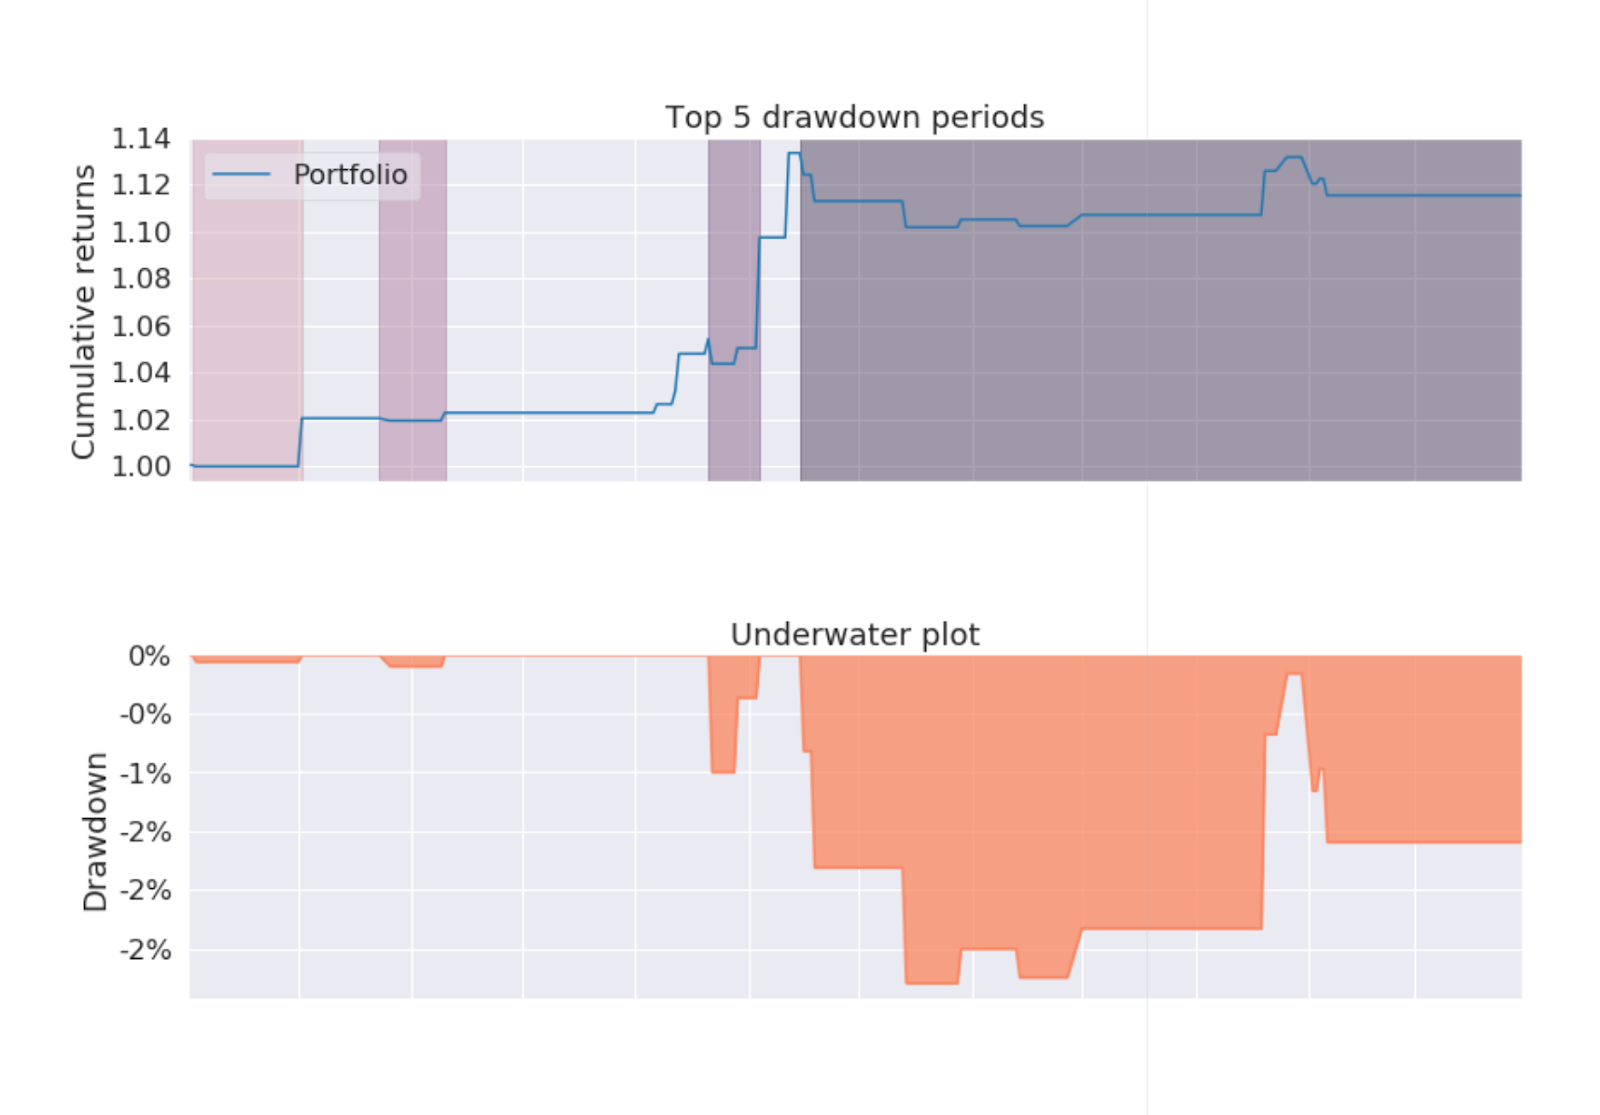
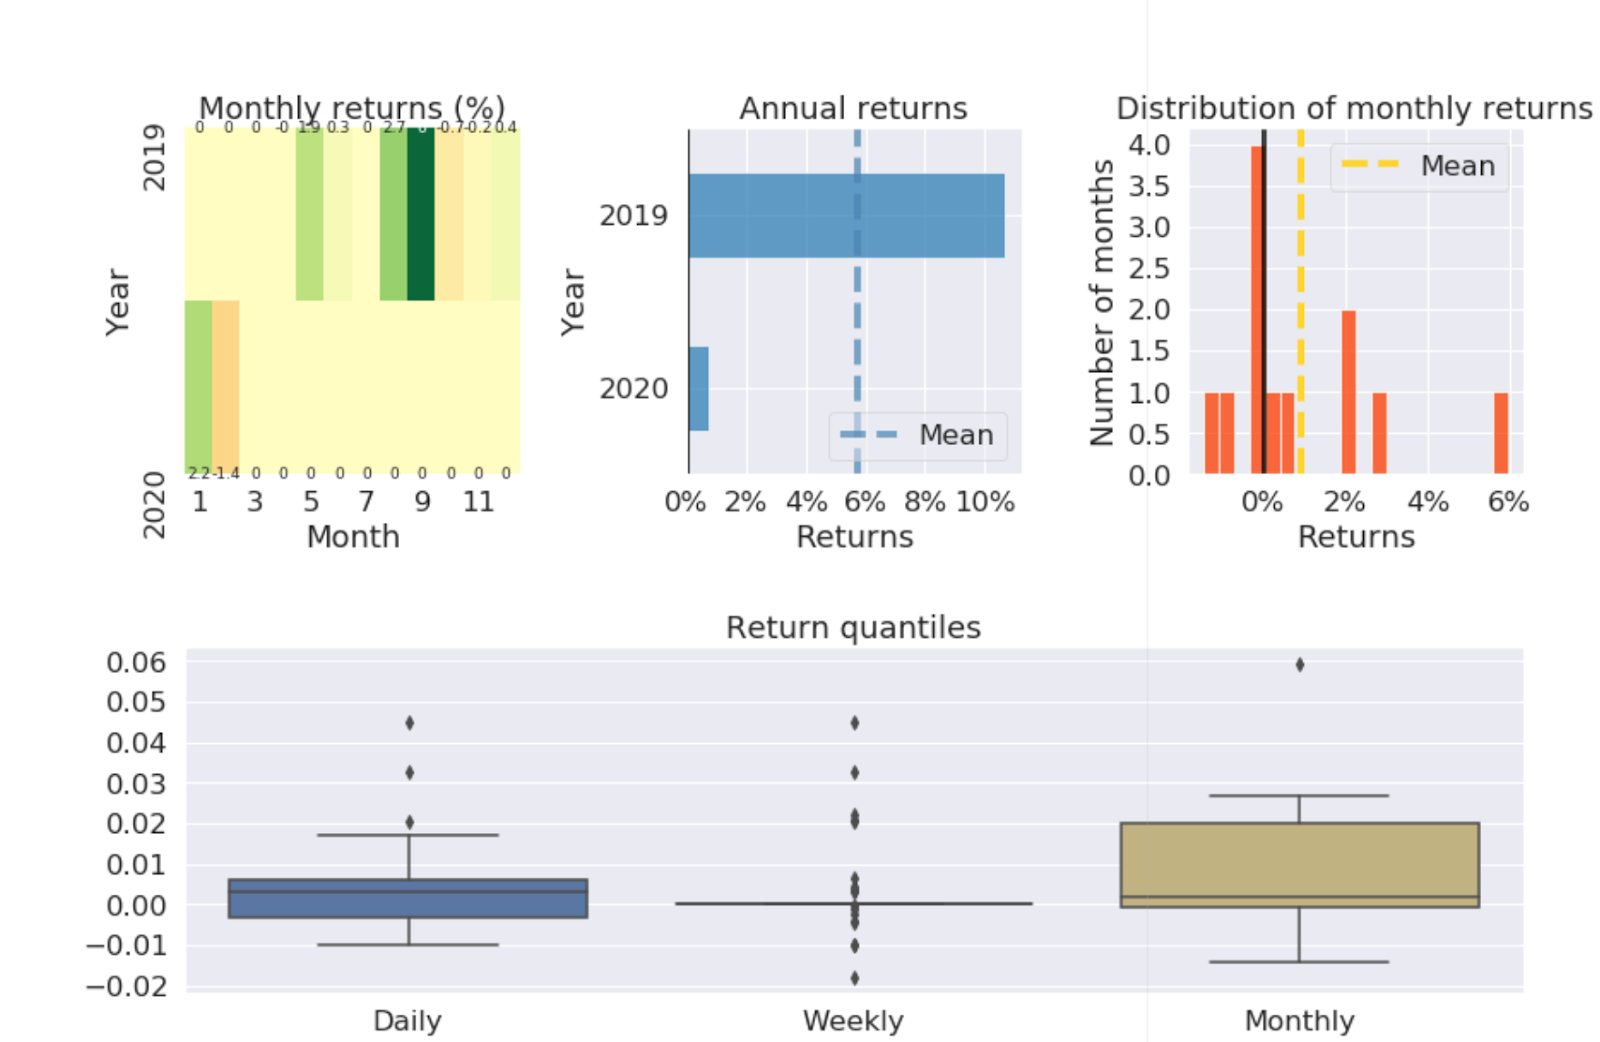
Reports
Here we can see a complete report for XAG/USD generated with PyFolio library:

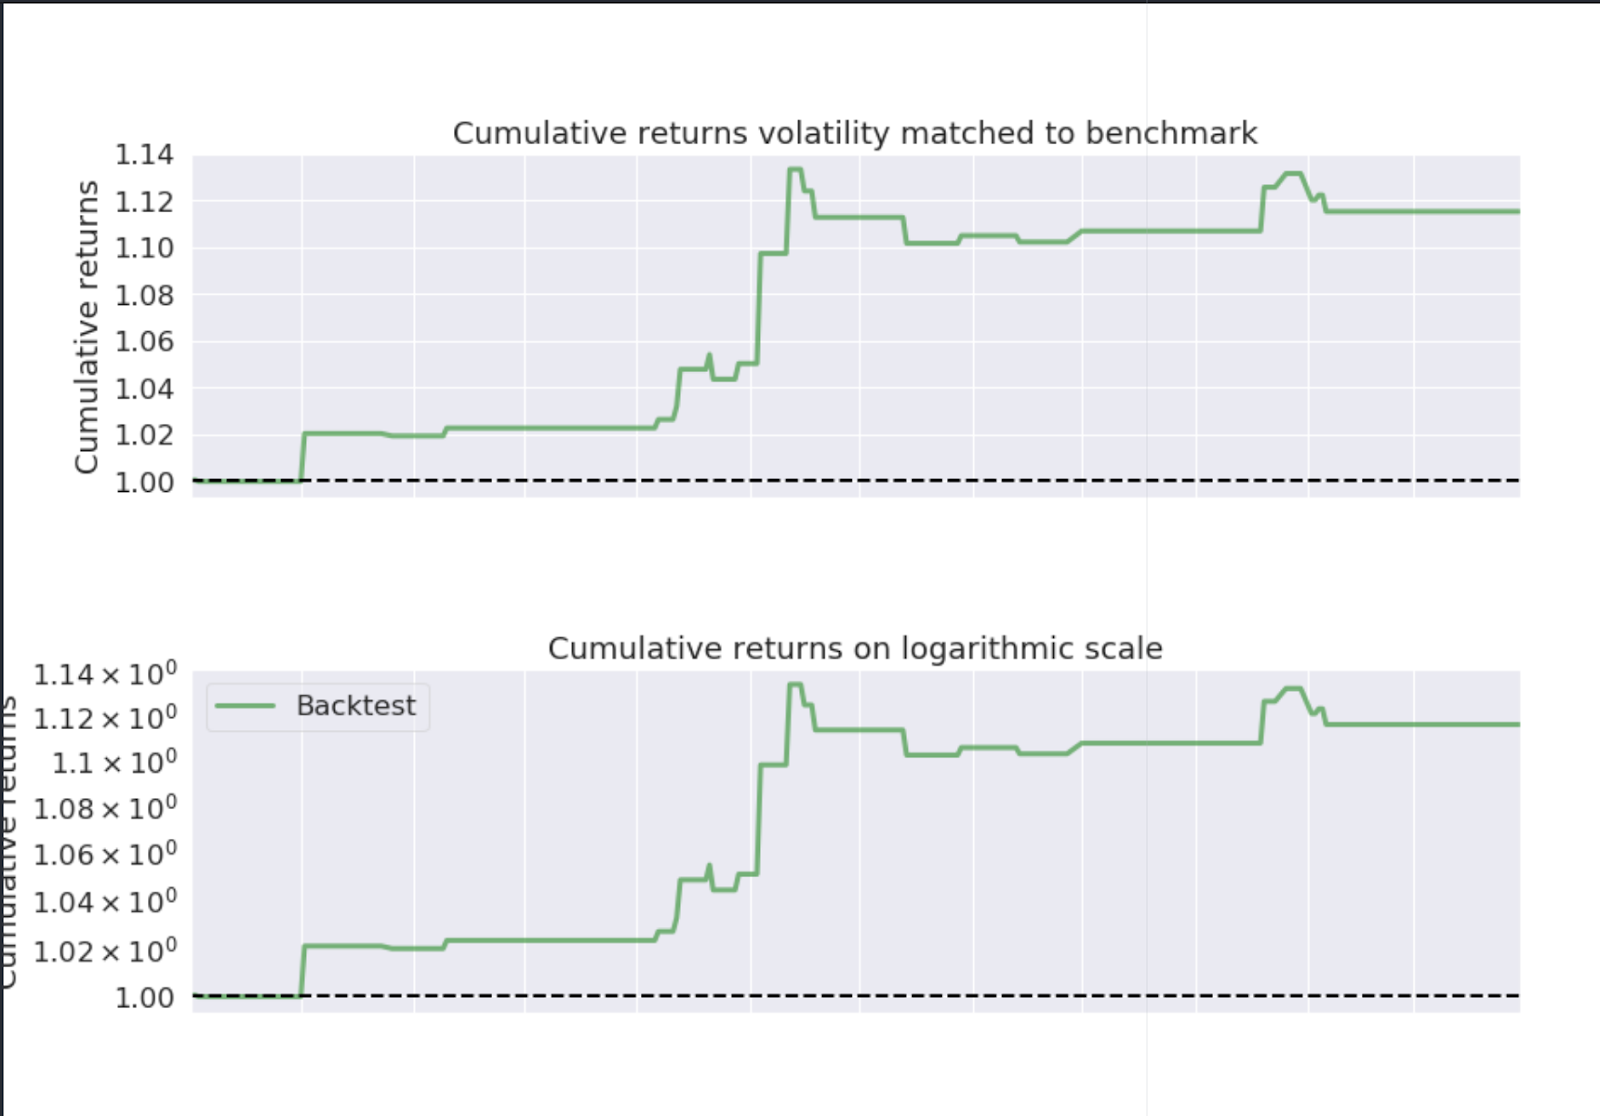
Conclusion
All backtests show that the strategy delivers positive results. And it should normally deliver more signals per month as seen in the live environment. But it does not do so for this short live period. But the backtests show also that the signals are not uniformly distributed over time. With a longer real-live period and additional instruments from another broker, the number of signals per month could be increased.
If you want to learn various aspects of Algorithmic trading then check out the Executive Programme in Algorithmic Trading (EPAT). The course covers training modules like Statistics & Econometrics, Financial Computing & Technology, and Algorithmic & Quantitative Trading. EPAT equips you with the required skill sets to build a promising career in algorithmic trading.
Disclaimer: The information in this project is true and complete to the best of our Student’s knowledge. All recommendations are made without guarantee on the part of the student or QuantInsti®. The student and QuantInsti® disclaim any liability in connection with the use of this information. All content provided in this project is for informational purposes only and we do not guarantee that by using the guidance you will derive a certain profit.
Files in the download:
- Python notebooks
- Python codes
- Pyfolio code
