
This article helps you understand how you can build a machine learning model that could predict the next day’s currency close price based on previous days data.
The complete data files and python code used in this project are also available in a downloadable format at the end of the article.
This article is the final project submitted by the author as a part of their coursework in the Executive Programme in Algorithmic Trading (EPAT®) at QuantInsti®. Do check our Projects page and have a look at what our students are building.
About the Author
Christos Gklinavos has studied Economics, Business Administration, and Informatics. He holds a Master of Science in ICT and several certifications in programming and machine learning from Udacity, Kaggle and Google. Christos is enthusiastic about AI, Robotics, Drones and FinTech.

In July 2019, he gained the Certificate of Excellence for successfully completing the Executive Programme in Algorithmic Trading offered by QuantInsti. He has worked for two 2 years as an Independent Forex Trader using various platforms like MT4 with EAs, QuantConnect, Blueshift and InteractiveBrokers.
Currently, he is living in Ioannina, Greece, teaching Educational Robotics and he is married and has one kid.
Project Abstract
The project is about building a machine learning model that could predict the next day’s currency close price based on previous days’ OHLC data, EMA, RSI, OBV indicators, and a Twitter sentiment indicator.
It is based on a Random forests Regressor because it combines the benefits of trees’ predictive power and avoidance of overfitting. Also, the introduction of a sentiment indicator balances the limitations of technical analysis and draws information from the domain of behavioural economics.
Introduction
I think ML regression can give away insights for trading strategy setups that otherwise would remain hidden and at the same time, it isn’t so much a black box as you can evaluate the predictors and decide which ones to use.
Also, I Day trade Forex currency pairs and hopefully I could use it on real trade setups. Apply Machine Learning to predict the trend using predictors, technical indicators and a sentiment indicator, so as to create a more robust strategy that would consider both technical and fundamental aspects.
The following steps have been taken:
- Getting the data from a reliable forex data provider.
- Download historical data of 2 years as a CSV file.
- Create features.
- Use a random forest model for the problem.
- Use Cross-Validation.
- Train the model.
- Predict on the test.
- Based on tests and accuracy score make some alterations into the predictors.
- Evaluate the final model.
Data Mining
Forex currency pair of EUR/USD of a 2 years period.
Source: Historical data from mt4 trading platform from 2016-12-31 to 2018-12-31, daily timeframe, total 524 trading days.
Data Analysis
The Technical Analysis library, TA-Lib was used to compute four technical indicators, the EMA short and long, the RSI and OBV, which are commonly taught in courses for technical analysis.
The next day’s close price was used as the prediction target.
The GetOldTweets3 library was used to get historical tweets from the same period of 2016-12-31 to 2018-12-31 with a max of 5000 tweets due to time limits.
The textblob library was used to get sentiment polarity, and the data resampled using the daily timeframe for the mean calculation.
As predictors the following were used: ['open', 'high', 'low', 'close', 'volume', 'ema_short', 'ema_long', 'rsi', 'obv', 'tweet_sentiment']
Also, we made use of two splits of data. The first split the data to a training test and an untouched set. The second cross-validated the train set 5 times.
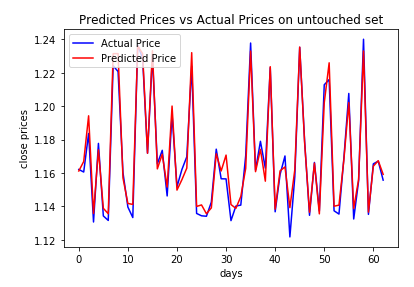
The predictive power of the model tested on the initial untouched set
Key Findings
It is possible to construct a fairly useful trading model by using ML and particularly Random Forests Regression, using as predictors a mix of price data, technical indicators, and a sentiment indicator.
ML lifts the weight from the shoulder of the trader by finding optimal combinations of various factors and components of trading.
The return of the ML strategy most of the time seems better from the simple buy and hold benchmark strategy.
Note:
cum_ret: Buy and Hold
cum_strategy_ret: Strategy Returns
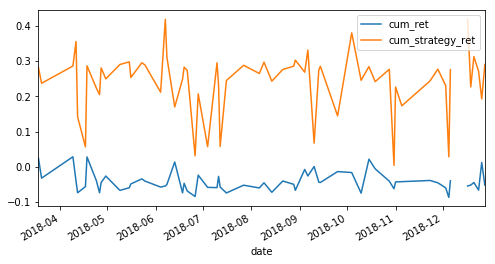
The Sharpe Ratio of strategy is approximately two most of the times of back-testing it.
Some indicative measures are:
Model score= [0.96615782505226, 0.9499368283378423, 0.9793830955075918, 0.946102298022616, 0.9707968097158307]
Importance of predictors: [0.11186647 0.12960734 0.22891741 0.20857127 0.00230334 0.13688185 0.16457009 0.01260118 0.00233765 0.00234338]
Mean Absolute Error: 0.0045143218795093976
Mean Squared Error: 2.7342703703148714e-05
Root Mean Squared Error: 0.005229025119766467
Visualizing a tree of the model
(The complete tree is available in the downloads)

Challenges
The following were a major source of concern:
- The gathering of Twitter data was problematic. The 5000 tweets were a compromise between twitter API limitation, time constraints, and local computational force.
- Thus, the final amount of useful data was small to extract robust conclusions.
- The need for splitting the data into train, test, validate, and out of sample data further worsened the statistical value of findings.
- It is hard to train and implement the model in real-time trading due to the constant need for not so readily available twitter data.
Conclusion
The model has the potential to be used in practical projects. We can see below how close the predictions on the training and the untouched set are and that it produces a better return from the benchmark with a satisfying Sharpe Ratio.
Of course, optimization could and should be done before going live, and that includes the ema periods, the picking of the most useful predictors, the use of further predictors like crossovers, the scaling of some predictors and the use of more in-depth historical data.

If you want to learn various aspects of Algorithmic trading then check out the Executive Programme in Algorithmic Trading (EPAT). The course covers various training modules and equips you with the required skill sets to build a promising career in algorithmic trading.
Disclaimer: The information in this project is true and complete to the best of our Student’s knowledge. All recommendations are made without guarantee on the part of the student or QuantInsti®. The student and QuantInsti® disclaim any liability in connection with the use of this information. All content provided in this project is for informational purposes only and we do not guarantee that by using the guidance you will derive a certain profit.
Files in the download:
- Source.gv.pdf
- Tweets.csv
- Final_Project_Christos_Gklinavos_v6.html
- Final_Project_Christos_Gklinavos_v6.ipynb
- Forex.csv
- Source.gv
Bibliography
- What Does the Individual Option Volatility Smirk Tell Us About Future Equity Returns? | Journal of Financial and Quantitative Analysis | Cambridge Core
- Random Forests Classifiers in Python (article) - DataCamp
- Decision Forest Regression - Azure Machine Learning Studio | Microsoft Docs
- (50) Azure Machine Learning Studio: Decision Forest Regression - YouTube
- Getting started with Neural Network for regression and Tensorflow
- How (not) to use Machine Learning for time series forecasting: Avoiding the pitfalls
- Practical Deep Learning for Coders, v3 | fast.ai course v3
- Why Random Forests can’t predict trends and how to overcome this problem?
- Sentiment Analysis in Trading Explained Using R
- Trading Commodities Using Natural Language Processing
- Using NLP and Deep Learning to Predict the Stock Market
- Sentiment Analysis - When Commodity Trading Meets Deep Learning
- Cross-Validation in Machine Learning Trading Models
- Machine Learning for Quants and Traders - QuantInsti
- How Is Machine Learning Used In The Stock Market? [PR]
- Machine Learning For Stock Price Prediction Using Regression
- Best Algorithmic Trading Blogs of 2017 – QuantInsti® – Medium
- Trading Using Machine Learning In Python Part-2 – QuantInsti® – Medium
- Development Of Cloud-Based Automated Trading System With Machine Learning [EPAT PROJECT]
- Free Forex Historical Data: Forex Currency Pairs
- Free Forex Historical Data: Forex Currency Pairs
- Forex Trading Resources - Courses, Software, Guides and More!
- TA-Lib
- python - How to run Ta-Lib on multiple columns of a Pandas dataframe? - Stack Overflow
- Using DataFrames and TA-Lib in python · Issue #120 · mrjbq7/ta-lib · GitHub
- talib.SMA Python Example
- TA-Lib
- How to find Forex historical data that will help you better backtesting
- Trading Strategy: Technical Analysis with Python TA-Lib
- 3.2.4.3.2. sklearn.ensemble.RandomForestRegressor — scikit-learn 0.20.3 documentation
- Twitter Sentiment Analysis using Python - GeeksforGeeks
- (51) Twitter Sentiment Analysis | Sentiment Analysis In Python Using Tweepy and Textblob | Edureka - YouTube
- Sentiment Analysis of Twitter Timelines – Dmitry Rastorguev – Medium
- This Is How Twitter Sees The World : Sentiment Analysis Part One
- How to get twitter historical data?
- GitHub - Jefferson-Henrique/GetOldTweets-python: A project written in Python to get old tweets, it bypass some limitations of Twitter Official API.
- GitHub - taspinar/twitterscraper: Scrape Twitter for Tweets
- How to use it? · Issue #52 · Jefferson-Henrique/GetOldTweets-python · GitHub
- GetOldTweets3 · PyPI
- python - Get data from Twitter using Tweepy and store in csv file - Stack Overflow
- Reading and Writing CSV Files in Python – Real Python
- string - Python write to CSV line by line - Stack Overflow
- TextBlob: Simplified Text Processing — TextBlob 0.15.2 documentation
- Random Forest Algorithm In Trading Using Python
- RandomForest Algorithmic Trading Strategy With 85% Winrate - Binary Options Ninja
- Gold Price Prediction Using Machine Learning In Python
- Twitter Sentiment Gather Data
- Decision Trees
- Ensemble Methods - Bagging And Boosting
- Gini Index For Decision Trees
- Detecting Bots On Twitter Using Botometer
- Cross Validation in Machine Learning Trading Models
- sklearn.model_selection.TimeSeriesSplit — scikit-learn 0.21.2 documentation
- How To Backtest Machine Learning Models for Time Series Forecasting
- Random Forest Algorithm with Python and Scikit-Learn
- Train/Test Split and Cross Validation in Python – Towards Data Science
- Predicting Stock Trends Using Technical Analysis And Random Forests
