Stochastic Oscillator is a momentum indicator which compares the recent closing price of an asset to a range of its prices over a specific period of time. While the stochastic oscillator is supposed to be similar to RSI, another technical indicator, we will see later on in the article how both indicators are different.
We will try to understand as well calculate the different types of stochastic oscillators. We will also see how they can be used to strengthen your trading skills and help you create a formidable strategy. Further we will look at how the Stochastic RSI oscillator helps overcome certain limitations of the stochastic oscillator
We will cover the following topics in this article:
- Why is Stochastic Oscillator used?
- Stochastic oscillator indicator strategies
- What is fast or slow stochastic oscillator?
- Limitations of Stochastic oscillator
- Stochastic RSI
- ATR definition and calculation
- ATR and Stochastic Oscillator
- Limitations of ATR Indicator
Why is Stochastic Oscillator used?
In the words of Dr George Lane, who helped create the Stochastic oscillator, it is an indicator which does not follow price or volume but signifies the speed, or momentum of a price. In this manner, it helps us predict a change in the direction of the price.
Thus, stochastic oscillator has become a well-known indicator among traders to identify a bullish or bearish trend in the market.
We will now understand how to plot the stochastic oscillator with the help of an example.
Example to understand Stochastic Oscillator
The stochastic oscillator consists of two lines, %K and % D.
The story goes that in the 1950s, while George Lane and his colleagues were trying to plot different oscillators by hand, they would run out of chart paper due to the range of values. Thus they tried to express them as percentages.
After trial and error, with each formula expressed as an alphabet, they finally managed to create a stable indicator with %K.
We will look into %K in more detail now.
Formula for calculating %K
The %K can be expressed as,
Calculating Stochastic Oscillator - Live Market Example
The accepted range is usually 14 days. We will calculate %K by using the information on the stock of Apple in the month of April-May 17.
Thus, the table would be as follows,
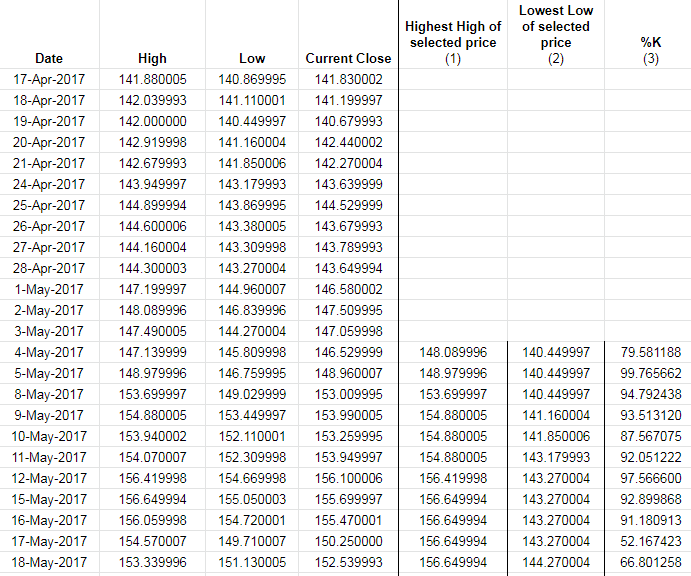
Explaining the market example
To explain this, let’s take the example of %K for the row with date 4 May 2017.
- To select the Highest high of selected price (1), we check the dates from 17 April to 4 May of the column, “High”, which is 148.089996
- For Lowest Low of selected price (2), the value is 140.449997
- To calculate the %K, the formula is,
[(Current closing price) - (lowest low price in selected range)] * 100
[highest high price in selected range) - (lowest low price in selected range)]
= [146.529999 - 140.449997] / [148.089996 - 140.449997] * 100
= (6.080002 / 7.639999) * 100
= 0.7958118 *100
=79.58118%
Similarly, we fill in the rest of the fields as well.
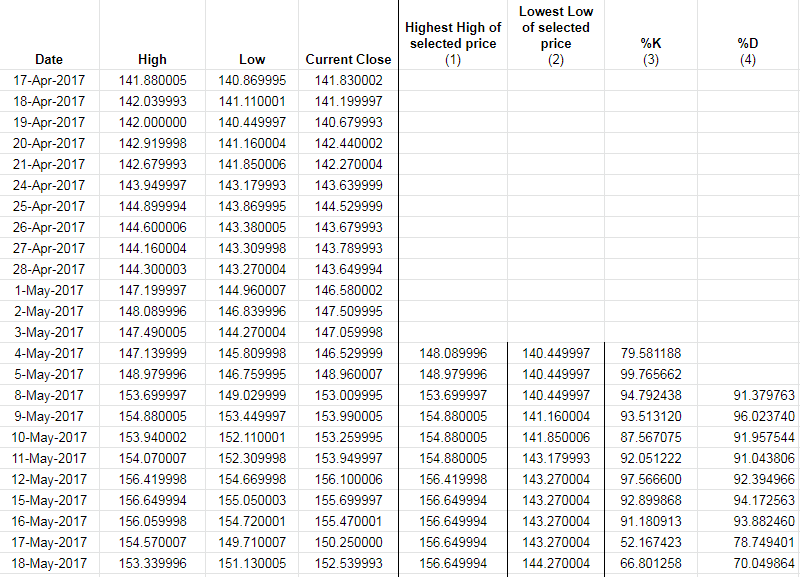
4. %D is simply the 3-day simple moving average (SMA) of the %K.
Thus, the table will be updated as follows,
Graph of the outcome using Stochastic Oscillator
A graph of the Stochastic oscillator with respect to the closing price will be shown as follows:

Stochastic Oscillator Indicator Strategies
The Stochastic oscillator indicator is used in the following manner:
Overbought and Oversold signals
The Stochastic oscillator Indicator is usually used to generate overbought or oversold signals. In this regard, both %K and %D play a vital role.
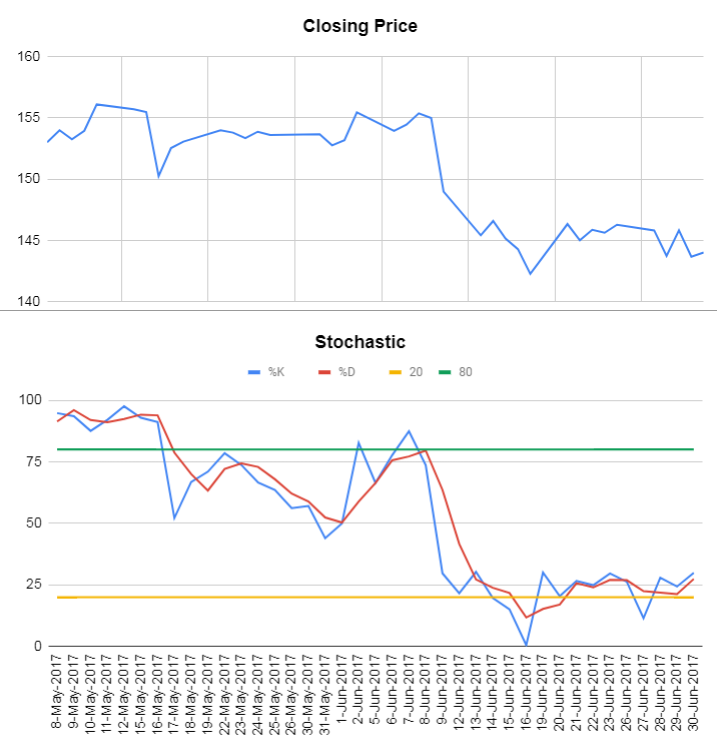
You can see in the above image the %K and %D lines touch the overbought level and on 9 June they turned downward, with the price following soon after.
Divergence indicator (Bulls and Bears)
We have seen this strategy in the previous indicator series, and the Stochastic oscillator can also be used to detect a swing in the market or rather, a change in the trend of the market.
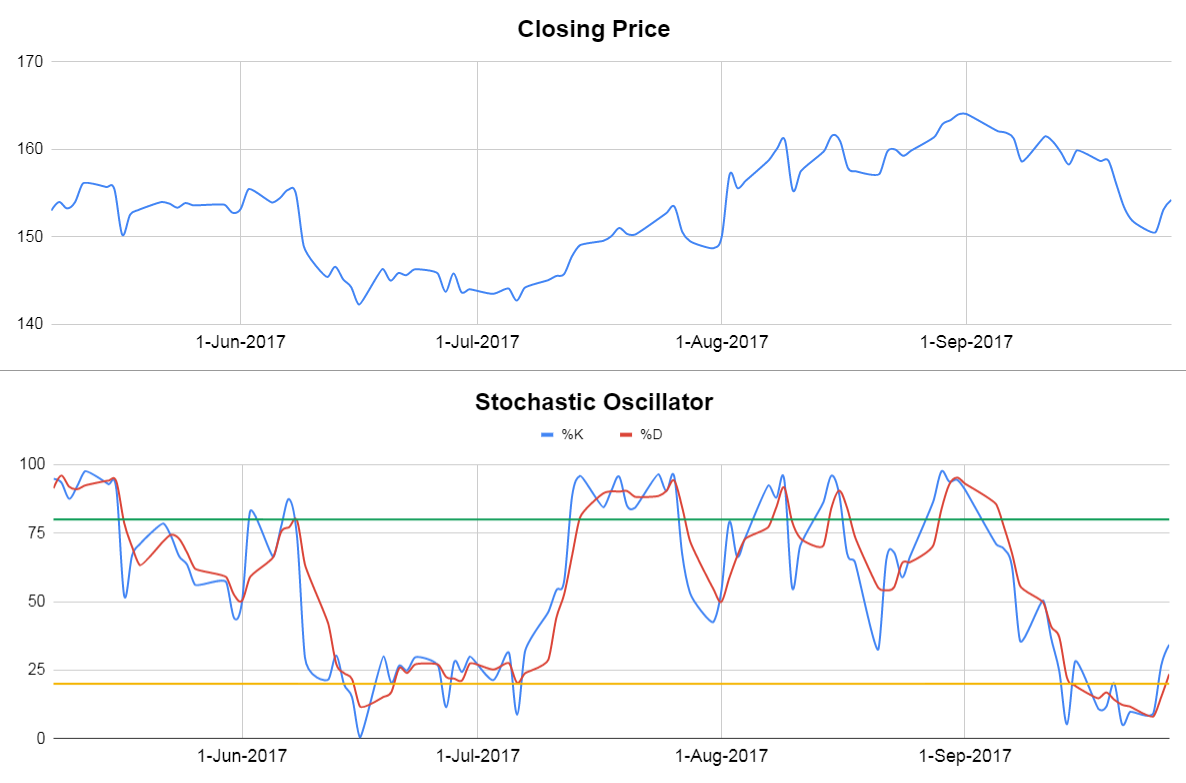
In the graph above, you can see that in the last week of August, the Stochastic oscillator started declining and following this, the price, from 1 September and barring a short-lived uptrend, kept declining till the end of September.
Crossover strategy
There are two types of signals in this strategy:
- In the overbought region, the %K line crosses below the %D line signifying a sell signal
- In the oversold region, the %K line crosses above the %D line signifying a buy signal
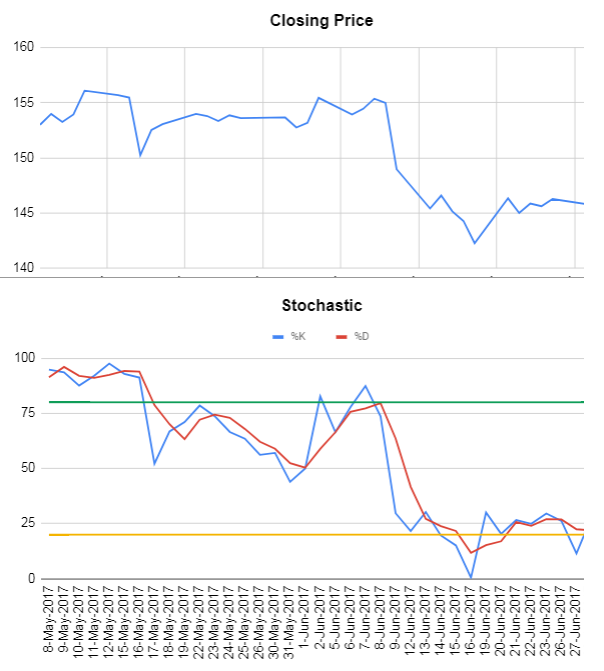
Downtrend: You can see that in the graph above, the %K line starts declining and crosses the %D line in the overbought region on 15th May, which constitutes a sell signal. You can clearly see the downtrend later.
Price Increase: Also, the %K line starts increasing and crosses the %D line in the oversold region on 19th June, constituting a buy signal. You can clearly see the price increase later.
These were some strategies which can be used with the help of the Stochastic indicator. While the stochastic oscillator was a good indicator to identify overbought or oversold levels, the market found it was haphazard, or sloppy to make the readings more meaningful. Thus, another type of Stochastic oscillator was born. We will cover this in the next section.
What is a fast Stochastic oscillator? And what is a slow Stochastic oscillator?
The reason we use two lines is that we can use the crossover of the two lines as a signal, more specifically, the %D line can be called the signal line.
To emphasize the importance of the %D line, the stochastic oscillator was modified into two types:
- Fast Stochastic Oscillator, and
- Slow Stochastic Oscillator
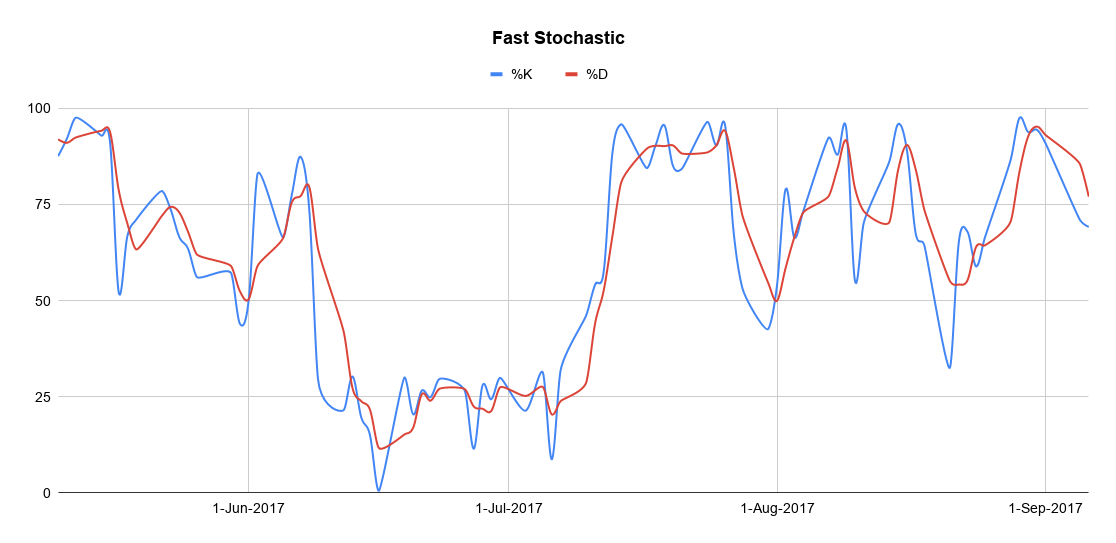
Calculating the fast stochastic oscillator
The indicator which we calculated is considered as the fast stochastic oscillator.
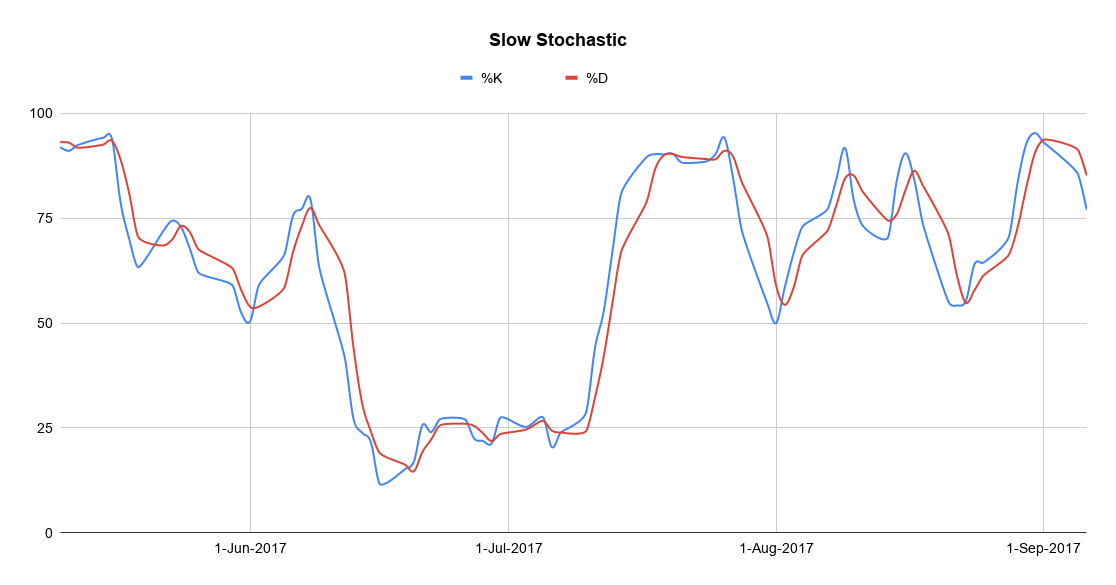
Calculating the slow stochastic oscillator
To calculate the slow stochastic, we find the 3-day SMA of the %K (essentially the same as the earlier %D).
The %D becomes the 3-day SMA of the new slow stochastic oscillator.
This helps us in another form, as the original stochastic oscillator was said to be very choppy and thus the slow stochastic oscillator serves to smoothen the movements.
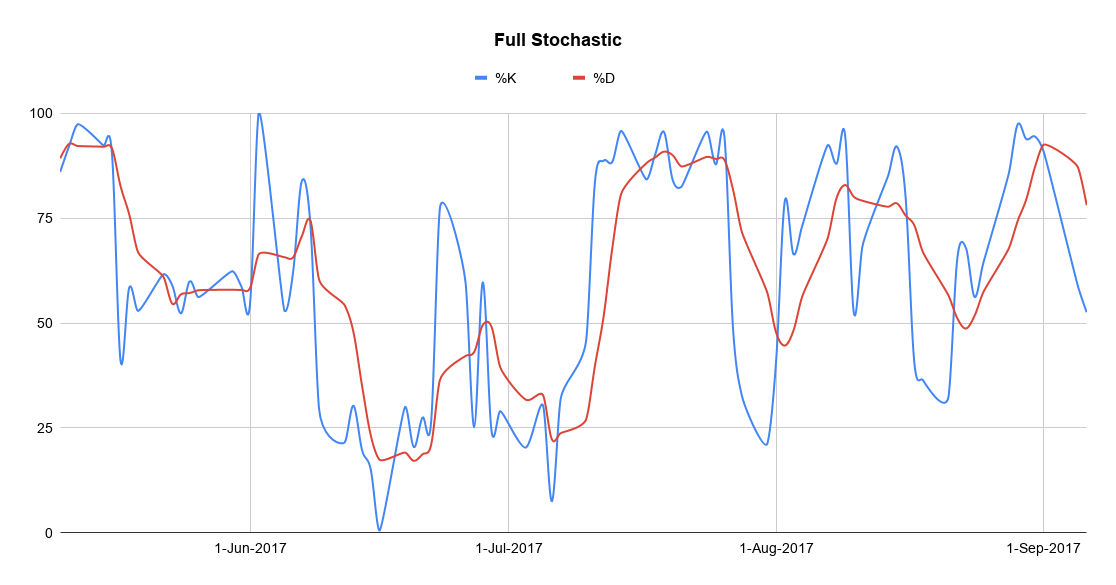
Calculating the full stochastic oscillator
Another version, known as the Full stochastic, is the type when we modify the period of %K as well as the number of days to take into account while calculating the full stochastic oscillator. Let’s consider the time period for calculating %K of the Full stochastic oscillator as 10 and the %D is the 5 day SMA of full %K.
Comparing fast, slow and full stochastic oscillators
Thus the three types of stochastic oscillators would be as follows:
Difference between Stochastic Oscillator Indicator and RSI Indicator
The Relative strength index (RSI) indicator and the Stochastic oscillator are both momentum oscillators and are used to measure the momentum of the price movement, but they are fundamentally different.
While RSI is used to detect the velocity of the market trend, the stochastic oscillator is built on the premise that the closing price should close in the same direction as the general trend.
Interestingly, in spite of the difference, it was found that combining them together actually made sense and thus, the Stochastic RSI (stochRSI) indicator was created. We will talk about this in the next section.
Limitation of Stochastic Oscillators
As with other indicators, the Stochastic Oscillator also suffers from the problem of false signals.
The stochastic oscillator is usually used in a market where the prices swing regularly and thus, it can give a false signal if the price is in a long term trending position.
In the previous section of the stochastic oscillator tutorial, we covered the different types of Stochastic Oscillators and went through a few basic strategies based on them. However, we did not cover an indicator which can be called a combination of two indicators, which is the Stochastic RSI indicator. In addition to it, we will also cover another indicator, the ATR indicator and learn how it can be used along with a few other popular indicators.
Stochastic RSI
Chande and Kroll, the creators of Stochastic RSI said that on its own, the RSI indicator would usually stay between the ‘overbought’ and ‘oversold’ levels of 80 and 20 and hence, not generate a lot of buy or sell signals.
Thus, they proposed to create an indicator of an indicator by first calculating the RSI values and then applying the stochastic oscillator formula on it.
How does Stochastic RSI work?
- Calculate the RSI values with a 14 day period.
- Then find the Highest RSI value and the Lowest low RSI value
- Use the modified stochastic oscillator formula ie
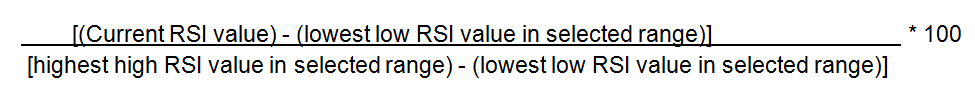
To use the same data as we have used for the Stochastic Indicator, the table would be as follows,
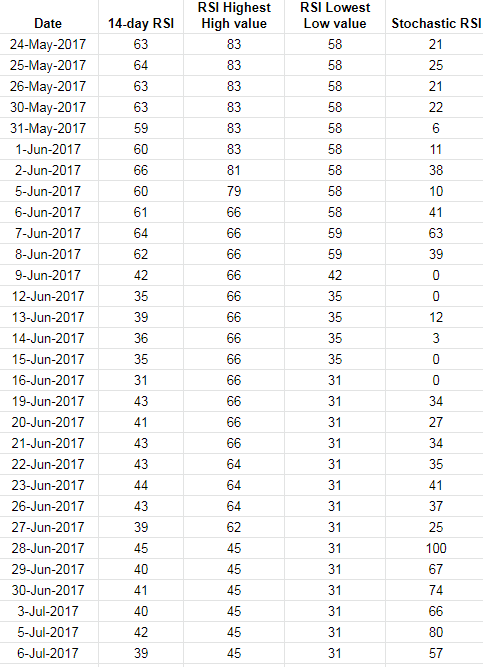
Let’s say, for the 14-day period (24 May - 13 June), the Stochastic RSI value would be calculated as follows,
= (39 - 35)/(66 -35) * 100 = (4/31)* 100 = 12.
If you plot the RSI vs the Stochastic RSI graph, it would be as follows,
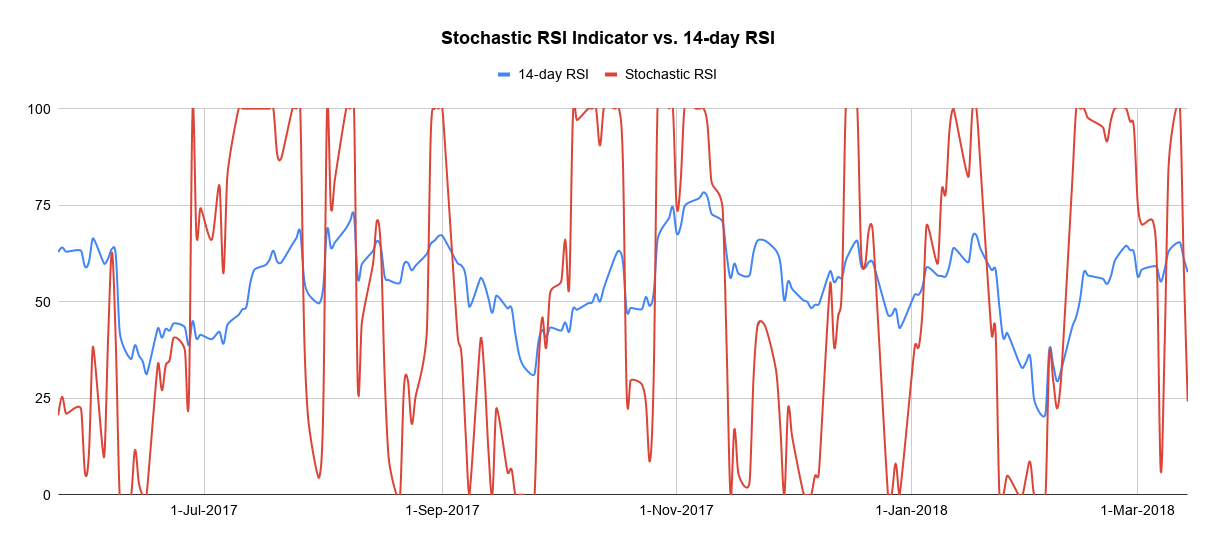
As you can see, the Stochastic RSI indicator gives more signals than normal RSI indicator. Due to the sensitivity of the Stochastic RSI, it can be used to identify short-term trends and thus, short term traders could benefit from this indicator.
Limitations of Stochastic RSI
While the Stochastic RSI was developed to improve the sensitivity of the indicator, it makes the indicator jump from overbought to oversold and vice-versa pretty quickly and thus, generate confusion among traders.
Another downside of the Stochastic RSI is that being an indicator of an indicator, it is two steps away from the price, and hence, it could become out of sync with the current market price.
A plot of the Stochastic RSI with respect to the closing price is shown below for reference.
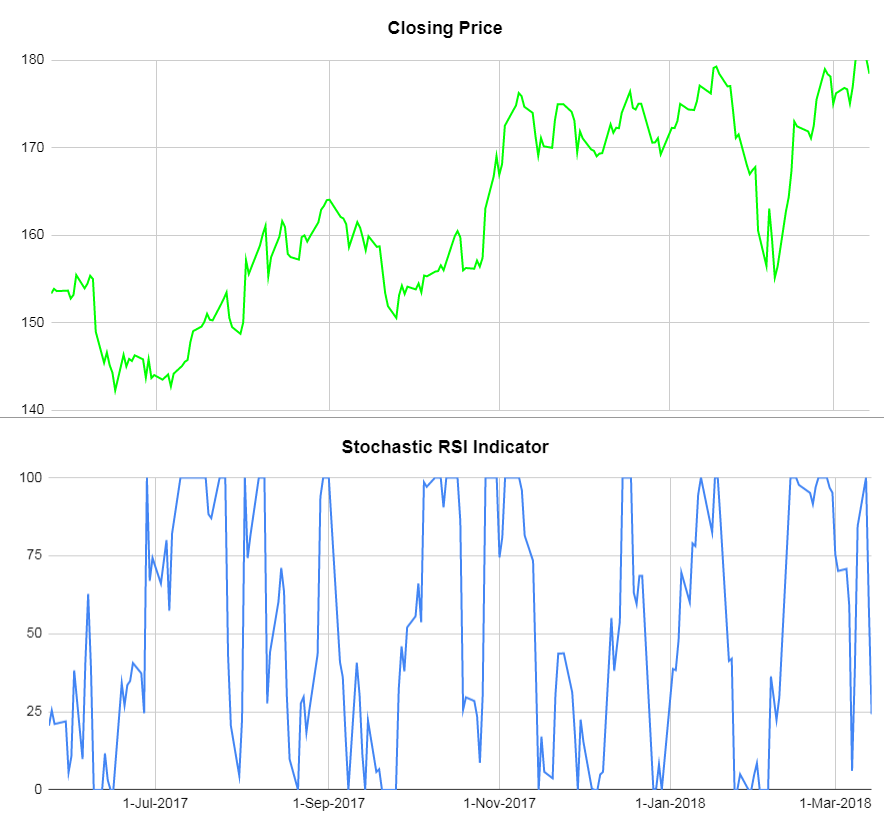
Let us know in the comments if you can form an opinion on the direction the price would go based on the graph given above.
We have reiterated before in this stochastic oscillator tutorial, that while an indicator is a good way to gauge the market, sometimes using a few indicators together is a good idea. In that respect, we will now cover the Average True Indicator which helps us in making more informed trades and usually ups our confidence level.
Average True Range (ATR) indicator definition
The reason why ATR is included in this article is two-fold: The ATR is not an indicator which can be used by itself but more as a means of validation for your observations. Thus, it instils confidence in your trading strategy. The second reason is that it works well with other indicators.
One should note that ATR captures only the volatility and not the direction of the market. Let’s see in the next section how we can find the ATR of an asset.
TR calculation
Before we calculate the Average true range, we first deduce the true range of an asset.
It is calculated as the maximum value from the following three components:
- (High - low) of the current day
- (Today’s high - yesterday’s closing price) and
- (Yesterday’s closing price - Today’s low)
Do note that for (2) and (3), we use absolute values.
To give you an example: the True range will be calculated in the following manner.
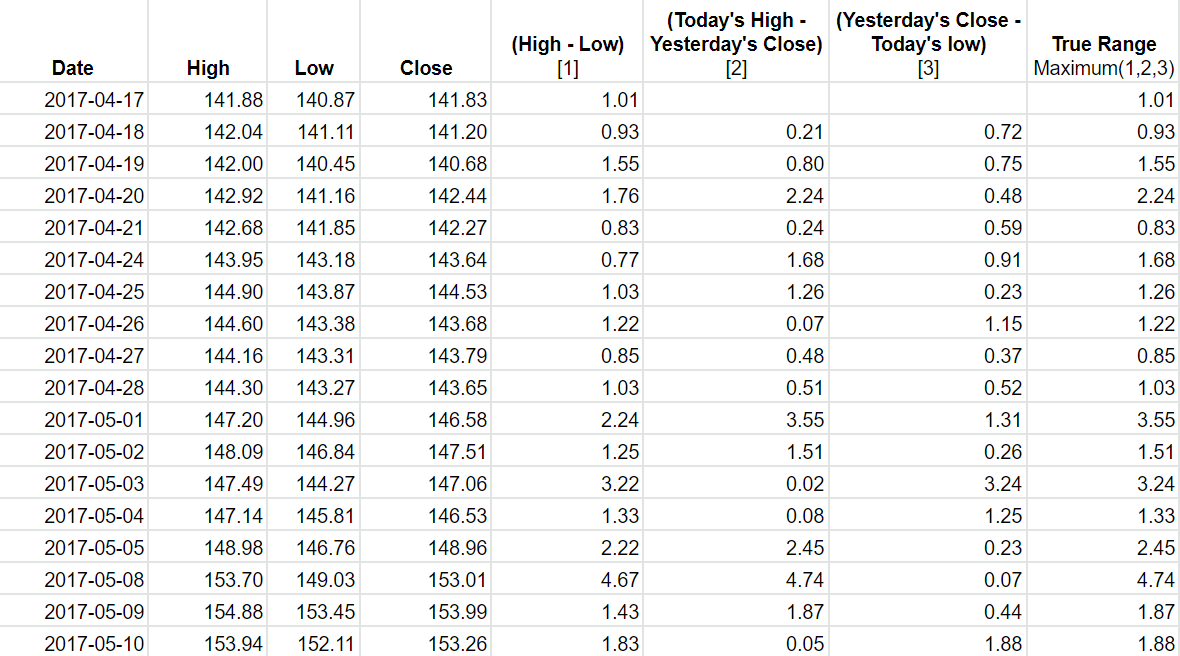
The reason we pick the maximum value out of the three values is that it helps us to capture the missing volatility which would have been ignored if we had only taken the high and low values of the present day to calculate the ATR.
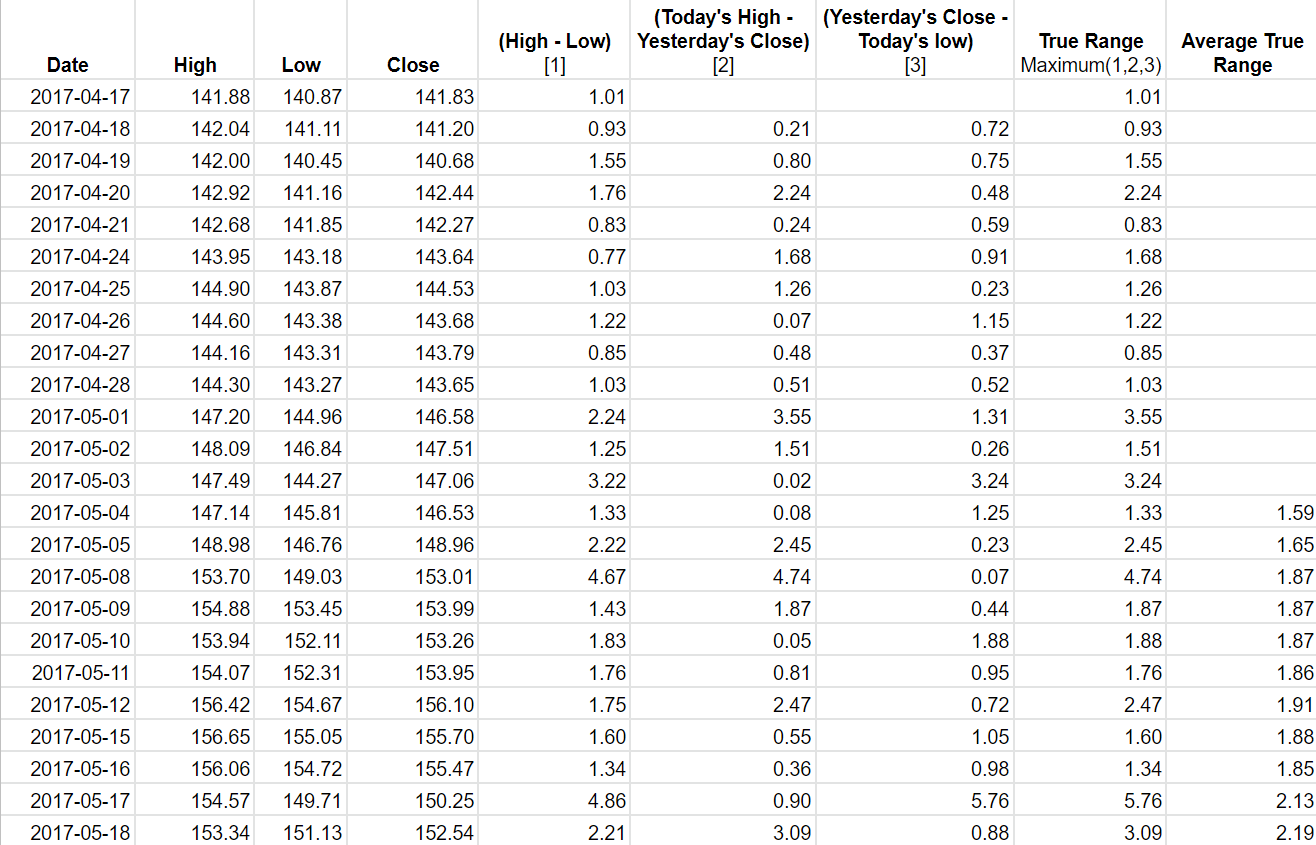
Once we have calculated the True range of the Asset, we use a 14 day period to calculate the Average True Range of the asset.
Formula to calculate ATR
Current value of ATR = [(Previous value of ATR * 13) + Current value of True Range)] / 14.
Thus, the ATR of the asset would be as follows:
The graph for the ATR with respect to the closing price would be in this manner
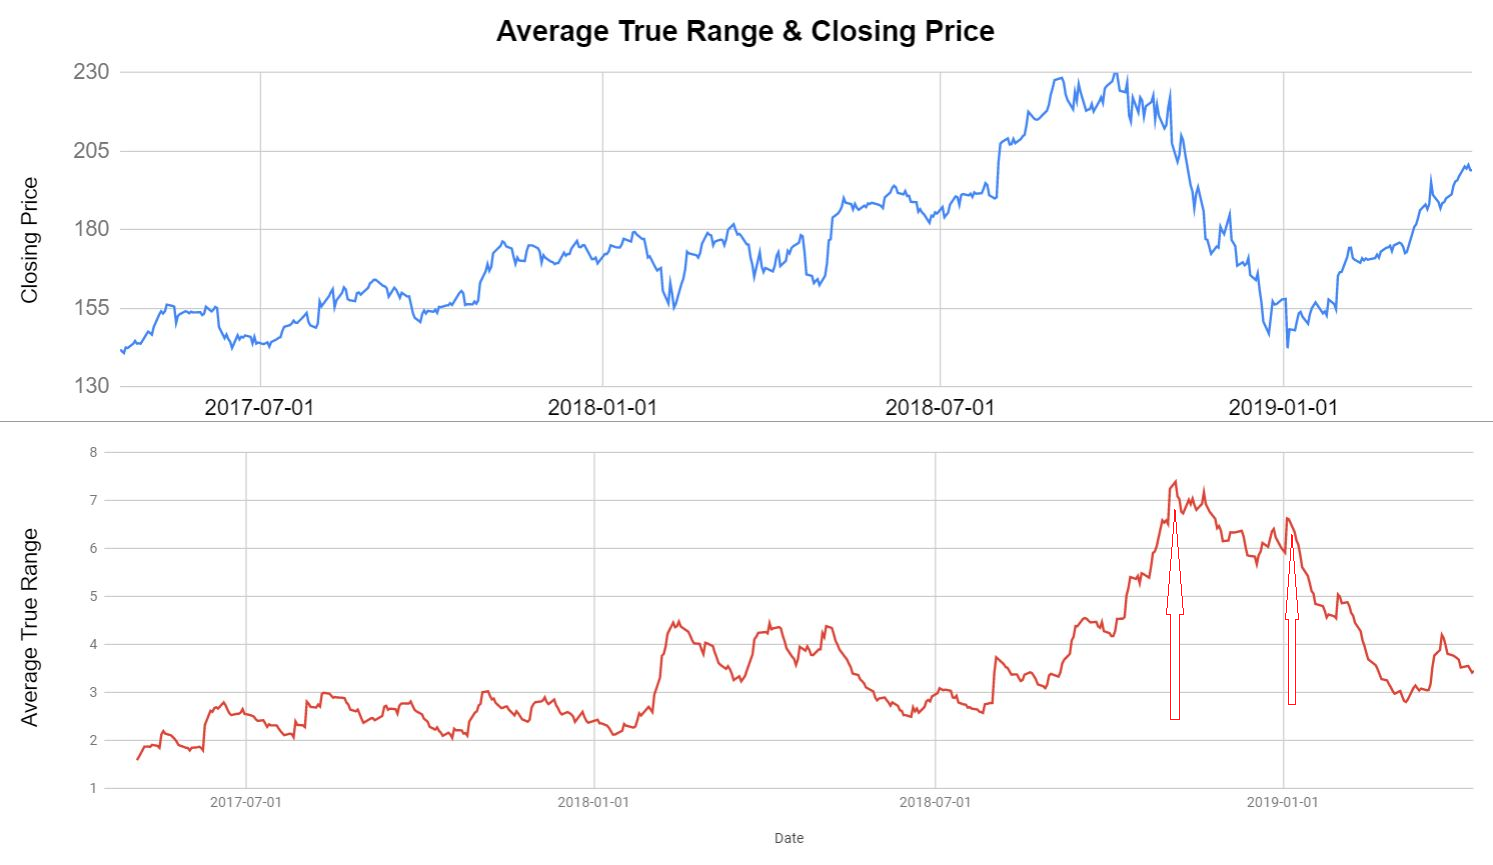
You can see that the ATR peaked when:
- The Closing price started declining sharply
- The Closing price started increasing.
Thus, the ATR is seen as confirmation that a trend reversal is going to happen.
ATR and Stochastic Oscillator
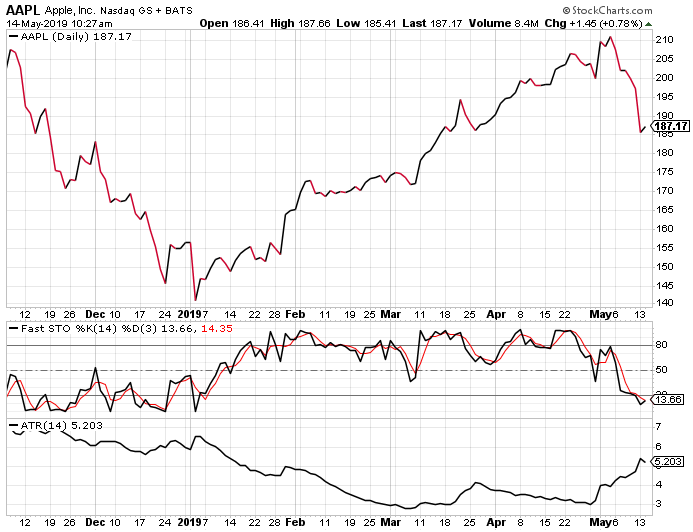
You can see that in the graph above, in the first week of January 2019, %K crosses the %D line indicating the reversal of a trend. To support this trend, the ATR is also high during the same time period. Thus, the closing price picks up later on.
Limitation of ATR
One has to understand that ATR is not used to predict the direction of the price, instead, it shows us the volatility of that particular asset. In that respect, one has to be careful when forming an opinion based on the ATR values alone. A common approach is to compare the ATR with the previous values to get an understanding of the trend of the market and of course, use it in conjunction with the other indicators such as Stochastic oscillators, RSI or MACD.
Conclusion
In summary, we have gone through the definitions as well as the calculation of the Stochastic oscillator indicators as well as the ATR indicator. We also saw a few strategies which can be used with the help of these indicators. Technical indicators do help us in understanding the market better and make informed trades. You can learn more about indicators as well as their applications in the following learning track: Algorithmic Trading for Everyone
Disclaimer: All investments and trading in the stock market involve risk. Any decisions to place trades in the financial markets, including trading in stock or options or other financial instruments is a personal decision that should only be made after thorough research, including a personal risk and financial assessment and the engagement of professional assistance to the extent you believe necessary. The trading strategies or related information mentioned in this article is for informational purposes only.