By Chainika Thakar and Rekhit Pachanekar
Machine learning is the most ideal choice for not only the financial technology domain, which algorithmic trading is a part of, but also for other industries such as healthcare, retail, education, etc.
Alan Turing, an English mathematician, computer scientist, logician, and cryptanalyst, surmised about machines that, “It would be like a pupil who had learnt much from his master but had added much more by his own work. When this happens I feel that one is obliged to regard the machine as showing intelligence."
This blog is a comprehensive guide to help you understand the basic logic behind some popular and incredibly resourceful machine learning algorithms for beginners used by the trading community, this blog is your one stop shop.
These machine learning algorithms for beginners also serve as the foundation stone for creating some of the best algorithms.
This blog covers the following:
- Machine learning in brief
- Types of machine learning algorithms
- Top 10 machine learning algorithms for beginners
- Honourable mentions
- How to choose the machine learning algorithm?
Machine learning in brief
Machine learning, as the name suggests, is the ability of a machine to learn, even without programming it explicitly. It is a type of Artificial Intelligence which is based on algorithms to detect patterns in data and adjust the program actions accordingly.
Let us understand the machine learning concept with an example.
It is well known that Facebook’s News feed personalised each of its members’ feed using artificial intelligence or let us say machine learning. The software uses statistical and predictive analytics to identify patterns in the user’s data and uses it to populate the user’s Newsfeed.
If a user reads and comments on a particular friend’s posts then the news feed will be designed in a way that more activities of that particular friend will be visible to the user in his feed. The advertisements are also shown in the feed according to the data based on the user’s interests, likes, and comments on Facebook pages.
Components of machine learning algorithms
1. Representation: It includes the representation of data. It is done through decision trees, neural networks, support vector machines, regressions and others.
2. Evaluation: It is the way to evaluate programs. It involves accuracy, probability, squared error, margin, and others.
3. Optimization: It is the way programs are generated and it uses combinatorial optimization, convex optimization, and constrained optimization.
Types of machine learning algorithms
The types of machine learning algorithms are divided into 4 main categories, which are:
- Supervised
- Semi-supervised
- Unsupervised
- Reinforcement learning
Supervised
In supervised learning, the machine learns with the help of information provided manually. This information is imparted to the machine with the help of examples. The machine is fed the desired inputs and outputs manually. After learning from the fed information, the machine must find a method to determine how to arrive at those inputs and outputs.
The machine is fed the information via algorithms and with this information, the machine identifies patterns in data, learns from the observations and makes predictions. The machine makes predictions and is corrected manually in case of any mistakes. This process of trial and error continues until the machine achieves a high level of accuracy/performance.
In the case of supervised machine learning, there are these two types:
- Classification - The machine is fed the data with different categories. In the case of classification, the machine learns which category the new data go to.
For instance, the categories in the data fed to the machine can be stock prices and returns. The machine learns to filter the data into the stock price and returns by looking at the existing observational data.
- Regression - A regression implies the statistical relation of the dependent variable to one or more independent variables. The regression model shows whether the changes in the dependent variable are associated with the changes in one or more independent variables. Independent variables are also known as 'predictors', 'covariates', 'explanatory variables' or 'features’.
For instance, the stock price is the dependent variable whereas the returns is the independent variable. Any changes in the dependent variable, that is, the stock price will lead to a change in the independent variable, that is, the returns.
Semi-supervised
Semi-supervised learning is similar to supervised learning. In the case of semi-supervised learning, the machine learns with the help of both labelled and unlabelled data. Labelled data holds the critical information so that the algorithm can understand the data, whilst unlabelled data lacks that information. By using the permutations and combinations of the labelled data, machine learning algorithms can learn to label the unlabelled data independently.
Unsupervised
Unsupervised learning is a type of machine learning in which only the input data is provided and the output data (labelling) is absent. Algorithms in unsupervised learning are left on their own without any assistance, to find results on their own and in this method of learning there are no correct or wrong answers. You can learn all about in this course on unsupervised learning course.
Some of the popular unsupervised learning algorithms are:
- Hierarchical clustering: builds a multilevel hierarchy of clusters by creating a cluster tree
- k-Means clustering: partitions data into k distinct clusters based on the distance to the centroid of a cluster
- Apriori algorithm: for association rule, learning problems
Reinforcement learning
The concept of reinforcement learning is as simple as being rewarded for the right choice while being punished for the wrong.
This concept is quite straightforward as the machine learns the permutations and combinations or the patterns for which it is rewarded (positive reinforcement) and discards the ones for which it is punished (negative reinforcement).
In the case of reinforcement learning, you don’t have to provide labels at each time step to the machine. The machine initially learns to trade through trial and error and receives a reward when the trade is closed. Later, the machine optimises the strategy to maximise the rewards.
Top 10 machine learning algorithms for beginners
We will now discuss the top 10 machine learning algorithms for beginners, which are:
- Linear Regression
- Logistic regression
- KNN Classification
- Support Vector Machine (SVM)
- Decision Trees
- Random Forest
- Artificial Neural Network
- K-means Clustering
- Naive Bayes theorem
- Recurrent Neural Networks (RNN)
Linear Regression
Initially developed in statistics to study the relationship between input and output numerical variables, it was adopted by the machine learning community to make predictions based on the linear regression equation.
The mathematical representation of linear regression is a linear equation that combines a specific set of input data (x) to predict the output value (y) for that set of input values. The linear equation assigns a factor to each set of input values, which are called the coefficients represented by the Greek letter Beta (β).
The equation mentioned below represents a linear regression model with two sets of input values, x1 and x2. y represents the output of the model, β0, β1 and β2 are the coefficients of the linear equation.
y = β0 + β1x1 + β2x2
When there is only one input variable, the linear equation represents a straight line. For simplicity, consider β2 to be equal to zero, which would imply that the variable x2 will not influence the output of the linear regression model. In this case, the linear regression will represent a straight line and its equation is shown below.
y = β0 + β1x1
A graph of the linear regression equation model is shown below.
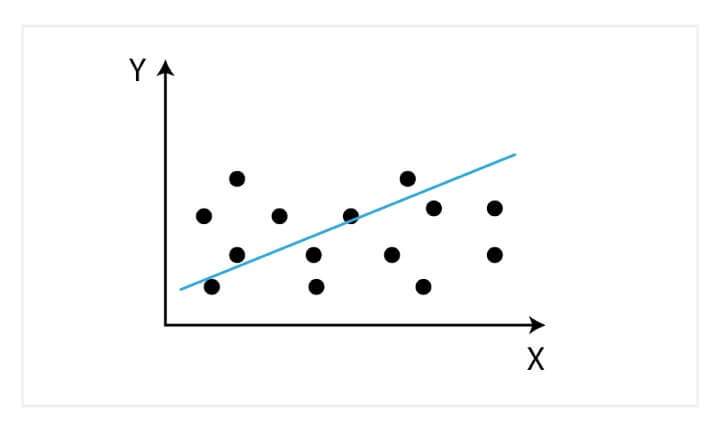
Linear regression can be used to find the general price trend of a stock over a period of time. This helps us understand if the price movement is positive or negative.
Logistic regression
In logistic regression, our aim is to produce a discrete value, either 1 or 0. This helps us in finding a definite answer to our scenario.
Logistic regression can be mathematically represented as,
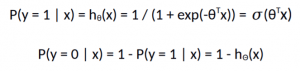
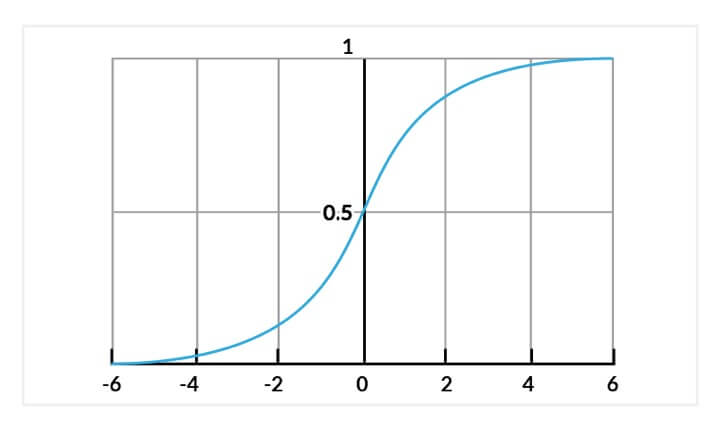
The logistic regression model computes a weighted sum of the input variables similar to the linear regression, but it runs the result through a special non-linear function, the logistic function or sigmoid function to produce the output y.
The sigmoid/logistic function is given by the following equation:
y = 1 / (1+ e-x)
In simple terms, logistic regression can be used to predict the direction of the market.
KNN Classification
The purpose of the K nearest neighbours (KNN) classification is to separate the data points into different classes so that we can classify them based on similarity measures (e.g. distance function).
KNN learns as it goes, in the sense, it does not need an explicit training phase and starts classifying the data points decided by a majority vote of its neighbours.
The object is assigned to the class which is most common among its k nearest neighbours.
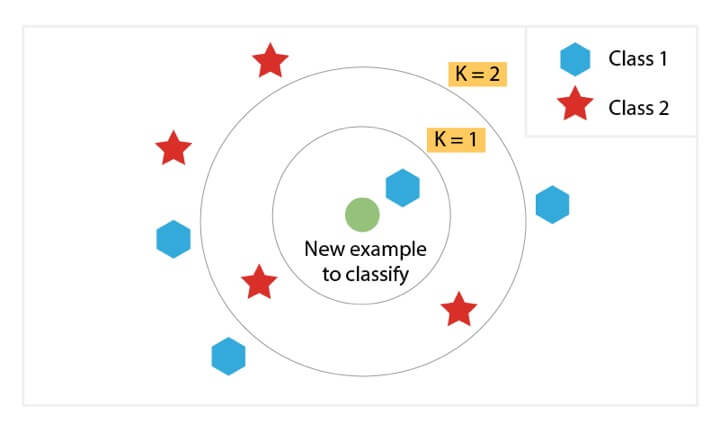
Let’s consider the task of classifying a green circle into class 1 and class 2. Consider the case of KNN based on the 1-nearest neighbour. In this case, KNN will classify the green circle into class 1.
Now let’s increase the number of nearest neighbours to 3 i.e., 3-nearest neighbours. As you can see in the figure there are ‘two’ class 2 objects and ‘one’ class 1 object inside the circle. KNN will classify a green circle into a class 2 object as it forms the majority.
Support Vector Machine (SVM)
Support Vector Machine was initially used for data analysis. Initially, a set of training examples is fed into the SVM algorithm, belonging to one or the other category. The algorithm then builds a model that starts assigning new data to one of the categories that it has learned in the training phase.
In the SVM algorithm, a hyperplane is created which serves as a demarcation between the categories. When the SVM algorithm processes a new data point and depending on the side on which it appears it will be classified into one of the classes.
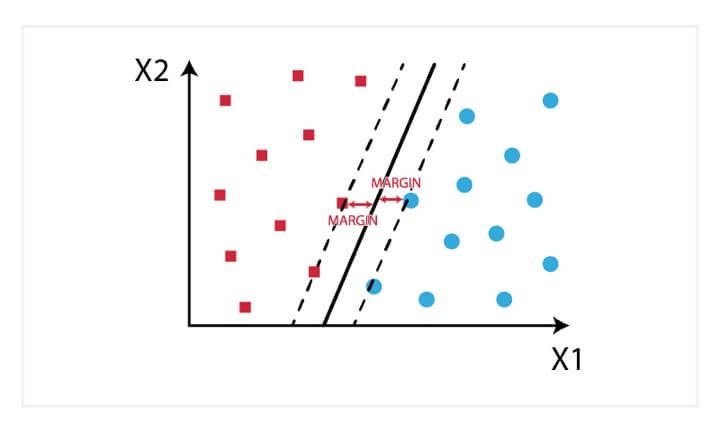
When related to trading, an SVM algorithm can be built which categorises the equity data as favourable buy, sell or neutral classes and then classifies the test data according to the rules.
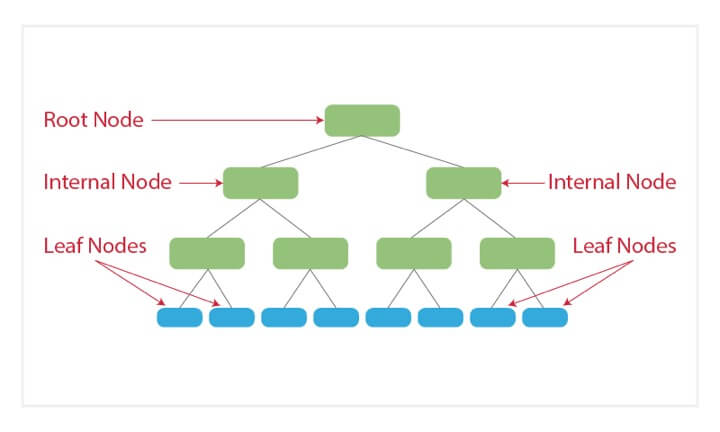
Decision Trees
Decision trees are basically tree-like support tools which can be used to represent a cause and its effect. Since one cause can have multiple effects, we list them down (quite like a tree with its branches).
We can build the decision tree by organising the input data and predictor variables, and according to some criteria that we will specify.
The main steps to build a decision tree are:
- Retrieve market data for a financial instrument.
- Introduce the Predictor variables (i.e. Technical indicators, Sentiment indicators, Breadth indicators, etc.)
- Setup the Target variable or the desired output.
- Split data between training and test data.
- Generate the decision tree training the model.
- Testing and analysing the model.
The disadvantage of decision trees is that they are prone to overfitting due to their inherent design structure.
Random Forest
A random forest algorithm was designed to address some of the limitations of decision trees.
Random Forest comprises decision trees which are graphs of decisions representing their course of action or statistical probability. These multiple trees are mapped to a single tree which is called Classification and Regression (CART) Model.
To classify an object based on its attributes, each tree gives a classification which is said to “vote” for that class. The forest then chooses the classification with the greatest number of votes. For regression, it considers the average of the outputs of different trees.
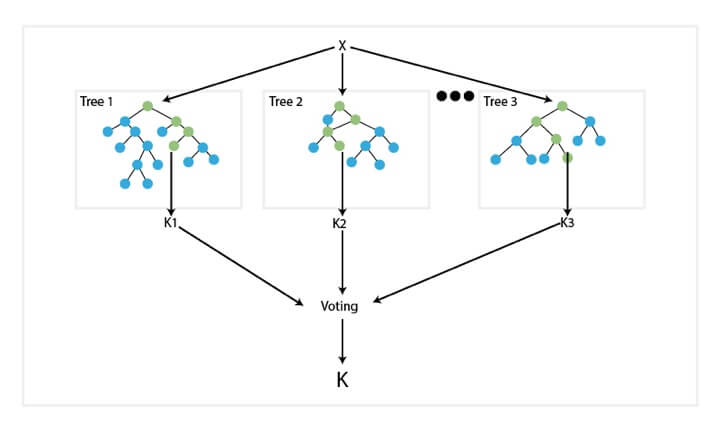
Random Forest works in the following way:
- Assume the number of cases as N. A sample of these N cases is taken as the training set.
- Consider M to be the number of input variables, a number m is selected such that m < M. The best split between m and M is used to split the node. The value of m is held constant as the trees are grown.
- Each tree is grown as large as possible.
- By aggregating the predictions of n trees (i.e., majority votes for classification, the average for regression), predict the new data.
Artificial Neural Network
In our quest to play God, an artificial neural network is one of our crowning achievements. We have created multiple nodes which are interconnected to each other, as shown in the image, which mimics the nerons in our brain. In simple terms, each neuron takes in information through another neuron, performs work on it, and transfers it to another neuron as output.
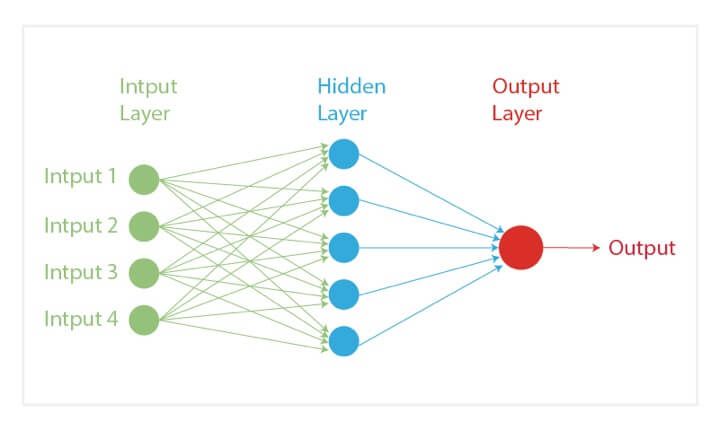
Each circular node represents an artificial neuron and an arrow represents a connection from the output of one neuron to the input of another.
Neural network for trading can be more useful if we use it to find interdependencies between various asset classes, rather than trying to predict a buy or sell choice.
K-means Clustering
In this machine learning algorithm, the goal is to label the data points according to their similarity. Thus, we do not define the clusters prior to the algorithm but instead, the algorithm finds these clusters as it goes forward.
A simple example would be that given the data of football players, we will use K-means clustering and label them according to their similarity. Thus, these clusters could be based on the striker's preference to score on free kicks or successful tackles, even when the algorithm is not given pre-defined labels to start with.
K-means clustering would be beneficial to traders who feel that there might be similarities between different assets which cannot be seen on the surface.
Naive Bayes theorem
Now, if you remember basic probability, you would know that Bayes theorem was formulated in a way where we assume we have prior knowledge of any event that is related to the former event.
For example, to check the probability that you will be late to the office, one would like to know if you face any traffic on the way.
However, the Naive Bayes classifier algorithm assumes that two events are independent of each other and thus, this simplifies the calculations to a large extent. Initially thought of as nothing more than an academic exercise, Naive Bayes has shown that it works remarkably well in the real world as well.
The Naive Bayes algorithm can be used to find simple relationships between different parameters without having complete data.
Recurrent Neural Networks (RNN)
Did you know Siri and Google Assistant use RNN in their programming? RNNs are essentially a type of neural network which have a memory attached to each node which makes it easy to process sequential data i.e. one data unit is dependent on the previous one.
A way to explain the advantage of RNN over a normal neural network is that we are supposed to process word character by character. If the word is “trading”, a normal neural network node would forget the character “t” by the time it moves to “d” whereas a recurrent neural network will remember the character as it has its own memory.
Honourable mentions
Apart from the top 10 machine learning algorithms that we discussed above, there are some others that we will discuss here
- AdaBoost or Adaptive Boost
- Gradient Boost
- XGBoost
- LightGBM
AdaBoost or Adaptive Boost
AdaBoost, or Adaptive Boost, is similar to Random Forests because several decision trees help with predictions in this type of machine learning algorithm. However, there are three unique featuresof AdaBoost, which are:
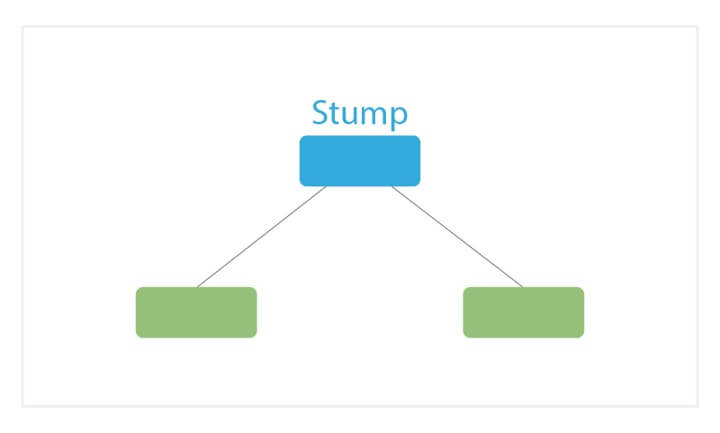
- AdaBoost creates a forest of stumps rather than trees. A stump is a tree that is made of only one node and two leaves (as shown in the image above).
- The stumps that are created are not equally weighed in the final decision (final prediction). Stumps that create more error will have less say in the final decision.
- Lastly, the order in which the stumps are constructed is important, because each stump aims to reduce the errors that the previous stump(s) made.
Gradient Boost
Gradient Boost is also an ensemble algorithm that uses boosting methods to develop an enhanced predictor. In many ways, Gradient Boost is similar to AdaBoost, but there are some key differences:
- Gradient Boost builds trees and not stumps. The tress usually have 8–32 leaves.
- Gradient Boost views the boosting problem as an optimization problem, where it uses a loss function and tries to minimize the error. This is why it’s called Gradient boost, as it’s inspired by gradient descent.
- Lastly, the trees are used to predict the residuals of the samples (predicted minus actual).
While the last point may have been confusing, all that you need to know is that Gradient Boost starts by building one tree to try to fit the data, and the subsequent trees built after with an aim to reduce the residuals (error).
It does this by concentrating on the areas where the existing learners performed poorly, similar to AdaBoost.
XGBoost
XGBoost is one of the most popular and widely used algorithms today because of its useful features. It is similar to Gradient Boost but has a few extra features to supplement the usefulness. These features are:
- A proportional shrinking of leaf nodes (pruning) — used to improve the generalization of the model
- Newton Boosting — provides a direct route to the minima than gradient descent, making it much faster
- An extra randomization parameter — reduces the correlation between trees, ultimately improving the strength of the ensemble
- Unique penalization of trees
LightGBM
If you thought XGBoost was the best algorithm out there, think again. LightGBM is another type of boosting algorithm that has been shown to be faster and sometimes more accurate than XGBoost.
What makes LightGBM different is that it uses a unique technique called Gradient-based One-Side Sampling (GOSS) to filter out the data instances to find a split value.
This is different from XGBoost which uses pre-sorted and histogram-based algorithms to find the best split.
Now that you have learnt about some popular machine learning algorithms for beginners, let us also find out how to choose the one that fits your requirements.
How to choose the machine learning algorithm?
These steps help you find out the relevant steps for choosing the machine learning algorithm fit for you:
Step 1 - Selecting the algorithm as per the goal
It is well understood now that machine learning solves the problem of reaching your goal. So, first of all, let us see what is your goal for which we are selecting the algorithm.
In case your goal is to find out which two stocks are co-integrated for a pairs trading strategy, you will feed the cointegration formula to the reinforcement algorithm. The reinforcement algorithm will select the co-integrated stocks as the reward will get triggered and discard others.
Similarly, if you want your machine learning algorithm to learn to pull the data for the mentioned stocks, you can simply feed the supervised algorithm with the data consisting of OHLCV values.
Step 2 - Find out the speed and training time
Well, this is an important step since it will define the speed of your algorithm and the time it takes to be trained.
But, would you even need an extremely fast processing algorithm even if it means lower quality of training and eventually, the predictions?
Hence, you must go for a proper time allocation and such an algorithm which takes optimal training time and also has an optimal speed.
Step 3 - The number of features and parameters should be set
In case you want the machine learning algorithm to be fed a lot of features and parameters, then you must give it as much time as well. The number of features and parameters will decide the complexity of your machine learning algorithm.
Also, the more features, the more time it will take to train. Hence, you must choose the algorithm with the capacity to train for a longer time with accurate data.
Conclusion
According to a study by Preqin, 1,360 quantitative funds are known to use computer models in their trading process, representing 9% of all funds. Firms organise cash prizes for an individual's machine learning strategy if it makes money in the test phase and in fact, invests its own money and takes it in the live trading phase. Thus, in the race to be one step ahead of the competition, everyone, be it billion-dollar hedge funds or individual trade, all are trying to understand and implement machine learning in their trading strategies.
You can go through the AI in Trading course on Quantra to learn these algorithms in detail as well as apply them in live markets successfully and efficiently.
You can enrol in the learning track on Machine learning & Deep learning on Quantra which covers classification algorithms, performance measures in machine learning, hyper-parameters, and the building of supervised classifiers.
Note: The original post has been revamped on 27th January 2023 for accuracy, and recentness.
Disclaimer: All data and information provided in this article are for informational purposes only. QuantInsti® makes no representations as to accuracy, completeness, currentness, suitability, or validity of any information in this article and will not be liable for any errors, omissions, or delays in this information or any losses, injuries, or damages arising from its display or use. All information is provided on an as-is basis.