By Ishan Shah
On 2 April 2025, SPY closed at about $565. Say you bought it at that close and placed a stop-loss $5 below your entry price. If SPY dropped to $560, your order would trigger to limit the loss.
Late that afternoon, the US government announced new tariffs, triggering an immediate sell-off. SPY fell about 2% in after-hours trading (CNBC via NBC New York).
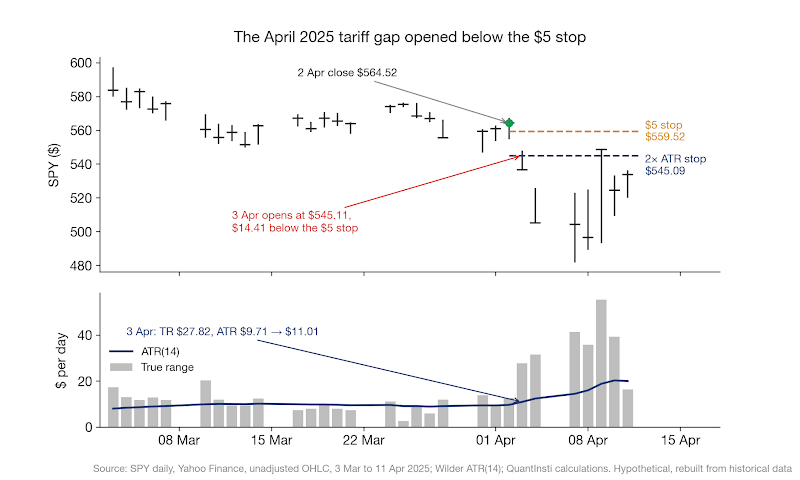
The next morning, SPY opened at about $545. That was about $14 below your stop. Your stop couldn't sell at $560, because SPY never traded there. It sold near the opening price instead. So you lost about $19 a share, not $5. With 100 shares, a planned loss of $500 became almost $2,000.
This is a paper trade, rebuilt afterwards from historical data. We picked the date because we already knew what happened next. That makes it a good teaching story, but not evidence that any rule works.
So where should that stop have gone? To answer that, you need to know how much SPY usually moves in a day. The Average True Range (ATR) measures exactly that. We'll use this one trade to build the whole idea.
We will be covering the following points in this article:
- Was the $5 stop too tight to begin with?
- What is the true range?
- How is ATR calculated?
- Can we work one out by hand?
- How do you calculate ATR in Python?
- How do you know if an ATR is high or low?
- Where would an ATR stop have gone?
- How many shares should you have bought?
- What else do traders use ATR for?
- Is ATR useful for stocks?
- Why not just use standard deviation?
- What can't ATR tell you?
- Frequently asked questions
Was the $5 stop too tight to begin with?
Yes, and by a lot. Let's look at the three months before the trade, 3 January to 2 April 2025. That's 61 trading days. On 26 of them, SPY's low fell more than $5 below the previous day's close.
Think about what that means. A $5 stop placed at any of those closes would have been hit the next day. That happened in two days out of every five. It was ordinary for SPY in early 2025.
On 2 April, SPY's ATR was $9.71. So SPY had been moving close to $10 a day. Your $5 stop sat at about half of one ordinary day's move. So even without the tariffs, it was likely to be knocked out by everyday noise.
The baseline for normal volatility also shifts significantly over time. On 30 January 2024, SPY's daily range was just $1.51. On 9 April 2025, a week after our trade, the range expanded to $55.57, about 37 times wider, and the largest single-session range from 2023 to 2026. A $5 stop is overly wide on a low-volatility day, yet far too tight on a high-volatility day. So how do you measure "normal" systematically?
What is the true range?
ATR is built from something called the true range. J. Welles Wilder Jr. introduced both in his 1978 book, New Concepts in Technical Trading Systems (StockCharts ChartSchool). The same book gave us the RSI and the Parabolic SAR. (QuantInsti has a guide to the RSI indicator if you want the other famous idea from it.)
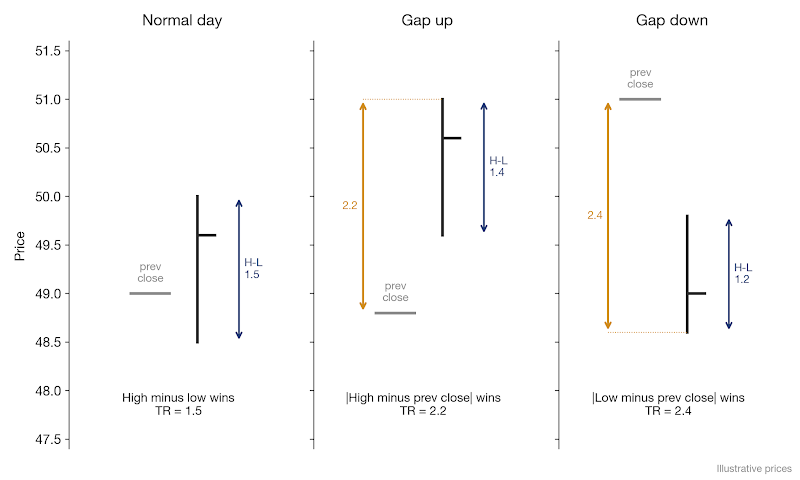
Wilder developed the indicator for commodities, which frequently gap between trading sessions. Standard high-to-low ranges miss overnight price jumps, so Wilder introduced True Range (TR) to capture total price movement. For any period, TR is the maximum of three values:
- the current high minus the current low;
- the absolute value of the current high minus the previous close;
- the absolute value of the current low minus the previous close.
Why the second and third? They catch gaps. On 3 April 2025, SPY's own high-to-low range was only about $11. But its low was about $28 below the previous close. The true range picks the $28, which is the move you actually lived through if you held overnight.
TR = max( High - Low, |High - Previous Close|, |Low - Previous Close| )
How is ATR calculated?
ATR is a moving average of the true range. The usual length is 14 periods. That was Wilder's choice, and nobody has shown 14 is special, so treat it as arbitrary.
Wilder didn't use a plain average, though. He set the first ATR to the simple average of the first 14 true ranges. Every ATR after that is:
ATR_t = ( Prior ATR × 13 + Current TR ) / 14
This exponential smoothing prevents ATR from overreacting to single-bar outliers. Mathematically, it is equivalent to an exponential moving average with a smoothing factor of alpha = 1/14. Some trading platforms calculate a simple 14-period average of true range instead, yielding slightly different values, so verify your platform's underlying formula.
ATR measures volatility in the asset's own price units. An ATR of $9.71 means SPY had moved about that much per day, on average, recently. It says how big the moves were. It says nothing about whether they were up or down.
Can we work one out by hand?
Yes, and it's worth doing once. Here are three made-up days of prices.
Day 1: High 50.0, Low 48.5, Prev close 49.0. TR = max(50.0 − 48.5, |50.0 − 49.0|, |48.5 − 49.0|) = max(1.5, 1.0, 0.5) = 1.5
Day 2: High 49.5, Low 48.0, Prev close 49.2. TR = max(49.5 − 48.0, |49.5 − 49.2|, |48.0 − 49.2|) = max(1.5, 0.3, 1.2) = 1.5
Day 3: High 51.0, Low 49.0, Prev close 48.8. TR = max(51.0 − 49.0, |51.0 − 48.8|, |49.0 − 48.8|) = max(2.0, 2.2, 0.2) = 2.2
Look at Day 3. The bar itself only spans 2.0. But price had to travel 2.2 from the previous close to reach that high, and the true range picks that up.
A simple 3-period average would be (1.5 + 1.5 + 2.2) ÷ 3, which is about 1.73. In practice you'd use 14 periods and Wilder's smoothing. The idea doesn't change: you're averaging the true range over time.
How do you calculate ATR in Python?
It takes a few lines of pandas. The code below downloads Apple's daily prices for 2023, computes the true range and applies Wilder's smoothing over 14 periods.
Two download settings matter here. auto_adjust=False keeps the raw high, low, and close. multi_level_index=False returns plain columns, so High, Low, and Close each come back as a single Series. Without it, recent yfinance versions return two-level columns even for one ticker, and that makes the math below awkward (yfinance docs).
This seeds the first ATR with the simple average of the first 14 true ranges, as Wilder defined it, so the output matches a textbook ATR. When we ran it, Apple's first ATR (on the 14th bar) was 3.80. By 29 December 2023 it had eased to 2.57.
Is there a shorter way? Yes: true_range.ewm(alpha=1/14, adjust=False).mean(). It follows Wilder's formula but starts from the first true range instead of the 14-bar average. So its early values are a little off. On this data the gap was 0.59 on the 21st bar, and it had shrunk to almost nothing by year-end.
If you'd rather use a library, the ta package gives the same result (ta docs):
We checked it against the loop above, and from the 14th bar on the two match exactly. One thing to watch: the ta library fills the warm-up bars with 0 instead of leaving them empty. Drop those rows before you use the series, or a stop rule may read a zero ATR as "no volatility at all".
TA-Lib offers talib.ATR(high, low, close, timeperiod=14) (TA-Lib docs). It starts one bar later, on the 15th bar, because the very first bar has no previous close. Its early values differ slightly (by 0.19 on the 16th bar here), then they converge with ours. Both libraries expect plain Series, which multi_level_index=False gives you. For a longer walkthrough of coding indicators from scratch, see QuantInsti's guide to building technical indicators in Python.
How do you know if an ATR is high or low?
You can't tell from the number alone. An ATR of $2 means very different things for a $20 stock and a $2,000 stock. So divide ATR by price to get ATR as a percentage. That's usually the simplest fair way to judge it, and it lets you compare one asset with another.
Now go back to our trade. On 2 April 2025, SPY's ATR was 1.72% of price. Over the previous twelve months, the median was 1.08%. So ATR was already telling you SPY was jumpy before the tariff news. A sharp sell-off in March had widened the daily ranges. If you'd checked this one number, the $5 stop would have looked thin.
From January 2023 to September 2026, SPY's ATR was usually about 1% of price (the median was 1.07%). After the tariff news it climbed fast. On 10 April 2025 it hit $20.34, which was 3.9% of price, close to four times its usual level. By the end of September 2026 it was back to $6.61, under 1% of price.
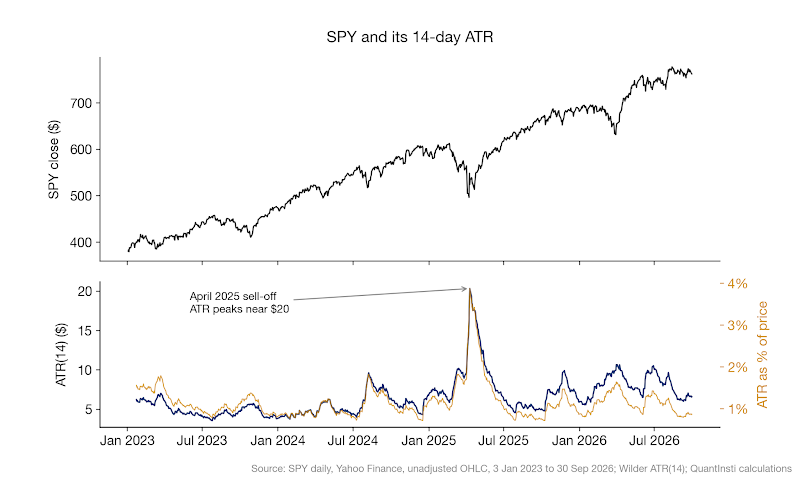
A rising ATR means daily ranges are getting wider, often around news or market stress. A falling ATR means things are calming down. Volatility tends to cluster: calm days tend to follow calm days, and wild ones follow wild ones. That's why today's ATR is a fair first guess for tomorrow's range.
Where would an ATR stop have gone?
Stops are the first place most traders use ATR. A common approach puts the stop 1.5 to 2 times ATR away from entry. Those multiples are rules of thumb, as arbitrary as the 14. So test what suits your market.
Long stop = Entry price − (2 × ATR)
On 2 April, 2 × ATR was $19.42. So a 2× ATR stop sat at $545.09, not $559.52. That's a big difference. And it's interesting to see how it behaved in those 61 days before the trade. A 2× ATR move below the previous close happened only once, on 10 March.
So the ATR stop kept clear of ordinary noise. An ATR stop sits wider when the market is wild and tighter when it's calm. That keeps the chance of being knocked out by noise roughly the same in both conditions. The cost is that each stop-out loses more per share. That's why ATR stops and ATR sizing go together, as you'll see in the next section.
But did the ATR stop save you on 3 April? Not really. SPY opened at $545.11, just two cents above it. It traded as low as $536.70 and closed there. Daily bars can't show the exact minute the stop was hit. They only show that the day's low was far below it. A stop is a trigger, not a promised price. Once it's hit, it becomes an order to sell at the next available price. In a fast market like that one, your fill could have been a few dollars lower.
There's also a trailing version of the ATR stop, called the chandelier exit. Chuck LeBeau developed it. Its standard form trails a long stop at the highest high of the last 22 days minus 3 times the 22-day ATR (StockCharts ChartSchool). Many traders use a variant that tracks the highest high since entry instead.
Chandelier exit (long, our variant) = Highest high since entry − (3 × 14-day ATR)
Let's try it on a second paper trade, also rebuilt from historical data. The entry date is arbitrary, but we chose a window we already knew ended in a sharp fall, and that flatters any trailing stop. Say you bought SPY at the close on 15 January 2025, at about $593. Its 14-day ATR that day was $7.72, so a fixed 2× ATR stop sat at $577.
The chandelier trail starts lower than the fixed stop. But it climbs as SPY makes new highs in February. SPY closed below the trail on 25 February at $594, about where you got in. The fixed stop wasn't hit until 4 March, at $577. And on 8 April, a few days after our tariff gap, SPY closed at $496.
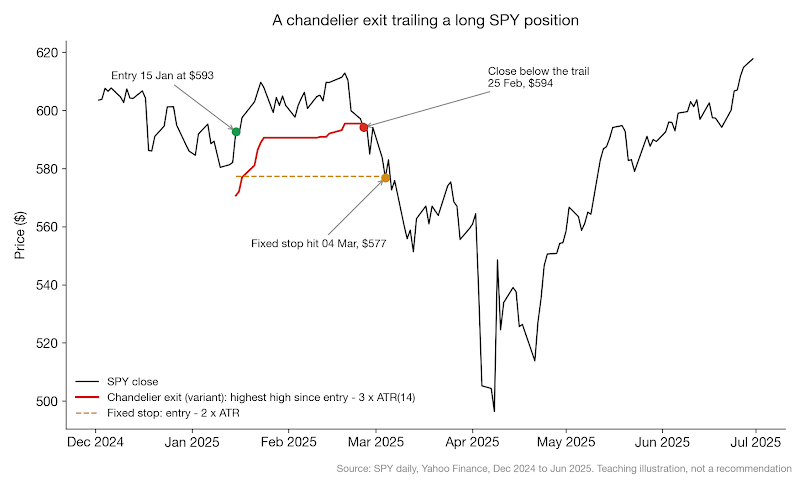
Does that mean the chandelier always does better? No. In a choppy uptrend the same trail can push you out early, and more than once. What it does is hold on to more of a move after the move has happened.
How many shares should you have bought?
Here's the surprise. Where you put the stop mattered less on 3 April than how many shares you held. ATR helps with that too.
The steps are simple. First decide how much money you're willing to lose on the trade. Then set the stop distance from ATR. Then divide:
Position size = Risk per trade ÷ (ATR-based stop distance)
Example: with an ATR of 2.00 and a 2× ATR stop, the stop distance is 4.00. Risking $500 gives $500 ÷ 4.00 = 125 shares.
Now apply it to our trade, with $500 at risk. The $5 stop lets you buy 100 shares. The 2× ATR stop is $19.42 away, so the rule buys 25 shares. Then the gap arrives. The 100 shares lose about $1,941 at the open, almost four times the plan. The 25 shares lose about $486 if they fill at the stop. If they fill at the day's low instead, they lose about $696, which is 1.4 times the plan.
Neither result is pleasant, and the ATR trader can still lose more than planned. But the smaller position kept the damage to a fraction. This is one fund on one day, so treat it as a picture of the mechanics, not proof that ATR sizing works.
When ATR is high, the stop is wider and the position is smaller. When ATR is low, the reverse happens. That keeps your planned risk roughly constant across conditions. As 3 April showed, the actual loss can still be bigger when price gaps past the stop.
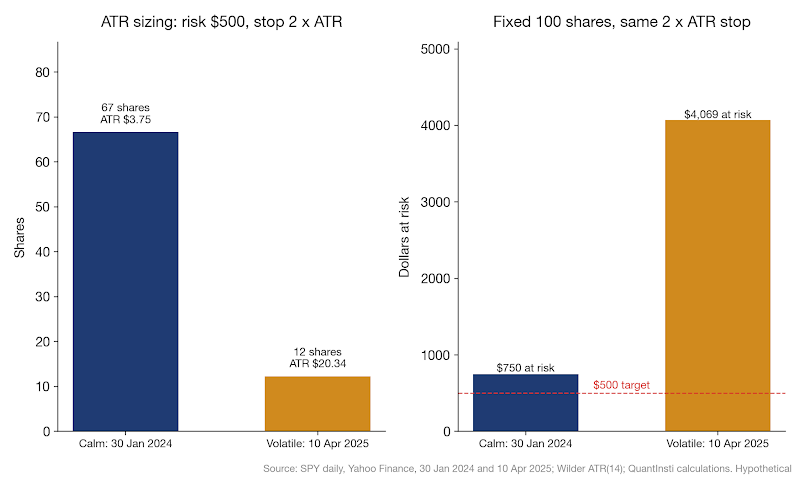
You can see the effect across calmer and wilder days too. With $500 at risk and a 2× ATR stop, the rule bought about 67 shares on SPY's calmest day of 2024 (30 January, ATR $3.75). On 10 April 2025 it bought about 12 shares. Now hold a flat 100 shares on both days instead. The money at risk jumps from $750 to $4,069. The trader and the stop rule didn't change, but the money at risk grew more than fivefold.
For more detail, see QuantInsti's guide to position sizing.
What else do traders use ATR for?
ATR sets the width of volatility channels such as Keltner Channels. In their modern form, these draw bands a multiple of ATR above and below a moving average. Chester Keltner's original 1960 version used a 10-day average of the daily high-low range instead. Linda Bradford Raschke introduced the ATR version in the 1980s (StockCharts ChartSchool).
Traders use these bands to judge breakouts and moves that have gone too far. A sharp rise in ATR after a long quiet period may also hint that a breakout has real participation behind it. Treat that as a hint, though. False breakouts widen the ranges too.
Is ATR useful for stocks?
Often, yes, mostly for sizing stops and positions around earnings, gaps and busy sessions. Single stocks gap on their own news, such as earnings, as well as on market news like the tariffs. A stop set a fixed number of dollars away can't adapt to that. ATR as a percentage of price lets you compare a large index stock with a small, fast-moving one.
Why not just use standard deviation?
You could, for some jobs. Standard deviation, which sits behind Bollinger Bands, measures how far returns spread around their average. It's usually the better tool for statistical work, because it's built on returns. Returns compare more fairly across time and across assets than raw price ranges do.
ATR measures the typical trading range in price terms, gaps included. That makes it more practical when you're deciding where a stop goes or how many shares to buy. Many traders use both: Bollinger Bands to frame price against its recent range, and ATR to set the risk on a trade.
What can't ATR tell you?
ATR looks backwards. It tells you how volatile the market has been, not how volatile it will be. On 2 April it couldn't know that a tariff announcement was coming. Nothing that reads only past prices could.
It also lags at turning points. Look again at 3 April. The true range was $27.82, almost three times the prior ATR. Yet the ATR only rose from $9.71 to $11.01, because one day gets a weight of 1/14. With Wilder's smoothing, a sudden jump in daily ranges takes about nine trading days to show up even halfway in the ATR. So a rule that resets its stop and size daily takes a while to catch up. That mattered here, because SPY gapped down again on 4 April, by about $13.
And it doesn't tell you direction. So use ATR to size and place trades, and let something else decide when to take them.
Frequently asked questions
What is the Average True Range (ATR)?
It's a volatility indicator that measures how much an asset typically moves over a period, in price terms. It shows the size of moves, not their direction.
How is ATR calculated?
First compute the true range for each period. That's the largest of the high-low range and the two gaps from the previous close. Then take a 14-period smoothed average of it using Wilder's method.
What is a good ATR value?
There isn't one, because ATR is in the asset's price units. Read it against the asset's own history, or divide it by price to compare volatility across assets.
How do I use ATR for a stop-loss?
Place the stop a multiple of ATR from entry, often 1.5 to 2 times, and size the position from that distance. The chandelier exit is a trailing version.
What is the difference between ATR and standard deviation?
ATR measures the typical trading range in price terms and includes gaps. Standard deviation measures how returns spread around their average, and it's what Bollinger Bands use.
So where should that $5 stop have gone?
About $19 away, at roughly 2× ATR, or $545. That's the plain answer, and it would have stayed clear of the noise that hit a $5 stop on 26 of the 61 days before.
It wouldn't have dodged the gap, though. SPY opened just two cents above it on 3 April. What really changed the outcome was the share count that came with it. The wider stop meant 25 shares instead of 100. That turned a loss of almost $2,000 into one of roughly $500 to $700.
The same $5 also meant very different things over time. In January 2024 it was more than one full ATR. On 2 April 2025 it was about half an ATR. A week later it was only a quarter of one. A fixed dollar stop ignores all of that. ATR doesn't, and you now have the code above to see where your own stops would have sat on the markets you follow.
Sources
- CNBC via NBC New York, Dow nosedives 1,600 points, S&P 500 and Nasdaq drop the most since 2020 after Trump's tariff onslaught (2 to 3 April 2025): https://www.nbcnewyork.com/news/business/money-report/u-s-stocks-drop-after-hours-as-trump-imposes-sweeping-tariffs-sp-500-etf-falls-2-live-updates/6210156/
- StockCharts ChartSchool, Average True Range (ATR) and Average True Range Percent: https://chartschool.stockcharts.com/table-of-contents/technical-indicators-and-overlays/technical-indicators/average-true-range-atr-and-average-true-range-percent-atrp
- Wilder, J. W. (1978). New Concepts in Technical Trading Systems. Trend Research.
- StockCharts ChartSchool, Chandelier Exit: https://chartschool.stockcharts.com/table-of-contents/technical-indicators-and-overlays/technical-overlays/chandelier-exit
- StockCharts ChartSchool, Keltner Channels: https://chartschool.stockcharts.com/table-of-contents/technical-indicators-and-overlays/technical-overlays/keltner-channels
- yfinance, download() reference: https://ranaroussi.github.io/yfinance/reference/api/yfinance.download.html
- ta library, AverageTrueRange: https://technical-analysis-library-in-python.readthedocs.io/en/latest/ta.html#ta.volatility.AverageTrueRange
- TA-Lib Python, volatility indicators: https://ta-lib.github.io/ta-lib-python/func_groups/volatility_indicators.html
- SPY and AAPL daily prices, Yahoo Finance via yfinance (SPY data used here ends 30 September 2026): https://finance.yahoo.com/quote/SPY/ and https://finance.yahoo.com/quote/AAPL/
To build indicators like ATR into tested, automated strategies with proper risk management, take a look at EPAT, the Executive Programme in Algorithmic Trading by QuantInsti. It covers the full workflow, from strategy design through Python implementation to live risk management. Explore the EPAT programme →
For a self-paced start, Quantra's volatility trading strategies course puts ATR and related measures to work with market data.
Disclaimer
This article is for education only. QuantInsti is not registered with SEBI as a Research Analyst or an Investment Adviser, and nothing here is investment advice, a research report or a recommendation to buy, sell or hold any security, fund, index product, currency or crypto asset. Where we name a security, a price or a date, it's there only to illustrate a concept with historical data. It isn't a view on where that price will go.
Past results don't indicate future results, and that applies even more to backtested or simulated results, which are built with hindsight and can leave out costs, slippage and execution limits that change the outcome. Trading involves substantial risk of loss. With leveraged products such as futures, options, CFDs and crypto derivatives, you can lose more than the money you put in.
Do your own research. Before you make any investment or trading decision, consult a SEBI-registered Investment Adviser or Research Analyst who can take your own circumstances into account.