By Dr. Euan Sinclair, Managing Partner at Talton Capital Management and EPAT Faculty
A stop-loss order, or stops as is generally said, is an order placed with the broker to sell (or buy) if the stock of a company which you hold, reaches a pre-determined price in order to avoid large losses. In the trading world, the use of stops is seen as an essential part of risk control and money management. The only reliable way to measure the true impact of any stop-loss rule on your strategy is through rigorous Python backtesting, the Quantra course on Backtesting Trading Strategies demonstrates this with worked examples using real historical data. And usually, they take the utility of stops to be self-evident.
“How can you go broke if you limit your losses?” “Cut your losses and let your profits run”. “Losers add to losers”. But as they, there is more to it than meets the eye, and the effect of stop use is quite complex and frankly speaking, interesting.
In this article we will go through the following concepts:
- The hidden cost of using a stop loss in trading
- Effect of using a stop on your expected returns
- Breaking down some common arguments given for using stops
- Are Stops just another Trend following tool?
- Which is better: Fixed Stop or Trailing Stop
The hidden cost of using a Stop Loss In Trading
First, we will understand what the use of stops does to the distribution of our trading results. A hypothetical trade result example is shown in Figure 1. The trade has a mean return of 10% and a standard deviation of 15%.
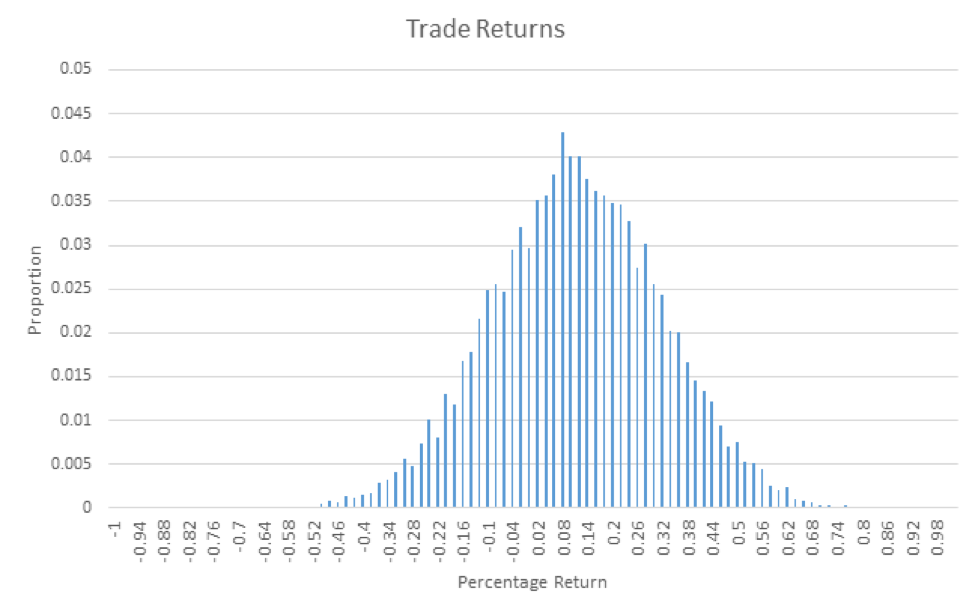
Figure 1: The return distribution of our trading strategy.
However, we can also see that a significant number of trades were losers (here nearly 11% of trades will lose more than 15%). A natural thought would be to introduce a stop loss to somehow “cut off” the left-hand side of the distribution.
It is tempting to think that the use of a stop simply truncates the downside of the distribution by capping losses at a certain level. Re-drawing the distribution to reflect this intuition gives us Figure 2, where a stop has been introduced at the 15% down level, so all losses are capped at 15%.
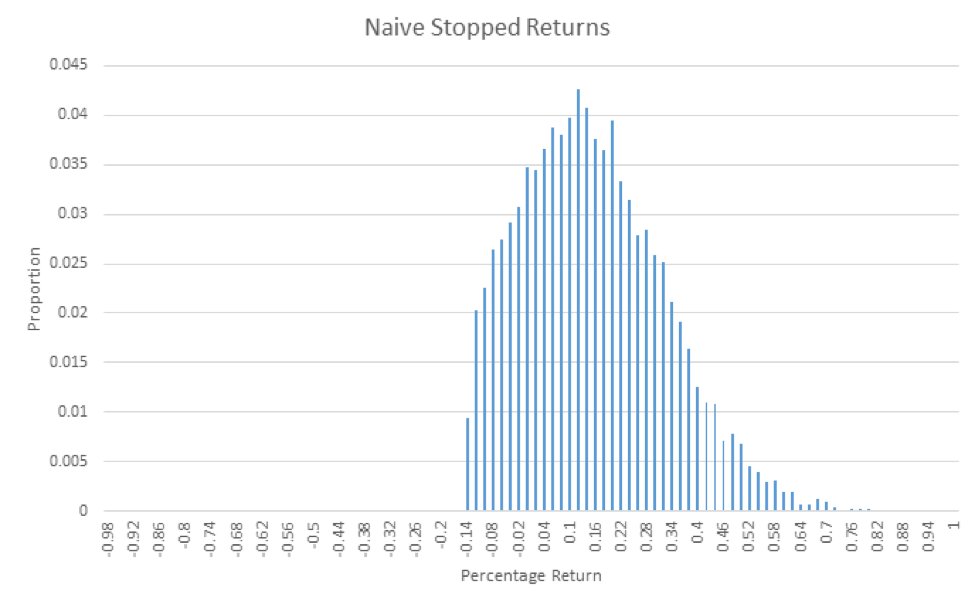
Figure 2: The hoped-for distribution when a stop has been added.
However, a little thought will be enough to see that this distribution isn’t possible. The trades that get stopped out don’t just disappear. Their results still have to be accounted for (mathematically, the integral of the probability density function must still be one). So we next surmise that these trades cluster around the level of the stop. But this still misses an important point.
Many trades at the end of the period will be small winners, would have been stopped out beforehand. Note that the large winners will still remain as these largely consist of trades that started as winners and never looked back, but the presence of a stop will drastically reduce the number of small winners. This is the hidden cost of using a stop.
Effect of using a stop on your expected returns
To see the exact effect of using a stop, I simulated 10,000 GBM paths that represented checking the performance of the trade once a day. Again the expected final return was 10%, the standard deviation was 15% and a stop was placed to cap losses at 15%. Results are shown in Figure 3.

Figure 3: The true distribution when a stop has been added.
There are several things to note here. First, the average return is negatively affected by using stops. The “unstopped” investment has a mean return of 10% (as we planned for the simulation), but when we add a stop this drops to 8.8%. This is a mathematical inevitability of assuming that the (un-stopped) results follow the normal distribution.
By adding a stop we eliminate the big losers (in this case of greater than 15%) but we also eliminate trades that would have later recovered above the stop level. And because the normal distribution has more density around the mean than it does in the wings, there are more of these marginal trades than there are big losers.
Stops don’t just stop losses. They drastically change the shape of the return distribution and can lower the average return. Adding stops won’t transform a losing strategy into a winning strategy. The only reason that we would add a stop is that we prefer the shape of the stopped distribution, i.e. we prefer to trade lots of small losses AND fewer small wins for some large losses.
While this is true, the real world is far more complex. Returns are not normally distributed and the results will change over time. Also, there is no reason a trader need only be interested in maximizing returns. Safety and risk control is important for both financial and psychological reasons.
The previous simulation was performed for only a specific process: geometric Brownian motion with positive drift. It is possible, if a little harder, to do similar analyses for cases where the trade has a more complex, realistic set of outcomes. We can add fat-tails, crashes and skewness. We can also make the results of one trade depend on previous trades. The results in all cases are basically the same: stops lower the average return and change the return distribution into something bimodal.
But what happens in actual markets where the return process is not known and is certainly not normal? Let’s get out of the realm of theory and into real markets.
Obviously, many investors like to use stops. Indeed some insist that stops are absolutely essential and that their appropriate usage is a good predictor of overall, long term success. Instead of just accepting this because someone famous has said it we should examine why this is the case. Given that most simulated tests show that stops cost money, what is it that these traders are thinking?
Breaking down some common arguments given for using stops
Stops limit losses
For any given trade this is trivially true. Ignoring slippage and trading costs, we can’t lose more than a certain pre-defined amount on any investment when we use a stop. But, as we have seen in our simple simulation, in aggregate this could be just an illusion. Using stops can actually cost us money in the long-term so this reason certainly needs more justification.
Stops are a form of discipline
It is true that if you always use stops then you have displayed discipline. But discipline needs to be about applying a sensible methodology consistently, not just doing something consistently. So this answer really isn’t an answer at all.
It is important to risk a certain set amount on each investment (one or two percent is often the amount given)
Why is this even important? This also needs to be justified not just stated. Further, trade sizing and risk control are a different issue from setting a loss for each and every single position.
A stop is really a predefined exit. We get stopped out when we don’t want to be in the position anymore.
Getting out of a position when we don’t want to be in it is an excellent idea. If we use stops to formalize this then they are perfectly sensible. But we need to think more about what this means. If we are exiting a position purely because the price has moved by a given amount then we are trend following. We are implicitly saying that the move that has already happened is predictive of a future move. This deserves to be repeated. Price based stops are a trend following system. So they may be a good deal of sense if we are explicitly betting on momentum.
Conversely, they don’t make a lot of sense if we are trading something that we expect to revert. In this case, we will be exiting trades at the points where we see the maximum potential for future profit.
Let’s look at the earlier point in detail. Rephrased, the reason we should sell out of a position that has moved against us is if, and only if, we expect the move to continue. The loss has already been incurred; we need to think about our current risk, not the sunk cost of the incurred loss. And if we are only basing the stop on the price action trading, we are saying price direction alone determines future price direction i.e. we are trend following.
This means that any test of a stop-loss rule is really a test of a trend following strategy. Stops have little to do with risk control. They are really a statement about our source of edge. Let’s see if this statement holds any weight.
Are Stops just another Trend following tool?
As a fun little exercise to see what this can lead to, I tested a very simple trading idea.
I took 10 years of SPY prices sampled at 5-minute intervals (tick data might have been better in theory but there was just too much of it).
At the start of each day, I bought one hundred shares of SPY and held for the day then sold on the close. The results are given below and illustrated in Figure 4.
Average Daily Profit: $0.49
Sharpe Ratio: 0.066
Total Profit: $1225
Maximum Daily Profit: $699
Maximum Daily Loss: $794
Win %: 54.3%
Average Win/Average Loss: 0.85
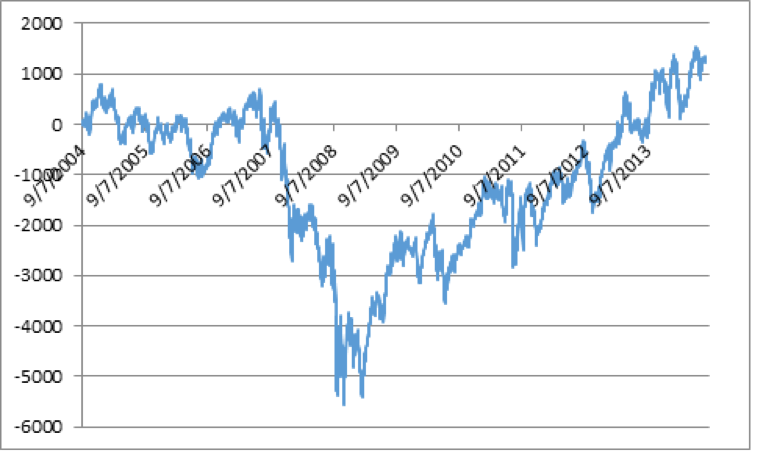
Figure 4: The results of the SPY buy and hold day strategy.
Not surprisingly, such a simple idea doesn’t perform particularly well. Now we add a stop, transforming our buy and hold trade into a trend-following strategy. Specifically, we calculated the standard deviation of the daily returns over the previous 20 days and stopped out our long position if we lost more than half that amount on any day. These were just the first parameters that popped into my head but the results are fairly robust with respect to the selection (unless we do something crazy like set the stop at such a wide amount that it is never hit). So we were using a fixed stop that was re-set each morning. The results are given below and illustrated in Figure 5.
Average Daily Profit: $1.79
Sharpe Ratio: 0.298
Total Profit: $4464
Maximum Daily Profit: $699
Maximum Daily Loss: $396
Win %: 47.0%
Average Win/Average Loss: 1.18

Figure 5: The results of the SPY strategy with a stop.
The addition of stops clearly improves results. This is nice but it isn’t really the point of this exercise. The point is that we now have the classic statistics of a trend following strategy. The buy and hold trade had a win percentage of 54.3% but adding stops drops this to 47%. But this is more than made up for by the increase in the average win-loss ratio.
I’m aware that tests of random entries are far from a new idea, but I’ve tended to dismiss them as completely misguided. In my defence, part of this conclusion was due to the misleading nature of the name. Random entries with non-random exits aren’t really random at all. An exit can easily be seen as just an entry into a cash position. But I was wrong about the larger point: implementing a trend following strategy with stops can indeed work.
In conclusion, stops do cost money and they are a trend-following tool rather than a method of risk control.
Which is better: Fixed Stop or Trailing Stop
A bit of a digression here but a common question asked is if there is any real difference between using a fixed stop at a given distance from our entry price or a trailing stop which we move so it stays a certain distance from the highest amount the investment has made. Let’s look at this in detail.
A trailing stop is a very comforting strategy. It seems to protect us from the painful experience of seeing our winners turn into losers. It DOES do this. But is something so appealing really free? Why wouldn't all investors do this?
The trailing stop costs more than the fixed stop. It actually reduces returns by more. This is because some positions that would be large winners don't get the chance to fully realize their potential. When using fixed stops, some investments benefit by getting away from the stop and having the chance to develop. Trailing stops are always in play.
Adapting our previous simulation confirms this. Before there is any stop we have a distribution with a mean of 10% and a standard deviation of 20%. But now we add a stop so that it is always 15% below the high of the trade.
The addition of a trailing stop lowers the mean return of the trade to only 4.7%. This is far lower than the unstopped return, and also lower than when employing a fixed stop. Figure 6 shows the distribution when we employ a trailing stop.

Figure 6: The return distribution of the simulated trade when using a trailing stop.
The distribution, in this case, is now totally different from that of the unstopped investment.
The general shape arises because some trades start badly and get stopped out at the worst possible level. Some make a little money and then fall back to get stopped out just above the initial stop and so forth until we reach those that never get stopped at all. As this stop is more expensive in terms of reducing a trade’s expected value, an investor must be very sure that this is the distribution he is looking for.
So the question does hold some merit. Trailing stops are indeed different. I’m not sure that they are better though. That choice would come down to individual preference.
Conclusion
We can say that while Stop-loss does give you an assurance on the amount of risk you hold but hurts your expected return on the strategy you have devised. In addition, we have also looked at stop-loss orders as a trend-following tool than a risk control measure.
This content is part of the forthcoming book, “Positional Option Trading”.
Disclaimer: All investments and trading in the stock market involve risk. Any decisions to place trades in the financial markets, including trading in stock or options or other financial instruments is a personal decision that should only be made after thorough research, including a personal risk and financial assessment and the engagement of professional assistance to the extent you believe necessary. The trading strategies or related information mentioned in this article is for informational purposes only.