
Contrary to a more developed market, arbitrage opportunities are not readily realised which suggests there might be opportunities for those looking and able to take advantage of them. This project focuses on China's futures market using Statistical Arbitrage and Pair trading techniques.
This article is the final project submitted by the author as a part of his coursework in Executive Programme in Algorithmic Trading (EPAT) at QuantInsti. Do check our Projects page and have a look at what our students are building.
About the Author
Xing Tao is a Bachelor in Computer Science (LZU), Masters in Information System and Management Science (PKU), and has passed CFA level 1-3 exams. Presently, he is an investment manager of real estates, lands and infrastructures.
Trading is one of his hobbies. He has been trying to be a quant for 5 years and is aspiring to apply for a PhD Programming in Computing Finance.
Project
The project run Augmented Dickey-Fuller test on the spread to confirm statistically whether the series is mean reverting or not, calculate Kalman Filter regression on the spread series and a lagged version of the spread series in order to then use the coefficient to calculate the half-life of mean reversion trading.
Project Motivation
Stocks cannot be shorted according to current China’s trading rules. Contrary to a more developed market, arbitrage opportunities are not readily realized. This suggests there might be opportunities for those looking and able to take advantage of them.
Therefore, I decided to focus on China’s futures market using Statistical Arbitrage and Pair trading techniques.
Strategy Idea
The trading strategy implemented in this project is called “Statistical Arbitrage Trading”, also known as “Pairs Trading” which is a contrarian strategy designed to profit from the mean-reverting behaviour of a certain pair ratio.
The assumption behind this strategy is that the spread from pairs that show properties of co-integration is mean reverting in nature and therefore will provide arbitrage opportunities if the spread deviates significantly from the mean.
Dataset
Dataset will come from China Financial Futures Exchange (CFFEX), Shanghai Futures Exchange (SHFE), Dalian Commodity Exchange (DCE) and Zhengzhou Commodity Exchange (ZCE).
All the daily data from the above four Exchanges will be accessed through UQER’s API due to the availability of data. The trading strategy will be back-tested for 678 days (the period from 3/30/2015 to 31/12/2017).
The first 542 day (the period from 3/30/2015 to 14/11/2016 accounts for 80% of total period) is the in-sample back-testing period, and the rest 136 day (the period from 15/11/2016 to 31/12/2017 accounts for 20 % of total period) is the out sample back-testing period.
China Financial Futures Exchange (CFFEX)
CFFEX is a demutualized exchange dedicated to the trading, clearing and settlement of financial futures, options and other derivatives. While this study focuses on futures markets, understanding options trading basics can help traders build a broader perspective on derivatives strategies and risk management. On September 8, 2006, with the approval of the State Council and China Securities Regulatory Commission (CSRC), CFFEX was established in Shanghai by Shanghai Futures Exchange, Zhengzhou Commodity Exchange, Dalian Commodity Exchange, Shanghai Stock Exchange and Shenzhen Stock Exchange.
Shanghai Futures Exchange (SHFE)
SHFE is organized under relevant rules and regulations. A self-regulated entity, it performs functions that are specified in its bylaws and state laws and regulations. The China Securities Regulatory Commission (CSRC) regulates it. At present, futures contracts' underlying commodities, i.e.,
- Gold,
- Silver,
- Copper,
- Aluminium,
- Lead,
- Steel Rebar,
- Steel Wire Rod,
- Natural Rubber,
- Fuel Oil and
- Zinc, are listed for trading.
Dalian Commodity Exchange (DCE)
DCE is a futures exchange approved by the State Council and regulated by China Securities Regulatory Commission (CSRC). Over the years, through an orderly operation and stable development, DCE has already become world’s largest agricultural futures market as well as the largest futures market for oils, plastics, coal, metallurgical coke, and iron ore.
It is also an important futures trading centre in China. By the end of 2017, a total of 16 futures contracts and 1 option contract have been listed for trading on DCE, which include
- No.1 Soybean,
- Soybean Meal,
- Corn,
- No. 2 Soybean,
- Soybean Oil,
- Linear Low Density Polyethylene (LLDPE),
- RBD Palm Olein,
- Polyvinyl Chloride (PVC),
- Metallurgical Coke,
- Coking Coal,
- Iron Ore,
- Egg,
- Fiberboard,
- Blockboard,
- Polypropylene (PP),
- Cornstarch Futures and
- Soybean Meal Option.
Zhengzhou Commodity Exchange (ZCE)
ZCE is the first pilot futures market approved by the State Council. At present, the listed products on ZCE include:
- Wheat (Strong Gluten Wheat and Common Wheat),
- Early Long Grain Non-Glutinous Rice,
- Japonica Rice,
- Cotton,
- Rapeseed,
- Rapeseed Oil,
- Rapeseed Meal,
- White Sugar,
- Steam Coal,
- Methanol,
- Pure Terephthalic Acid (PTA) and
- Flat Glass.
These form a comprehensive range of products covering several crucial areas of the national economy include agriculture, energy, chemical industry and construction materials.
Motivation for Choosing this Particular Strategy Domain
My focuses on China’s future market is out of the following main reasons:
- To begin with, due to the not-shorting limitation of China’s stock markets, we only can long stocks, which makes it is impossible to do pair trading with stocks in China. Because when we do pair trading, we always long few stocks and short ones with high correlation.
- What is more, there are very few algo trading firms/strategies that are operating in China’s future exchange. I believe this should provide great opportunities, as there is little competition. Contrary to a more developed market, arbitrage opportunities aren’t readily realized which suggests there might be opportunities for those looking and able to take advantage of them.
- Last but not the least, UQER provides excellent APIs, through which I can access all daily main contract data from four future exchange of China. As we all know, high-quality data plays a crucial role in algo trading. The accessibility of data is one of the important factors We should consider when we are choosing markets and strategies.
Outline
- Define our symbol pair, download the relevant price data from UQER and make sure the data downloaded for each symbol is of the same length.
- Every possible contract pair will be tested for co-integration. An ADF test will be performed such that, the alternative hypothesis is that the pair to be tested is stationary.
- Run an Augmented Dickey-Fuller test on the spread to confirm statistically whether the series is mean reverting or not. We will also calculate the Hurst exponent of the spread series.
- Run a Kalman Filter regression on the spread series and a lagged version of the spread series in order to then use the coefficient to calculate the half-life of mean reversion.
- Calculate Z-scores for trading signal, define enter and out Z-score level for back-testing.
Data Mining
Access the daily main contract data from the four future exchanges.
The daily trading prices of the main contract are accessed through UQER's API.
- The first 542 days (the period from 3/27/2015 to 14/11/2016 accounts for 80% of total period) is the in sample back-testing period, and
- The rest 136 days (the period from 15/11/2016 to 29/12/2017 accounts for 20% of total period) is the out sample back-testing period.
Find potential trading pairs
Using in sample data, an ADF test will be performed such that, the alternative hypothesis is that the pair to be tested is stationary. The null hypothesis will be rejected for p-values < 0.05.
OUT:

Data Analysis
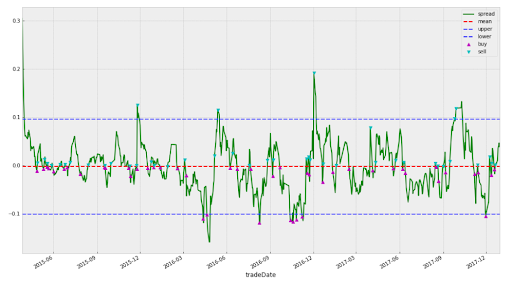
Trading logic
- Calculate the spread of each pair (Spread = Y – hedge ratio * X )
- Using Kalman Filter Regression Function to calculate hedge ratio
- Calculate z-score of ‘s’, using rolling mean and standard deviation for the time period of ‘half-life’ intervals. Save this as z-score
- Using half-life function to calculate the half-life
- Define upper entry Z-score = 2.0, lower entry Z-score = 2.0, exit Z-score = 0.0
- When Z-score crosses upper entry Z-score, go SHORT; close the position with Z-score return exit Z-score
- When Z-score crosses lower entry Z-score, go LONG; close the position with Z-score return exit Z-score
- Back-test each pair, and calculate the performance statistics, each as max drowns down Sharpe ratio
- Build up portfolios with equal market value distribution, each pair has the same market value
Kalman filter for dynamic hedge ratio calculation
According to Wikipedia, Kalman filtering, also known as linear quadratic estimation (LQE), is an algorithm that uses a series of measurements observed over time, containing statistical noise and other inaccuracies.
It produces estimates of unknown variables that tend to be more accurate than those based on a single measurement alone, by estimating a joint probability distribution over the variables for each time-frame.
The filter is named after Rudolf E. Kálmán, one of the primary developers of its theory.
Because the Kalman filter updates its estimates at every time step and tends to weigh recent observations more than older ones, a particularly useful application is an estimation of rolling parameters of the data.
When using a Kalman filter, there's no window length that we need to specify. This is useful for computing the moving average if that's what we are interested in, or for smoothing out estimates of other quantities. We already have the source code for calculating the moving average and Regression with Kalman Filter.
Hurst Exponent and Half-life
The Hurst exponent is used as a measure of long-term memory of time series. It relates to the auto-correlations of the time series and the rate at which these decrease as the lag between pairs of values increases.
Studies involving the Hurst exponent were originally developed in hydrology for the practical matter of determining optimum dam sizing for the Nile river's volatile rain and drought conditions that had been observed over a long period of time.
The name "Hurst exponent", or "Hurst coefficient", derives from Harold Edwin Hurst (1880–1978), who was the lead researcher in these studies; the use of the standard notation H for the coefficient relates to his name also.
To simplify things, the important info to remember here is that a time series can be characterized in the following manner with regard to the Hurst exponent (H):
- H < 0.5 - The time series is mean reverting
- H = 0.5 - The time series is a Geometric Brownian Motion
- H > 0.5 – The time series is trending
However just because a time series displays mean-reverting properties, it doesn’t necessarily mean that we can trade it profitably – there’s a difference between a series that deviates and mean reverts every week and one that takes 10 years to mean revert.
I’m not sure too many traders would be willing to sit and wait around for 10 years to close out a trade profitably. To get an idea of how long each mean reversion is going to take, we can look into the “half-life” of the time series.
Backtesting
The back-test engine follows the steps:
- Calculate Spread = Y – hedge ratio * X
- Using Kalman Filter Regression Function to calculate hedge ratio
- Calculate z-score of ‘s’, using rolling mean and standard deviation for the time period of ‘half-life’ intervals. Save this as z-score
- Using half-life function to calculate half life
- Define upper entry Z-score = 2.0, lower entry Z-score = 2.0, exit Z-score = 0.0
- When Z-score crosses upper entry Z-score, go SHORT; close the position with Z-score return exit Z-score
- When Z-score crosses lower entry Z-score, go LONG; close the position with Z-score return exit Z-score
In-sample Backtesting Results
The in-sample backtesting period is from 2015/2/27 to 2017/6/15.
- Accumulated returns for each trading pair

- Drawndown plot of each pair

In-sample backtesting of portfolio
Portfolio: This is a equally weighted portfolio.
- Performance statistics

As we can see from the above table, the total return on the portfolio is 16%, the daily Sharpe ratio is 4.39. The maximum drowndown is 1.1%, the average drawndown days is 6.1.
- Accumulated returns for the portfolio

- Drawndown plot of the portfolio

Out Sample Backtesting Results
The out sample backtesting period is from 2017/6/16 to 2017/12/31.
- Accumulated returns for each trading pair

- Accumulated returns for the portfolio

- Performance statistics of the portfolio

As we can see from the above table, the total return on the portfolio is 2.8%, the daily Sharpe ratio is 2.38. The maximum drown down is 1.2%, the average drawn downdays is 14.5.
- Drawndown the plot of the portfolio

Challenges and Limitations
- Further research can test the in sample performance with different entry and exit z-score pairs, through numbers of simulation with different entry and exit z-score pairs to find the optimize z-score pairs
- This research report is based on daily trading data; the same back-testing engine can be used to analyze the minute data, hour data and half data
- The back-testing algorithm does not take slippage and trading fees into consideration
- Further research can explore other filters instead of just Kalman filter
- Another window to optimize is the length of the training period and how frequently the Kalman filter has to be recalibrated
- The back-testing is based on main contracts data, in real trading, the main contracts should be projected to the special contracts in each month
To understand more about statistical arbitrage and ways to implement its strategies, here is an introductory video that explains it all!
Conclusion
Contrary to a more developed market, arbitrage opportunities are not readily realized which suggests there might be opportunities for those looking and able to take advantage of them. My project focuses on China’s futures market using Statistical Arbitrage and Pair trading techniques.
The project run Augmented Dickey-Fuller test on the spread to confirm statistically whether the series is mean reverting or not, calculate Kalman Filter regression on the spread series and a lagged version of the spread series in order to then use the coefficient to calculate the half-life of mean reversion.
The results show that though has a relative lower daily Sharpe ratio (2.87 vs. 3.67), the out-sample portfolio has a higher expected daily return and that the out-sample portfolio has a relative higher CAGR (0.0858 vs. 0.07882) but also has a relatively longer average drawdown days.
The back-testing algorithm can be used to analyze the minute data, hour data. The main limitation is that the backtest has not taken slippage and trading fees into consideration.
If you want to learn various aspects of Algorithmic trading then check out the Executive Programme in Algorithmic Trading (EPAT). The course covers training modules like Statistics & Econometrics, Financial Computing & Technology, and Algorithmic & Quantitative Trading. EPAT equips you with the required skill sets to build a promising career in algorithmic trading. Enroll now!
Files in the download
- Kalman Filter Techniques And Statistical Arbitrage In China’s Futures Market In Python - Complete Python Code
- Data CSV files
Disclaimer: The information in this project is true and complete to the best of our Student’s knowledge. All recommendations are made without guarantee on the part of the student or QuantInsti®. The student and QuantInsti® disclaim any liability in connection with the use of this information. All content provided in this project is for informational purposes only and we do not guarantee that by using the guidance you will derive a certain profit.
