By Milind Paradkar
In the last post we covered Machine learning (ML) concept in brief. In this post we explain some more ML terms, and then frame rules for a forex strategy using the SVM algorithm in R.
To use machine learning for trading, we start with historical data (stock price/forex data) and add indicators to build a model in R/Python/Java. We then select the right Machine learning algorithm to make the predictions.
Before understanding how to use Machine Learning in Forex markets, let’s look at some of the terms related to ML.
Machine Learning algorithms – There are many ML algorithms (list of algorithms) designed to learn and make predictions on the data. ML algorithms can be either used to predict a category (tackle classification problem) or to predict the direction and magnitude (machine learning regression problem).
Examples:
- Predict the price of a stock in 3 months from now, on the basis of company’s past quarterly results.
- Predict whether Fed will hike its benchmark interest rate.
Indicators/Features – Indicators can include Technical indicators (EMA, BBANDS, MACD, etc.), Fundamental indicators, or/and Macroeconomic indicators.
Example 1 - RSI(14), Price – SMA(50) , and CCI(30). We can use these three indicators, to build our model, and then use an appropriate ML algorithm to predict future values.
Example 2 - RSI(14), RSI(5), RSI(10), Price – SMA(50), Price – SMA(10), CCI(30), CCI(15), CCI(5)
In this example we have selected 8 indicators. Some of these indicators may be irrelevant for our model. In order to select the right subset of indicators we make use of feature selection techniques.
Feature selection – It is the process of selecting a subset of relevant features for use in the model. Feature selection techniques are put into 3 broad categories: Filter methods, Wrapper based methods and embedded methods. To select the right subset we basically make use of a ML algorithm in some combination. The selected features are known as predictors in machine learning.

Support Vector Machine (SVM) – SVM is a well-known algorithm for supervised Machine Learning, and is used to solve both for classification and regression problem.
A SVM algorithm works on the given labeled data points, and separates them via a boundary or a Hyperplane. SVM tries to maximize the margin around the separating hyperplane. Support vectors are the data points that lie closest to the decision surface.

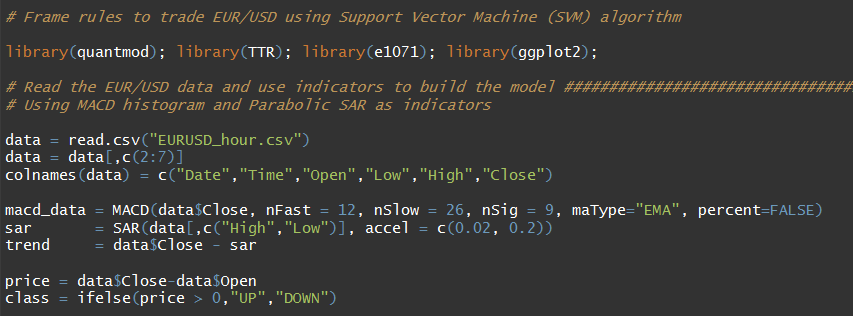
Framing rules for a forex strategy using SVM in R - Given our understanding of features and SVM, let us start with the code in R. We have selected the EUR/USD currency pair with a 1 hour time frame dating back to 2010. Indicators used here are MACD (12, 26, 9), and Parabolic SAR with default settings of (0.02, 0.2).
First, we load the necessary libraries in R, and then read the EUR/USD data. We then compute MACD and Parabolic SAR using their respective functions available in the “TTR” package. To compute the trend, we subtract the closing EUR/USD price from the SAR value for each data point. We lag the indicator values to avoid look-ahead bias. We also create an Up/down class based on the price change.

Thereafter we merge the indicators and the class into one data frame called model data. The model data is then divided into training, and test data.

We then use the SVM function from the “e1071” package and train the data. We make predictions using the predict function and also plot the pattern. We are getting an accuracy of 53% here.

From the plot we see two distinct areas, an upper larger area in red where the algorithm made short predictions, and the lower smaller area in blue where it went long.

SAR indicator trails price as the trend extends over time. SAR is below prices when prices are rising and above prices when prices are falling. SAR stops and reverses when the price trend reverses and breaks above or below it. We are interested in the crossover of Price and SAR, and hence are taking trend measure as the difference between price and SAR in the code. Similarly, we are using the MACD Histogram values, which is the difference between the MACD Line and Signal Line values.
Looking at the plot we frame our two rules and test these over the test data. Short rule = (Price–SAR) > -0.0025 & (Price – SAR) < 0.0100 & MACD > -0.0010 & MACD < 0.0010 Long rule = (Price–SAR) > -0.0150 & (Price – SAR) < -0.0050 & MACD > -0.0005

We are getting 54% accuracy for our short trades and an accuracy of 50% for our long trades. The SVM algorithm seems to be doing a good job here. We stop at this point, and in our next post on Machine learning we will see how framed rules like the ones devised above can be coded and backtested to check the viability of a trading strategy.
Next Step
Machine learning is covered in the Executive Programme in Algorithmic Trading (EPAT) course conducted by QuantInsti. To know more about EPAT check the EPAT course page or feel free to contact our team at contact@quantinsti.com for queries on EPAT.
In the next post of this series we will take a step further, and demonstrate how to backtest our findings. So sit back and enjoy the part two of 'Machine Learning and Its Application in Forex Markets'.
Disclaimer: All investments and trading in the stock market involve risk. Any decisions to place trades in the financial markets, including trading in stock or options or other financial instruments is a personal decision that should only be made after thorough research, including a personal risk and financial assessment and the engagement of professional assistance to the extent you believe necessary. The trading strategies or related information mentioned in this article is for informational purposes only.
Downloadables

