By Manusha Rao
Pre-requisites for learning from this blog:
- https://blog.quantinsti.com/python-programming/
- https://blog.quantinsti.com/set-up-python-system/
- https://blog.quantinsti.com/python-data-structures/
- https://blog.quantinsti.com/python-data-types-variables-tutorial/
Level of your blog: Intermediate
Here is a table with the Python libraries for a quick look.

Python is widely used to develop trading algorithms due to its extensive ecosystem of libraries tailored to finance and trading.
In this article, we cover a few widely used Python libraries for quantitative trading, categorized by their functionality. Here are the Python libraries that we will discuss in this blog:
- Fetching data
- Data manipulation
- Technical analysis
- Plotting and visualization
- Backtesting
- Machine learning
Fetching data
- yfinance
yfinance (Yahoo Finance) is a Python library used to fetch financial data, historical price data, fundamental data, real-time market information, etc. directly from Yahoo Finance. It provides traders, investors, and researchers an easy way to access and analyze financial market data.
Installation

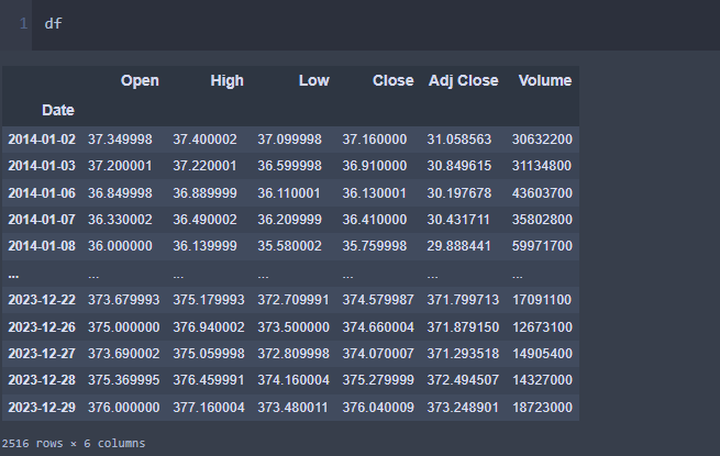
Data download for a single stock
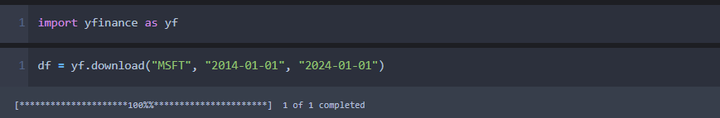
Output
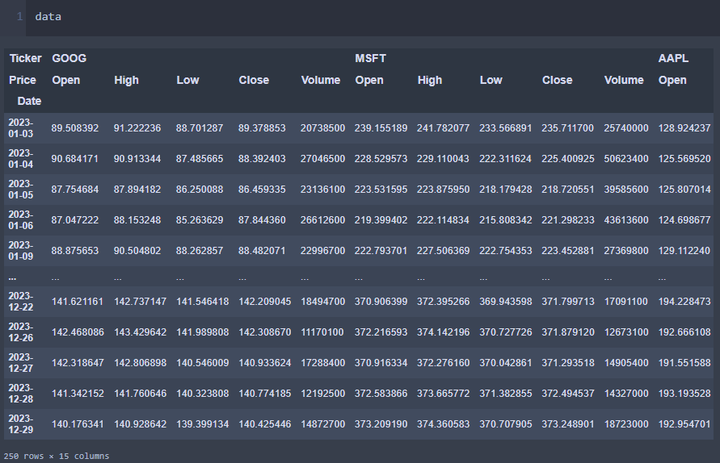
Data download for multiple stocks
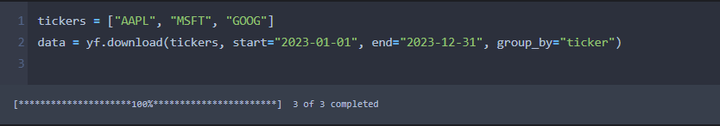
Output
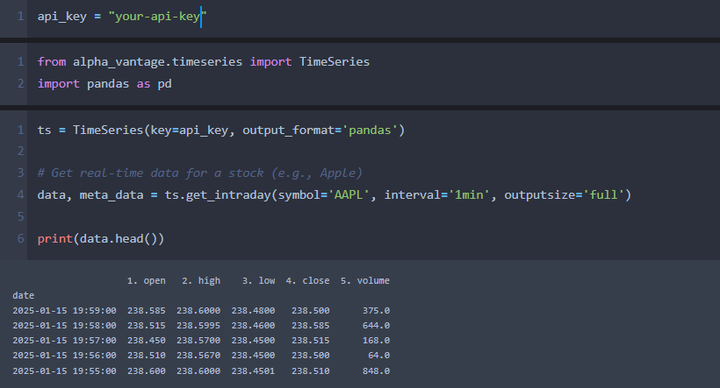
2. Alpha Vantage
Alpha Vantage is another Python library that helps obtain historical price and fundamental data through the Alpha Vantage API. You need an API key to use it. Sign up on their official website to get a free API key. An additional bonus is that it offers technical indicator data such as SMA, EMA, MACD, and Bollinger Bands.
Installation

Data download and output
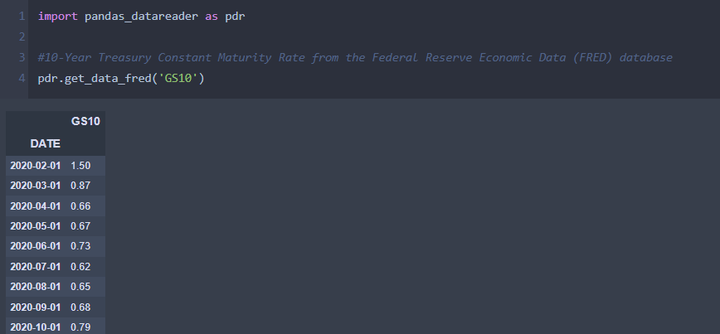
3. Pandas-DataReader
Pandas-DataReader allows you to extract Federal Reserve Economic Data, Fama French Data, World Bank Development Indicators, etc. You can access the list of the data sources here.
Installation

Data download
IBridgePy
IBridgePy is an easy-to-use Python library that can be used to trade with Interactive Brokers. It is a wrapper, specifically a Python wrapper, that provides a user-friendly interface to interact with the Interactive Brokers API, providing a simple solution while hiding IB’s complexities. IBridgePy helps Python to call IB’s C++ API directly as it acts as a wrapper. Here is an example of how to download the data.
Data manipulation
The following libraries are primarily used for math and data operations.
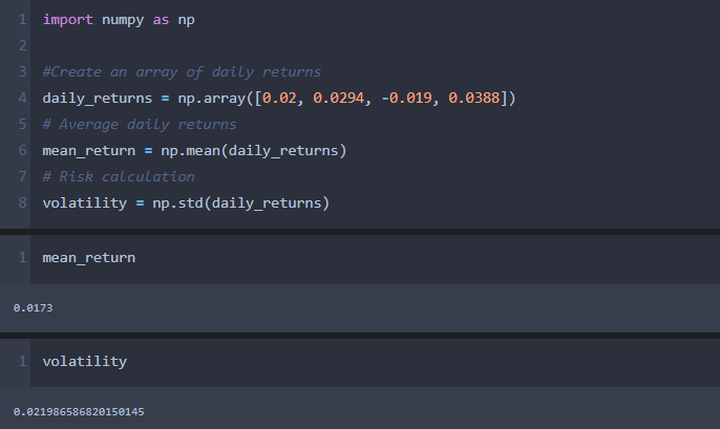
1. NumPy
NumPy (Numerical Python) is an open-source Python library that provides efficient operations for numerical computing. It handles large datasets, performs mathematical operations, and works with multi-dimensional arrays and matrices. Key features of this library include:
- N-dimensional arrays
- Mathematical functions
- Vectorized operations
- Broadcasting
- Random number generation
- Linear algebra
Installation

Statistical analysis
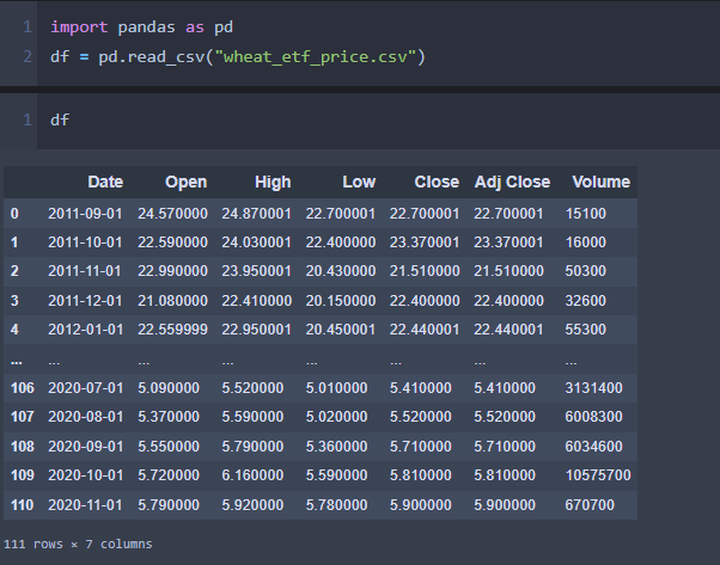
2. Pandas
The Pandas library is widely used for data manipulation and analysis, especially with structured data. It provides easy-to-use data structures like DataFrame and Series for handling various data formats. Below are the key features of the Pandas library:
- Data structures
- Handling missing data
- Data handling and manipulation
- Vectorised operations, etc.
Installation

Read price data from a csv file
Technical analysis
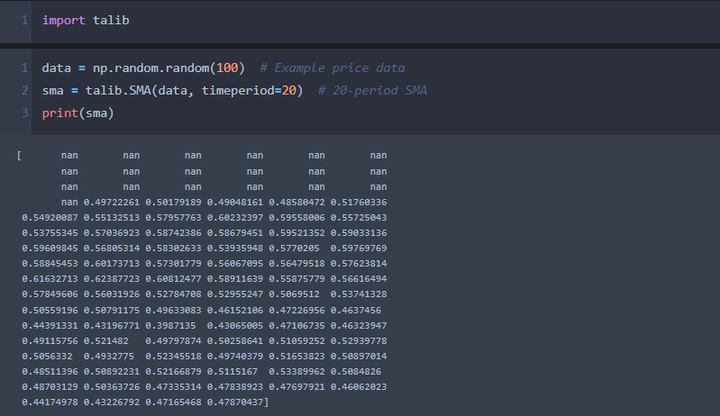
1. TA-Lib
TA-Lib is an open-source library used to perform technical analysis on financial data using technical indicators such as RSI (Relative Strength Index), Bollinger bands, MACD, etc. These indicators help the algorithmic trader to create a strategy based on the findings.
Installation

Rolling simple moving average calculation
Plotting and visualization
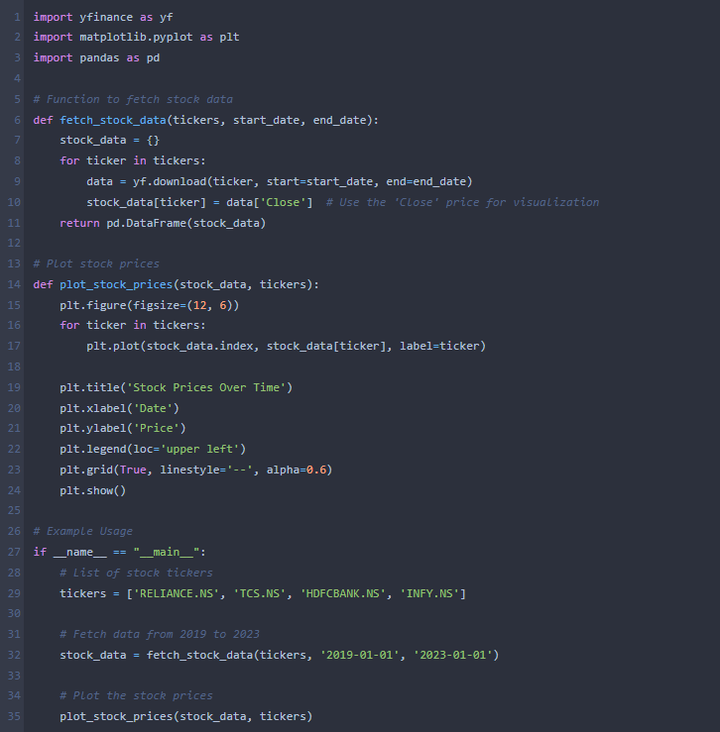
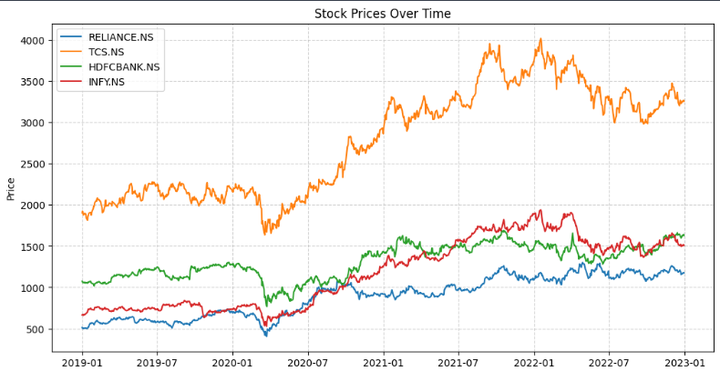
- Matplotlib
Matplotlib is a Python library that plots 2D structures like graphs, charts, histograms, scatter plots, etc. A few of the functions of matplotlib include-
- Scatter (for scatter plots)
- Pie (for pie charts)
- Stackplot (for stacked area plot)
- Colorbar (to add a color bar to the plot) etc.
Installation

Plotting close prices of stocks
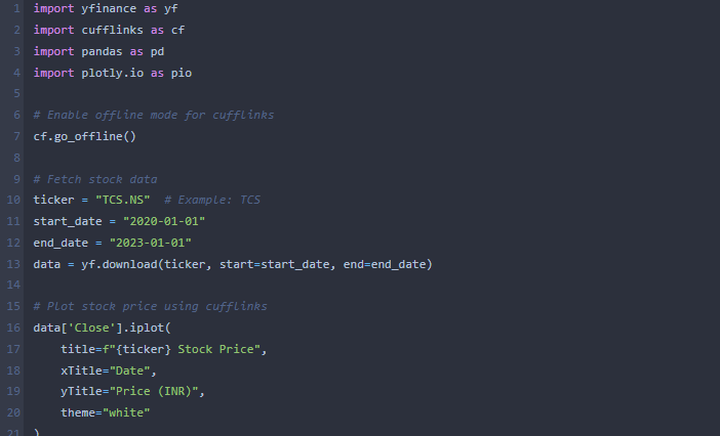
2. Plotly
Plotly is a Python library that interactively helps in data visualization. Plotly was created to add to the features of matplotlib. It helps to make the data more meaningful by having interactive charts and plots.
The Plotly Python library consists of the following packages:
plotly: Main package that contains all the functionality.
graph_objs: Contains objects or templates of figures used for visualizing.
matplotlib: Supports matplotlib figures as well.
Installation

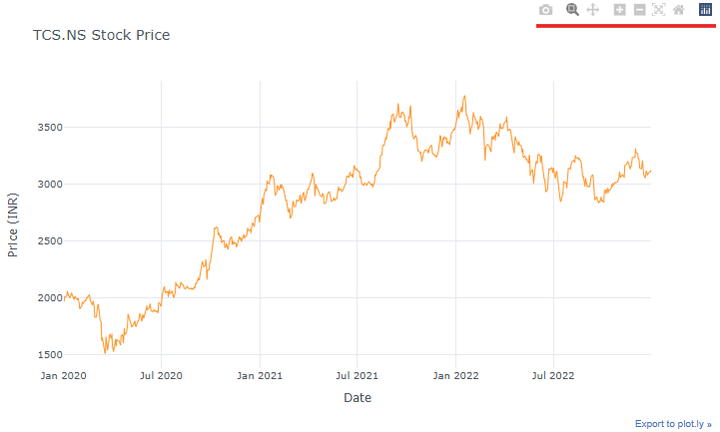
Plotting stock price
Cufflinks provides a bridge between Pandas DataFrames and Plotly, enabling seamless plotting.
Make sure cufflinks library is installed using “!pip install cufflinks”
As you can see from the figure below, there are various tools (marked in red) namely; zoom, hover, pan, autoscale reset axes, etc to make y our plots more interactive and user-friendly.
Backtesting
We backtest Python trading algorithms using historical market data to assess their performance and validate their effectiveness before deploying them in live trading environments. Backtesting helps traders optimize parameters, mitigate risks, and refine their trading strategies over time. The following Python libraries can be used in trading for backtesting.
1. Backtrader
Backtrader is an open-source Python library that you can use for backtesting, strategy visualization, and live-trading. Although it is quite possible to learn how to backtest a trading strategy in Python without using any special library, Backtrader provides many features that facilitate this process. Every complex component of ordinary backtesting can be created with a single line of code by calling special functions.
For those exploring algo trading, tools like Backtrader simplify backtesting and strategy development, making it easier to experiment and refine trading strategies effectively.
2. Vectorbt
vectorbt is a Python library designed for backtesting, optimizing, and analyzing trading strategies. It leverages the power of NumPy and Pandas for highly efficient computation, making it suitable for large-scale financial data and complex strategies. It is particularly useful for quantitative trading, offering a lightweight yet robust framework.
Machine learning
1. Scikit-learn
Scikit-learn is a machine learning library built upon the SciPy library that consists of various algorithms, including classification, clustering, and regression, that can be used along with other Python libraries like NumPy and SciPy for scientific and numerical computations. Some of its classes and functions are:
- sklearn.cluster
- sklearn.datasets
- sklearn.ensemble
- sklearn.mixture
2. TensorFlow
TensorFlow is an open-source software library for high-performance numerical computations and machine learning applications, such as neural networks. Due to its flexible architecture, TensorFlow allows easy computation deployment across various platforms, such as CPUs, GPUs, TPUs, etc.
Here's a guide to installing TensorFlow GPU in Python.
3. Keras
Keras is a deep learning library to develop neural networks and other deep learning models. Furthermore, Keras can be installed on your system and built on top of TensorFlow, or Microsoft Cognitive Toolkit, which focuses on being modular and extensible. It consists of the elements used to build neural networks such as layers, objectives, optimizers, etc. This library can be used in trading for stock price prediction using Artificial Neural Networks.
To recap all the key points we've discussed, please refer to the table below for a comprehensive overview.
|
Category |
Library |
Purpose |
Installation |
Example Usage |
|
Fetching Data |
yfinance |
Fetch historical prices and fundamentals from Yahoo Finance |
pip install yfinance |
yf.download("AAPL", start="2022-01-01", end="2022-12-31") |
|
Alpha Vantage |
Fetch historical prices, fundamentals, and technical indicators |
pip install alpha_vantage |
ts.get_daily(symbol='AAPL', outputsize='full') |
|
|
Pandas-DataReader |
Fetch historical and alternative financial data (FRED, World Bank, etc.) |
pip install pandas-datareader |
web.DataReader("AAPL", "yahoo", start, end) |
|
|
IBridgePy |
Connect to Interactive Brokers for data fetching and live trading |
Manual setup from IBridgePy |
||
|
Data Manipulation |
NumPy |
Perform mathematical operations on multi-dimensional arrays |
pip install numpy |
np.mean(np.array([1, 2, 3])) |
|
Pandas |
Manipulate tabular and time-series data |
pip install pandas |
pd.DataFrame({'A': [1, 2, 3]}) |
|
|
Technical Analysis |
TA-Lib |
Use technical indicators (RSI, Bollinger Bands, MACD, etc.) |
pip install TA-Lib |
talib.RSI(np.random.random(100)) |
|
Plotting & Visualization |
Matplotlib |
Plot graphs, charts, and histograms |
pip install matplotlib |
plt.plot([1, 2, 3], [4, 5, 6]) |
|
Plotly |
Create interactive visualizations |
pip install plotly |
px.line(data_frame, x='x_col', y='y_col') |
|
|
Backtesting |
Backtrader |
Backtest and visualize trading strategies |
pip install backtrader |
cerebro.addstrategy(MyStrategy) |
|
Vectorbt |
High-performance backtesting and optimization using NumPy and Pandas |
pip install vectorbt |
portfolio = vbt.Portfolio.from_signals(close, entries, exits) |
|
|
Machine Learning |
Scikit-learn |
Apply ML algorithms like classification, clustering, and regression |
pip install scikit-learn |
model = sklearn.linear_model.LinearRegression() |
|
TensorFlow |
Build and deploy machine learning models (e.g., neural networks) |
pip install tensorflow |
tf.keras.Sequential([...]) |
|
|
Keras |
Build deep learning models (simplified interface for TensorFlow) |
pip install keras |
keras.Sequential([...]) |
The landscape of Python trading libraries offers powerful tools for investors and algorithmic traders. From data analysis with Pandas to machine learning capabilities in scikit-learn, and specialized financial libraries like IbridgePy and Backtraderr, developers have robust frameworks to build sophisticated trading strategies. The key is selecting libraries that align with your specific trading goals, whether quantitative analysis, backtesting, live trading, or complex algorithmic approaches.
Next steps:
- https://blog.quantinsti.com/python-pandas-tutorial/
- https://blog.quantinsti.com/python-numpy-tutorial-installation-arrays-random-sampling/
- https://blog.quantinsti.com/trading-using-machine-learning-python/
- https://blog.quantinsti.com/python-matplotlib-tutorial/
- https://blog.quantinsti.com/install-ta-lib-python/
- https://blog.quantinsti.com/backtrader/
Note: The original post has been revamped on 29th Jan 2025 for recentness, and accuracy.
All investments and trading in the stock market involve risk. Any decision to place trades in the financial markets, including trading in stock or options or other financial instruments is a personal decision that should only be made after thorough research, including a personal risk and financial assessment and the engagement of professional assistance to the extent you believe necessary. The trading strategies or related information mentioned in this article is for informational purposes only.