By Ishan Shah
In the dynamic world of finance, the quest for investment strategies that yield consistent and profitable outcomes is ever-present. One such strategy, "Quantitative Value Investing," stands out as a data-driven approach to identifying undervalued assets and making informed investment decisions.
Whether you are a novice investor or a seasoned pro looking to explore quantitative value investing, this guide will equip you with the knowledge and tools needed to embark on a data-driven journey toward financial success.
All the concepts covered in this blog are taken from this Quantra course on Factor Investing: Concepts and Strategies. You can take a Free Preview of the course.
This blog covers:
- Understanding value investing
- Quantitative value investing
- Difference of quantitative value investing from value investing
- Importance of quantitative value investing
- Types of data used in quantitative value investing
- How to build a quantitative value investing strategy in Python?
- Risk management and diversification with quantitative value investing
- Real life examples and case studies
- Limitations of quantitative value investing
- Tips to overcome the limitations
- Future trends in quantitative value investing
Understanding value investing
Value investing is a fundamental investment approach that focuses on identifying undervalued assets and purchasing them at a price below their intrinsic value (true worth). This strategy was popularised by renowned investors like Benjamin Graham and Warren Buffett and has been a cornerstone of successful long-term investing.
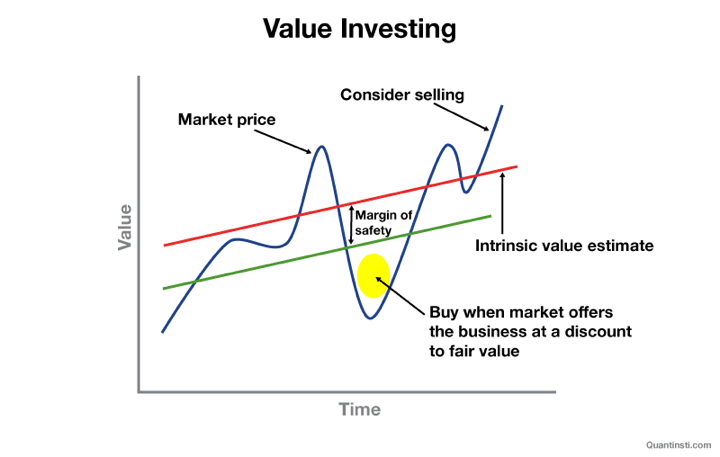
- Intrinsic value - The price level that reflects the actual worth or value of the company
- Margin of safety - The difference between purchase value and the true value
Quantitative value investing
Quantitative value investing is a data-driven approach to identifying undervalued assets for investment. It involves the use of quantitative analysis and financial metrics to make investment decisions. This method relies on mathematical models, statistical analysis, and historical data to determine the intrinsic value of assets and assess their potential for future returns.
Quantitative value investors seek to systematically screen and select investments based on predefined criteria and ratios, aiming to reduce subjectivity and emotion in decision-making.
Ratios used in quantitative value investing
Quantitative value investing relies on various financial ratios to assess the value of potential investments. The ratios are the indicators of whether a stock is undervalued or overvalued.
Here, it is important to note that overvaluation of stocks implies that the stocks are considered expensive, and buying them at such high prices may lead to capital losses. Investors often aim to avoid overvalued assets to protect their investment capital.
Whereas, undervalued stocks refer to shares of a company that are currently trading at a price lower than their intrinsic or fair value. In simpler terms, these stocks are considered cheaper than they should be based on the company's financial health, performance, and future prospects.
Here are some of the key ratios commonly used in quantitative value investing used for finding out the real value of stocks:
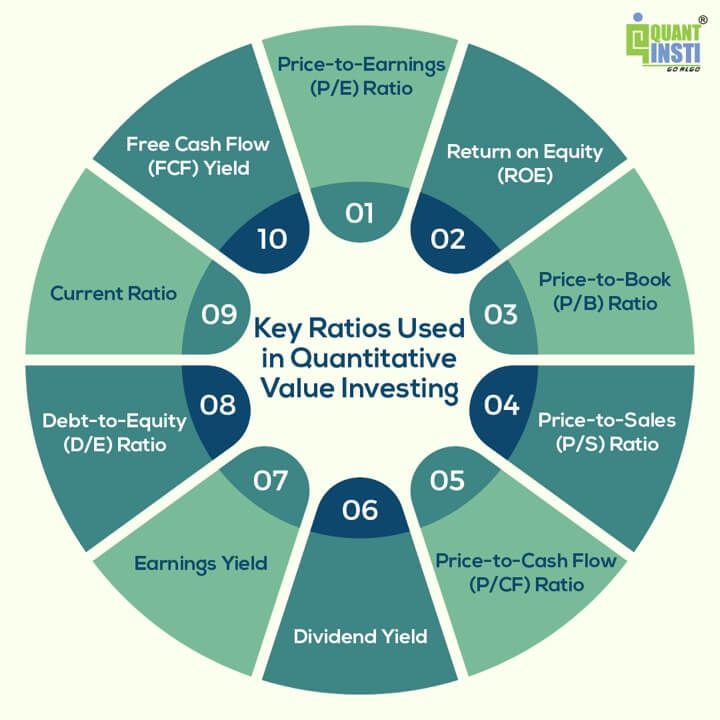
- Price-to-Earnings (P/E) Ratio: The P/E ratio compares a company's stock price to its earnings per share (EPS). A lower P/E ratio is often seen as an indicator of undervaluation and higher P/E ratio implies overvaluation.
- Return on Equity (ROE): ROE measures a company's profitability relative to its shareholders' equity. A higher ROE is generally desirable.
- Price-to-Book (P/B) Ratio: The P/B ratio compares a company's stock price to its book value per share (assets minus liabilities). A P/B ratio below 1 can suggest that a stock is undervalued and over 1 means an overvalued stock. It measures how the market values the company's assets relative to its accounting value.
Accounting value represents the monetary worth of a business, calculated through assets, liabilities, and equity in financial statements.
- Price-to-Sales (P/S) Ratio: The P/S ratio compares a company's stock price to its revenue per share. A lower P/S ratio can indicate undervaluation and a higher one means overvaluation.
- Price-to-Cash Flow (P/CF) Ratio: The P/CF ratio compares a company's stock price to its cash flow per share. It helps assess a company's ability to generate cash. A lower P/CF ratio may indicate that the stock is undervalued compared to its cash flow. A higher P/CF ratio could suggest overvaluation. It reflects how much cash the company generates relative to its stock price.
- Dividend Yield: Dividend yield measures the annual dividends paid by a company as a percentage of its stock price. A higher dividend yield may be attractive to income-focused investors. However, a very high yield could indicate financial distress.
This is so because the company may be using high dividends to attract investors because its stock price is falling. So, sometime in the near future the company may not be able to keep up with its promise of a high dividend yield. However, lower yield implies lower income from dividends relative to the stock price.
- Earnings Yield: The earnings yield is the inverse of the P/E ratio (Earnings Yield = 1/P/E). It's a measure of how much a company earns in relation to its stock price. A higher earnings yield suggests better value. An earnings yield that's significantly higher than the interest rates or the yield on alternative investments may indicate that the stock is undervalued. A lower earnings yield may suggest overvaluation.
- Debt-to-Equity (D/E) Ratio: The D/E ratio compares a company's total debt to its equity. A lower D/E ratio indicates lower financial risk.
- Current Ratio: The current ratio measures a company's ability to cover its short-term liabilities with its short-term assets. A higher current ratio is often preferred.
- Free Cash Flow (FCF) Yield: The FCF yield compares a company's free cash flow to its market capitalisation. A higher FCF yield can indicate value and financial health.
These ratios are used to screen and evaluate stocks based on predefined quantitative criteria. Quantitative value investors often set specific thresholds for these ratios to identify undervalued stocks, and they may use combinations of these ratios to create comprehensive quantitative models for investment decision-making.
Difference of quantitative value investing from value investing
Let us now find out the difference between quantitative value investing and value investing.
|
Aspect |
Value Investing |
Quantitative Value Investing |
|
Methodology |
Qualitative analysis: Assessing company management, competitive advantage, and industry position. |
Quantitative analysis: Using financial ratios mainly like P/E and P/B to determine intrinsic value. |
|
Data Usage |
Uses financial data but relies on non-financial factors. For example, considering a company's brand reputation. |
Primarily relies on financial data and ratios, such as assessing a stock's attractiveness based on a low P/E ratio. |
|
Emotion and Bias |
Subject to emotional and cognitive biases due to qualitative assessments. For example, buying a stock based on personal preference. |
Aims to reduce emotional biases. For example, disregarding personal preferences in favour of predefined data-based strategies. |
|
Automation |
Typically requires manual decision-making. For example, an investor uses personal judgement to decide when to buy or sell a stock. |
Can be automated with algorithms. For example, setting up a program to automatically buy stocks that meet specific quantitative criteria. |
|
Time Horizon |
Often takes a long-term approach, with investors willing to hold assets for years or decades. |
Time horizon can vary; for example, a quantitative strategy may involve shorter holding periods based on specific criteria. ThE shorter holding period allows them to exploit short-term market opportunities and manage risks more effectively compared to traditional value investors who work without quantitative techniques. |
|
Objectivity |
Involves a degree of subjectivity due to qualitative assessments. For example, assessing company management quality subjectively. |
Strives for objectivity by relying on measurable quantitative criteria. For example, if the P/E ratio is below a specific threshold, the stock is considered objectively undervalued. |
Importance of quantitative value investing
The importance of quantitative value investing lies in its ability to provide a systematic, data-driven, and disciplined approach to making investment decisions. Here are some key reasons why quantitative value investing is considered important:
- Objectivity: Quantitative value investing relies on quantitative metrics and predefined criteria, reducing the influence of emotions and cognitive biases in decision-making. This helps investors make more objective choices.
- Consistency: Quantitative models and criteria provide a consistent framework for evaluating investments. This consistency helps investors avoid impulsive decisions and stick to their strategy over the long term.
- Risk Management: Quantitative value investing often includes risk management elements. By using data-driven criteria, investors can identify and mitigate risks associated with their investments.
- Diversification: Quantitative strategies can be used to create diversified portfolios by selecting stocks or assets based on predefined criteria. Diversification helps spread risk and reduce the impact of negative events on individual investments.
- Efficiency: Automation is an integral part of many quantitative strategies. Computer algorithms can quickly analyse large datasets and screen for potential investments, making the investment process more efficient and less time-consuming.
- Historical Data Analysis: Quantitative value investing relies on historical data and statistical analysis to identify patterns and trends. This historical perspective can offer valuable insights into how assets have performed in the past.
- Systematic Approach: A systematic approach allows investors to easily compare different investment options, helping them choose those that best fit their investment goals and criteria.
- Measurability: The quantitative nature of this approach makes it highly measurable. Investors can track the performance of their investments against specific criteria, making it easier to assess the effectiveness of their strategy.
- Scalability: Quantitative value investing can be scaled to manage larger portfolios, making it suitable for both individual investors and institutional investors managing significant assets.
How to build a quantitative value investing strategy in Python?
Let us see the steps below to build a quantitative value investing strategy now.
Steps to build a quantitative value investing strategy
Here are the steps you will go through for building a quantitative value investing strategy:
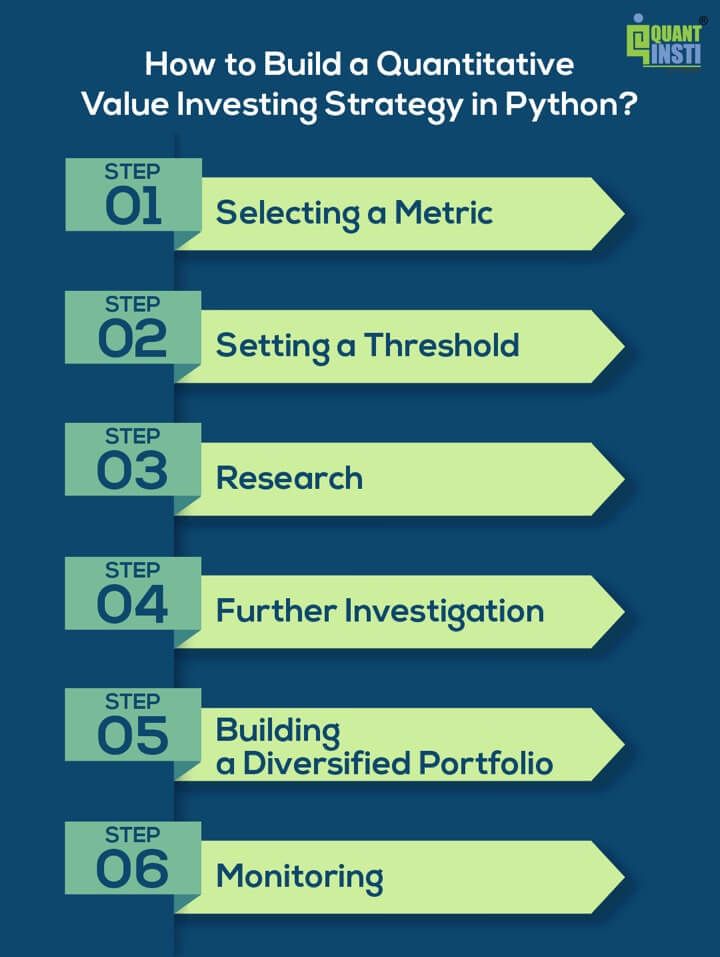
Step 1: Selecting a Metric
You start by choosing a fundamental metric like the Price-to-Earnings (P/E) ratio. This metric compares a company's stock price to its earnings per share (EPS) and can indicate if a stock is relatively cheap or expensive.
Step 2: Setting a Threshold
You decide that a P/E ratio below 15 is your threshold for considering a stock undervalued.
Step 3: Research
You use an online stock screener tool or financial website to find a list of companies with P/E ratios below 15. This step filters out companies that meet your quantitative criteria.
Step 4: Further Investigation
Now, you have a list of potential undervalued stocks based on their P/E ratios. You decide to delve deeper into these companies to ensure they're worth investing in. You look at their financial statements, assess their competitive position, and consider their future prospects. This part includes a mix of quantitative and qualitative analysis.
Step 5: Building a Diversified Portfolio
To manage risk, you select a mix of these undervalued stocks from different industries to create a diversified portfolio. Diversification helps spread risk in case one industry or company faces challenges.
Step 6: Monitoring
You invest in the selected stocks and keep an eye on their performance over time. You periodically review the P/E ratios and other relevant metrics to ensure they remain in line with your investment strategy.
Example of building a quantitative value investing strategy with Python
In this example, we will take a list of stocks and on the basis of the metrics we just discussed, we will find out which ones are undervalued stocks and which are overvalued.
Step 1: Import necessary libraries
Step 2: Define stocks, retrieve data and calculate ratios
Step 3: Print the data for undervalued stocks
Output:
Undervalued Stocks:
Empty DataFrame
Columns: [Ticker, P/E Ratio, P/B Ratio]
Index: []
The output above indicates that, based on the criteria set in the code (P/E Ratio < 15 and P/B Ratio < 1), there are currently no stocks from the specified list (AAPL, MSFT, GOOGL, AMZN, FB) that meet the undervalued criteria.
This result suggests that, according to the criteria in the code, none of the selected stocks are currently undervalued.
Step 4: Find out the overvalued stocks
Output:
Overvalued Stocks:
  Ticker  P/E Ratio  P/B Ratio
0   AAPL   6.010000  46.677052
1   MSFT   9.689999  11.979963
2  GOOGL   4.820000   6.644448
3   AMZN   1.280000   8.063983
This way you can get to know the undervalued as well as overvalued stocks and invest accordingly.
Risk management and diversification with quantitative value investing
Risk management and diversification are essential aspects of quantitative value investing. They help investors protect their capital and achieve more stable returns. Here's how these concepts apply to quantitative value investing:
Risk Management
- Diversify Portfolio: Spread your investments across different sectors or industries to reduce the risk of individual stocks or sectors affecting your overall portfolio.
- Assess Risk: Use tools like standard deviation and beta to understand the risk associated with your investments.
- Protect with Stop Losses: Set predetermined prices at which you'll sell stocks automatically to limit potential losses.
- Size Your Positions: Allocate more capital to lower-risk stocks and less to higher-risk ones.
- Learn from History: Study how stocks behaved in the past to make informed decisions.
Diversification
- Spread Sectors: Invest in various sectors and industries to reduce the impact of issues in one sector.
- Mix Assets: Beyond stocks, diversify into other things like bonds, real estate, or commodities to spread risk.
- Go Global: Invest in different regions or countries to reduce risks related to local events.
- Vary Company Sizes: Include stocks from various market sizes, like large, mid-sized, and small companies.
- Quantitative Criteria: Choose undervalued stocks based on specific financial ratios while ensuring diversity in industries.
- Keep an Eye: Diversification isn't a one-time decision; it needs continuous monitoring and rebalancing as markets change.
Quantitative value investing aims to balance potential returns and manage risk by diversifying and assessing risk. Combining these elements helps create a stable and potentially rewarding investment strategy.
Real life examples and case studies
Real-life examples and case studies can help illustrate the practical application of quantitative value investing. Here are a few well-known examples:
1. Warren Buffett and Berkshire Hathaway
Example: Warren Buffett, one of the most famous value investors, has successfully employed quantitative value investing principles for decades. His company, Berkshire Hathaway, has outperformed the market using a combination of financial ratios and qualitative analysis.
Case Study: Examining Berkshire Hathaway's investments in companies like Coca-Cola, Wells Fargo, and American Express, and understanding how Buffett's quantitative and qualitative assessment led to these investments, is a valuable case study.[1]
2. Ben Graham's Net-Net Stocks
Example: Benjamin Graham, the father of value investing, developed a quantitative approach known as net-net investing. This strategy involved buying stocks trading at a discount to their net current asset value (NCAV). Graham used this approach successfully during his career.
Case Study: Exploring specific stocks that met the net-net criteria and understanding how Graham applied quantitative analysis can provide insights into this strategy.[2]
3. Joel Greenblatt's "Magic Formula"
Example: Joel Greenblatt introduced the "Magic Formula" in his book "The Little Book That Beats the Market." This quantitative strategy involves ranking stocks based on a combination of earnings yield and return on capital employed (ROCE).
Case Study: Analysing the performance of a portfolio of stocks selected using the Magic Formula and understanding how this quantitative approach has fared compared to the broader market is an insightful case study.[3]
Limitations of quantitative value investing
Quantitative value investing offers several advantages but also comes with limitations. It's important to be aware of these limitations to make informed investment decisions.
Here are some common limitations of quantitative value investing:
- Historical Data Reliance: Quantitative value investing heavily relies on historical financial data. This means that it may not account for unexpected or unique events that can significantly impact a company's future performance.
- Market Inefficiencies: Quantitative value strategies assume that the market occasionally misprices stocks. However, as more investors adopt these strategies, the inefficiencies they seek to exploit can diminish.
- Uncertain Future: Past performance does not guarantee future results. Even if a stock has strong quantitative value characteristics, there is no guarantee that it will perform well in the future.
- Overlooked Growth Stocks: Value investing often focuses on undervalued, mature companies. This approach may overlook high-growth stocks that may not fit traditional value metrics but can offer substantial returns.
- Lack of Context: Quantitative models don't consider qualitative factors, such as company management, industry trends, or competitive advantages. These qualitative aspects can significantly influence a company's performance.
- Risk of Value Traps: Stocks that appear undervalued based on quantitative metrics may be "value traps." These are companies with declining prospects that may never fully recover, leading to long-term underperformance.
- Diversification Challenges: Achieving diversification with quantitative value investing can be challenging. Some sectors or industries may not have undervalued options, limiting diversification possibilities.
- Short-Term Volatility: Value stocks may experience short-term price volatility, and investors need to have the patience and discipline to ride out market fluctuations.
- Model Risk: The effectiveness of quantitative models can vary, and model risk is a concern. Models may not account for all relevant factors or may not perform well under certain market conditions.
- Data Quality and Errors: Inaccurate or incomplete data can lead to flawed investment decisions. Quantitative investors must ensure data quality and deal with data errors.
- Crowded Trades: If too many investors adopt the same quantitative value strategy, it can lead to overcrowding in certain stocks, causing their prices to become inflated.
- Lack of Emotional Insight: Quantitative approaches do not consider the emotional or behavioural aspects of the market, which can influence stock prices.
Despite these limitations, quantitative value investing can be a valuable approach for many investors. It's important to recognise these limitations and complement quantitative strategies with qualitative analysis and a broader understanding of the market to make well-informed investment decisions.
Tips to overcome the limitations
To overcome the limitations of quantitative value investing, consider the following tips:
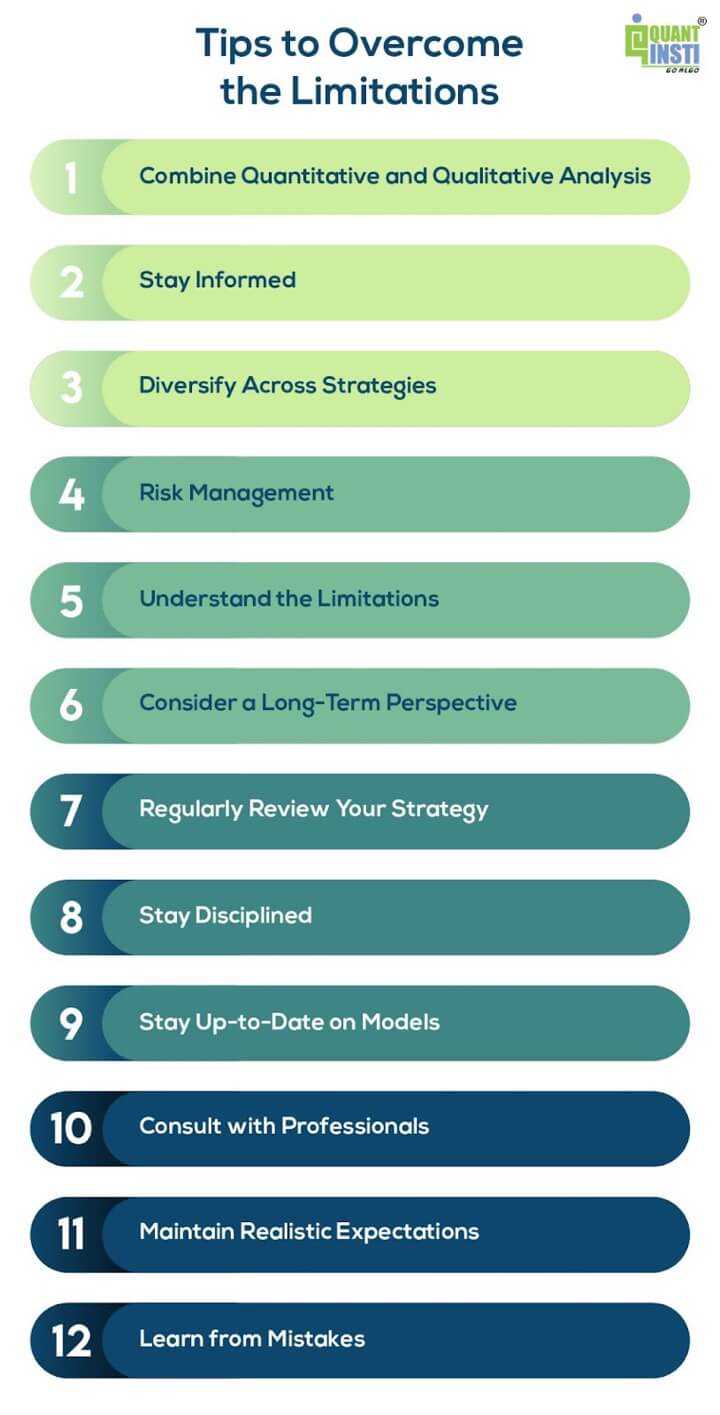
- Combine Quantitative and Qualitative Analysis: Incorporate qualitative analysis into your investment approach. This can include assessing a company's management, industry dynamics, competitive advantages, and growth prospects. Qualitative analysis can help complement quantitative data and provide a more comprehensive view of a potential investment.
- Stay Informed: Continuously update your knowledge of market and industry trends. Be aware of current events and changes that may impact the companies you're investing in. This awareness can help you make more informed decisions.
- Diversify Across Strategies: Consider diversifying your investments across different investment strategies, including those that focus on growth, value, income, and other factors. This diversification can help balance your portfolio and reduce risks associated with a single strategy.
- Risk Management: Implement risk management techniques, such as stop-loss orders or position sizing, to limit potential losses. Be prepared to exit an investment if it no longer aligns with your criteria or if there are signs of deteriorating fundamentals.
- Understand the Limitations: Being aware of the limitations of quantitative value investing is the first step in addressing them. Understand that no investment approach is foolproof, and there will always be uncertainties and risks.
- Consider a Long-Term Perspective: Quantitative value investing is often more effective when viewed with a long-term horizon. Short-term fluctuations may occur, but a focus on the fundamental value of your investments can help you stay the course.
- Regularly Review Your Strategy: Periodically reassess your investment strategy and adjust it as needed. Market conditions change, and so should your approach. Reevaluate your criteria and make sure they align with your financial goals.
- Stay Disciplined: Avoid making impulsive decisions based on short-term market movements or emotions. Stick to your predefined criteria and investment strategy.
- Stay Up-to-Date on Models: If you're using quantitative models, keep them up-to-date and ensure they remain relevant and effective in the current market environment.
- Consult with Professionals: If you're unsure about specific investments or strategies, consider seeking advice from financial professionals, such as financial advisors or portfolio managers.
- Maintain Realistic Expectations: Understand that no investment approach guarantees success, and there will be periods of underperformance. Set realistic expectations and avoid chasing unrealistic returns.
- Learn from Mistakes: Analyse both successful and unsuccessful investments to learn from your mistakes and refine your approach over time.
Conclusion
Quantitative value investing combines data-driven analysis with a disciplined approach to identify undervalued assets and achieve superior returns. While it offers numerous advantages, including objectivity and systematic decision-making, it is not without limitations, requiring a balance with qualitative insights.
As it evolves, embracing technology, alternative data, ESG considerations, and behavioural insights, the future of quantitative value investing holds promise. However, investors should remain adaptable, stay informed, and integrate these emerging trends judiciously.
Ultimately, the success of quantitative value investing hinges on a well-structured approach, a long-term perspective, and the ability to navigate a dynamic and ever-changing financial landscape.
If you wish to learn more about quantitative value investing, you must explore the Factor Investing course. With this course, you will learn all about the fundamental ratios, in depth, which can be used to objectively pick an undervalued or overvalued stock from a given stock universe. This way you can base your trading strategy on the quantitative analysis of the stock.
File in the download:
- Quantitative value investing strategy - Python code
Note: The original post has been revamped on 14th December 2023 for accuracy, and recentness.
Disclaimer: All data and information provided in this article are for informational purposes only. QuantInsti® makes no representations as to accuracy, completeness, currentness, suitability, or validity of any information in this article and will not be liable for any errors, omissions, or delays in this information or any losses, injuries, or damages arising from its display or use. All information is provided on an as-is basis.