
This project models a Statistical Arbitrage pair trading strategy to Brazil’s B3 (former Bovespa) stock market exchange. We run our strategy at two distinct time intervals. From 1-Jan-2009 to 31-Dec-2014 and from 1-Jan-2018 to 30-Apr-2021. As we only had current sector distribution available, the results for the former period clearly suffered from survivorship bias.
Stock sector classification was downloaded directly from Brazil’s B3 stock market exchange.
From all sectors, we considered only the ones with five or more stocks, namely:
oil, metal, steel, paper, transp_material, machines, rail_roads, highways, storage, services, agriculture, meat, food, construction, fabric, clothes_shoes, education, car_rental, retail, hospitals, drugstores, it, telecom, electricity, water, banking, financial_services, insurance, real_estate.
Results were very encouraging, though it did not consider transaction fee or slippage costs. All calculations were done based on daily close prices.
The complete python code of this project is also available in a downloadable format at the end of the article.
This article is the final project submitted by the author as a part of his coursework in the Executive Programme in Algorithmic Trading (EPAT®) at QuantInsti®. Do check our Projects page and have a look at what our students are building.
About the Author

Dr. Luiz Guedes has over 30 years of experience in his career in software development, specifically in the payment card industry. In addition, he is a faculty member at the Instituto Militar de Engenharia – IME, where he teaches Compilers and Programming Languages.
As a software developer and innovator, Dr. Guedes has extensively used the Innovative Problem Solving approach to write software for constrained systems and secure electronic transactions, particularly on the development of programming and execution environments, cryptographic algorithms and security communication protocols.
Lately, he has focused his attention on applying data science methods to quantitative trading. He also has excellent presentation skills in 6 foreign languages.
Dr Guedes holds a doctor’s degree in computer science from the Pontifícia Universidade Católica do Rio de Janeiro – PUC/RIO, a master’s degree in computer systems and a computer engineer degree, both from IME. Additionally, he acquired an MBA in business from the Fundação Getúlio Vargas – FGV.
Introduction
This project aims to model a Statistical Arbitrage pair trading strategy to Brazil’s B3 (former Bovespa) stock market exchange. We run our strategy at two distinct time intervals.
- From 1-Jan-2009 to 31-Dec-2014, and
- From 1-Jan-2018 to 30-Apr-2021.
As we only had current sector distribution available, the results for the former period clearly suffered from survivorship bias.
Stock sector classification was downloaded from [B32021]. From all sectors, we considered only the ones with five or more stocks, namely:
oil, metal, steel, paper, transp_material, machines, rail_roads, highways, storage, services, agriculture, meat, food, construction, fabric, clothes_shoes, education, car_rental, retail, hospitals, drugstores, it, telecom, electricity, water, banking, financial_services, insurance, real_estate
All the stocks listed in these sectors had their historical data captured from Yahoo Finance.
Used Data
Within each sector, we used the Johansen test to select the stock pairs that cointegrated with a significance level greater than 90% to get their hedge relation [Chan, 2013].
From the cointegrating pairs, we kept only those that the spread did not switch sign and had a half-life not greater than 60 days. These filters decreased our available stock market data as shown in Table 1.
|
#sectors x #pairs |
1-Jan-2009 to |
1-Jan-2018 to |
|
All (sectors larger than 5) |
10 x 750 |
15 x 1098 |
|
Cointegrated (signific > 90%) |
10 x 393 |
15 x 442 |
|
Constant sign |
10 x 333 |
14 x 361 |
|
Half-life <= 60 |
4 x 89 |
12 x 140 |
Table 1: #sectors x #pairs availability
Another consideration that we were only able to apply for the more recent data is the availability of stocks to be shorted. Brazil stock market is not as liquid as we would need to be sure that it will always be possible to buy a stock pair (long one stock and short the other).
Therefore, we also run our strategy for the current Top 100 stocks. These stocks are listed by an index named IBrX100 [B32021a]. Table 2 shows the number of sectors and pairs belonging to the current Top 100 after applying the filters described above.
|
#sectors x #pairs |
All |
Top 100 |
|
All (sectors larger than 5) |
15 x 1098 |
5 x 81 |
|
Cointegrated (signific > 90%) |
15 x 442 |
5 x 21 |
|
Constant sign |
14 x 361 |
4 x 18 |
|
Half-life <= 60 |
12 x 140 |
3 x 5 |
Table 2: #sectors x #pairs availability from 1-Jan-2017 to 30-Apr-2021
Trading Strategy
As the generated pair spreads are supposed to be mean reverting, we built a strategy with a Bollinger Band indicator with the length corresponding to each pair half-life and one standard deviation wide.
When the spread crosses up the upper band, we open a short position and, when it crosses down the lower band, we open a long position. When the spread crosses the moving average, we close any position that is open, if any.
We also periodically run the Augmented Dickey-Fuller (ADF) test in order to check that the spreads are still mean-reverting. As the ADF test is a long-term test it is pointless to run it every day.
Therefore, we made a grid search, in order to find the best frequency and the best length to run the test. The grid checked to run the test once, twice or three times a month with lengths 6, 12, 18 and 24 months.
Table 3 summarizes the best hyperparameters found with the grid search.
|
Period |
Times per Month |
Length in Months |
|
1-Jan-2009 to 31-Dec-2014 |
1 |
24 |
|
1-Jan-2018 to 30-Apr-2021 (all) |
1 |
12 |
|
1-Jan-2018 to 30-Apr-2021 (top 100) |
2 |
12 |
Table 3: Best ADF check frequency and length
Results
For each scenario, the last year of data was left as a test set and the strategy was trained with the remaining data. The Top 10 performers on each train set were tested on the respective test set.
Results collected considering leverage factors of 1, 2 and 3, are shown in Tables 4, 5 and 6, respectively. Table 4 presents only five pairs because, as we can see in Table 2, there were only five pairs remaining in that scenario.
2020-05-01 to 2021-05-01 - Top 100:
leverage = 1

Pair                      	CAGR 	Hit Ratio  Avg Profit/Loss  Rets StdDev  Max Draw-down
('ARZZ3.SA', 'HGTX3.SA')  	1.23     	2.60     	2.33     	0.37    	-11.07%
('JHSF3.SA', 'MRVE3.SA')  	0.72     	4.33     	0.80     	0.19    	-19.31%
('CMIG4.SA', 'CPFE3.SA')  	0.58     	3.00     	1.46     	0.20     	-4.43%
('CPFE3.SA', 'ENBR3.SA')  	0.36     	2.00     	1.44     	0.13     	-5.43%
('ENBR3.SA', 'TRPL4.SA')  	0.10     	1.00     	1.35         0.08    	-22.27%

leverage = 2

Pair                      	CAGR 	Hit Ratio  Avg Profit/Loss  Rets StdDev  Max Draw-down
('ARZZ3.SA', 'HGTX3.SA')  	3.52     	2.60     	2.33     	1.05    	-21.49%
('JHSF3.SA', 'MRVE3.SA')  	1.63     	4.33     	0.80     	0.45    	-38.62%
('CMIG4.SA', 'CPFE3.SA')  	1.39     	3.00     	1.46     	0.51     	-8.86%
('CPFE3.SA', 'ENBR3.SA')  	0.80     	2.00     	1.44     	0.29    	-10.86%
('ENBR3.SA', 'TRPL4.SA')  	0.12     	1.00     	1.35     	0.17    	-40.94%

leverage = 3

Pair                      	CAGR 	Hit Ratio  Avg Profit/Loss  Rets StdDev  Max Draw-down
('ARZZ3.SA', 'HGTX3.SA')  	7.44     	2.60     	2.33     	2.22    	-31.26%
('CMIG4.SA', 'CPFE3.SA')  	2.49     	3.00     	1.46     	0.93    	-13.29%
('JHSF3.SA', 'MRVE3.SA')  	2.43     	4.33     	0.80     	0.78    	-57.93%
('CPFE3.SA', 'ENBR3.SA')  	1.31     	2.00     	1.44     	0.46    	-16.35%
('ENBR3.SA', 'TRPL4.SA')  	0.06     	1.00     	1.35     	0.27    	-56.35%
Table 4: 2020-05-01 to 2021-05-01 - Top 100 results
2020-05-01 to 2021-05-01 - Top All:

leverage = 1

Pair                     	 CAGR     Hit Ratio  Avg Profit/Loss  Rets StdDev  Max Draw-down
('AFLT3.SA', 'CPLE3.SA') 	10.13     	6.60     	1.11     	3.00    	-17.51%
('MRVE3.SA', 'RDNI3.SA')  	3.42     	8.50     	0.87     	1.36    	-17.39%
('IGTA3.SA', 'SCAR3.SA')  	2.44     	4.00     	1.18     	0.86    	-17.97%
('BRSR3.SA', 'ITSA4.SA')  	2.38     	2.57     	1.16     	0.89    	-46.01%
('GEPA4.SA', 'TRPL4.SA')  	1.61     	3.33     	1.18     	0.42 	   -15.79%
('CRDE3.SA', 'RDNI3.SA')  	1.39     	5.33     	0.79     	0.40    	-25.13%
('BRIV4.SA', 'PINE4.SA')  	1.09     	4.00     	0.83     	0.21    	-14.84%
('ARZZ3.SA', 'HGTX3.SA')  	1.03     	2.75     	1.99   	  0.31        -11.07%
('ARZZ3.SA', 'CGRA4.SA')  	0.94     	3.00     	2.85     	0.25     	-5.75%
('ARZZ3.SA', 'GUAR3.SA')      0.87     	3.25     	2.18     	0.26     	-3.99%

leverage = 2

Pair                      	CAGR 	Hit Ratio  Avg Profit/Loss  Rets StdDev  Max Draw-down
('AFLT3.SA', 'CPLE3.SA') 	64.45     	5.67     	1.27    	21.62    	-35.03%
('IGTA3.SA', 'SCAR3.SA')  	7.17     	3.00     	1.49     	2.78    	-35.94%
('BRSR3.SA', 'ITSA4.SA')  	6.72     	2.57     	1.17     	2.23    	-75.99%
('BMIN4.SA', 'PINE4.SA')  	6.03     	6.00     	1.82     	2.28    	-22.28%
('GEPA4.SA', 'TRPL4.SA')  	4.95     	3.33     	1.18     	1.35    	-30.35%
('BMIN4.SA', 'BRSR3.SA')  	4.64     	5.00     	1.97     	1.82    	-22.34%
('BRIV4.SA', 'PINE4.SA')  	2.87     	6.00     	0.57         0.54    	-29.68%
('ARZZ3.SA', 'HGTX3.SA')  	2.77     	2.75     	1.99     	0.82    	-21.49%
('ARZZ3.SA', 'CGRA4.SA')  	2.54     	3.00     	2.85     	0.62    	-11.39%
('ARZZ3.SA', 'GUAR3.SA')  	2.29     	3.25	     2.18     	0.66     	-7.99%

leverage = 3

Pair                      	CAGR 	Hit Ratio  Avg Profit/Loss  Rets StdDev  Max Draw-down
('AFLT3.SA', 'CPLE3.SA')	237.23     	5.67     	1.27    	87.74    	-52.54%
('BMIN4.SA', 'PINE4.SA') 	18.06     	4.33     	3.47     	6.77    	-24.71%
('IGTA3.SA', 'SCAR3.SA') 	13.80     	3.00     	1.49     	5.87    	-53.91%
('BMIN4.SA', 'BRSR3.SA') 	12.91     	3.67     	3.70     	4.94 	   -24.63%
('BRSR3.SA', 'ITSA4.SA') 	11.49     	2.57     	1.32     	3.52    	-90.64%
('ARZZ3.SA', 'HGTX3.SA')  	5.50     	2.75     	1.99     	1.58    	-31.26%
('ARZZ3.SA', 'CGRA4.SA')  	5.10     	3.00     	2.85   	  1.16        -16.91%
('ARZZ3.SA', 'GUAR3.SA')  	4.47     	3.25     	2.18     	1.25    	-11.98%
('BRIV4.SA', 'PINE4.SA')  	4.06     	4.60     	0.63     	0.76    	-44.52%
('CPFE3.SA', 'ENBR3.SA')  	1.53     	4.50     	0.84     	0.56    	-19.35%
Table 5: 2020-05-01 to 2021-05-01 - Top All results
2014-01-01 to 2015-01-01

leverage = 1

Pair                      	CAGR 	Hit Ratio  Avg Profit/Loss  Rets StdDev  Max Draw-down
('CBEE3.SA', 'EKTR4.SA')  	5.18    	15.00     	4.50     	1.36     	-2.94%
('BAZA3.SA', 'BNBR3.SA')  	4.62     	6.00     	1.58     	1.62    	-12.25%
('BAZA3.SA', 'BMIN4.SA')  	4.11     	8.50     	1.09     	0.99    	-17.30%
('CTSA4.SA', 'TXRX4.SA')  	2.39     	2.50     	1.54     	0.69    	-45.70%
('BRSR3.SA', 'ITSA4.SA')  	1.13     	5.00     	5.19     	0.37     	-1.61%
('CPFE3.SA', 'CSRN3.SA')  	0.90     	5.50     	8.44     	0.26   	  -1.15%
('BMEB4.SA', 'ITSA4.SA')  	0.46     	1.40     	2.10     	0.17    	-12.08%
('BAZA3.SA', 'BGIP4.SA')  	0.40     	3.14     	0.83     	0.19    	-10.02%
('BMIN4.SA', 'SANB4.SA')  	0.36     	6.00     	0.58     	0.14    	-13.62%
('BMIN4.SA', 'RPAD3.SA')  	0.32     	5.00     	0.69     	0.13    	-12.59%

leverage = 2

Pair                      	CAGR 	Hit Ratio  Avg Profit/Loss  Rets StdDev  Max Draw-down
('CBEE3.SA', 'EKTR4.SA') 	26.89        15.00     	4.50     	6.53     	-5.88%
('BAZA3.SA', 'BNBR3.SA') 	22.42     	6.00     	1.58     	8.77    	-24.50%
('BAZA3.SA', 'BMIN4.SA') 	18.14     	8.50     	1.09     	4.46    	-34.60%
('BRSR3.SA', 'ITSA4.SA')  	3.19     	5.00     	5.19     	0.96     	-3.22%
('CPFE3.SA', 'CSRN3.SA')  	2.41     	5.50     	8.44     	0.69     	-2.30%
('BMEB4.SA', 'ITSA4.SA')  	0.96     	1.40     	2.10     	0.35    	-23.63%
('BAZA3.SA', 'BGIP4.SA')  	0.88     	3.14     	0.83     	0.41    	-20.04%
('BMIN4.SA', 'SANB4.SA')  	0.73     	6.00     	0.58     	0.27    	-27.25%
('BMIN4.SA', 'RPAD3.SA')  	0.65     	5.00     	0.69     	0.26   	 -25.18%
('CEPE3.SA', 'LIPR3.SA')  	0.04      	inf      	inf     	0.00      	0.00%

leverage = 3

Pair                      	CAGR 	Hit Ratio  Avg Profit/Loss  Rets StdDev  Max Draw-down
('CBEE3.SA', 'EKTR4.SA')	101.08    	15.00         4.50    	23.10     	-8.82%
('BAZA3.SA', 'BNBR3.SA') 	76.64     	6.00     	1.58    	34.36    	-36.75%
('BAZA3.SA', 'BMIN4.SA') 	63.20     	8.50     	1.70    	15.45    	-26.56%
('BRSR3.SA', 'ITSA4.SA')  	6.94         3.00     	6.94     	1.50     	-4.83%
('BMEB4.SA', 'ITSA4.SA')  	1.44     	1.40     	2.10     	0.54    	-34.64%
('BAZA3.SA', 'BGIP4.SA')  	1.42     	3.14     	0.83     	0.65    	-30.06%
('BMIN4.SA', 'SANB4.SA')      0.54     	4.00     	0.72     	0.18    	-33.68%
('BMIN4.SA', 'RPAD3.SA')  	0.52     	3.00     	1.03     	0.18    	-27.88%
('BMEB4.SA', 'BRSR3.SA')  	0.48     	2.50     	0.92     	0.17    	-27.01%
('CEPE3.SA', 'LIPR3.SA')  	0.08      	inf      	inf     	0.01      	0.00%
Table 6: 2014-01-01 to 2015-01-01 results
Considering the most recent scenario with the stocks belonging to the Top 100 list, whole portfolio results are summarized in Table 7
|
Leverage |
Returns |
CAGR |
StdDev |
Max DrawDown |
|
1 |
58% |
60% |
2% |
-9% |
|
2 |
142% |
149% |
22% |
-71% |
|
3 |
259% |
272% |
41% |
-87% |
Table 7: 2020-05-01 to 2021-05-01 - Top 100 portfolio results
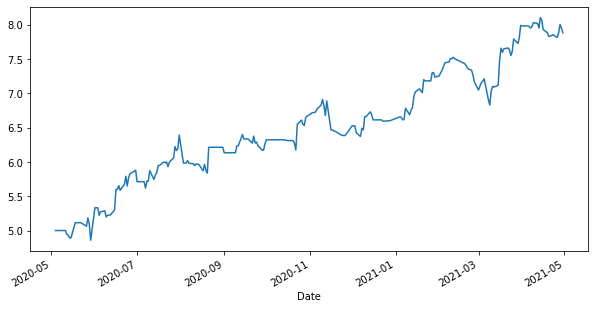
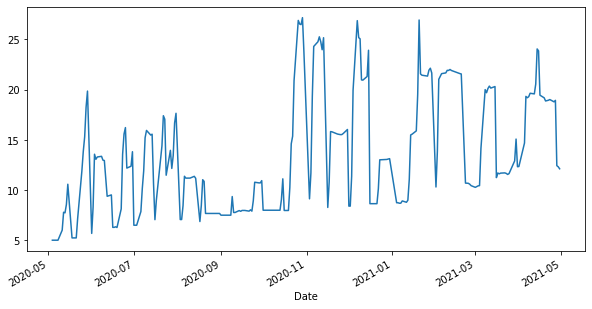
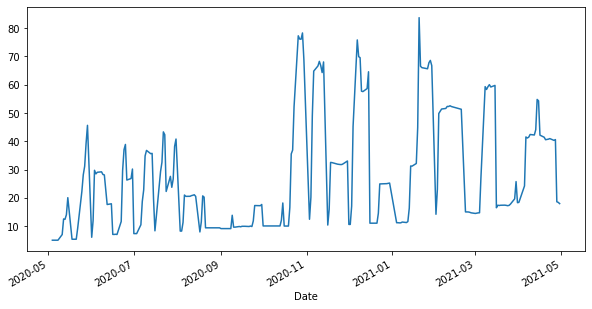
For each leverage level, we can see on Figures 1, 2 and 3, the MTM equity curves for a unit amount for each pair. For all three leverages, portfolio initial amount is 5.0, due to five pairs.
Porfolio rets: 0.58 CAGR: 0.60 StdDev: 0.02 Max DrawDown: -0.09
Porfolio rets: 1.42 CAGR: 1.49 StdDev: 0.22 Max DrawDown: -0.7
Porfolio rets: 2.59 CAGR: 2.72 StdDev: 0.41 Max DrawDown: -0.87
References
- Chan2013 – Chan, Ernie. “Algorithmic Trading”, Wiley Trading, Wiley, 2013
- B32021 – B3, “Consultas – Setor de Atuação”, fetched from http://www.b3.com.br/pt_br/produtos-e-servicos/negociacao/renda-variavel/acoes/consultas/classificacao-setorial/ on May 27th, 2021
- B32021a – B3, “Índice Brasil 100 (IBrX 100 B3)”, fetched from http://www.b3.com.br/pt_br/market-data-e-indices/indices/indices-amplos/indice-brasil-100-ibrx-100-composicao-da-carteira.htm on May 27th, 2021.
To understand more about statistical arbitrage and ways to implement its strategies, here is an introductory video that explains it all!
Conclusion
In this project, we modelled one of the pairs trading strategy, specifically a Statistical Arbitrage Pair Trading strategy to Brazil’s B3 (former Bovespa) stock market exchange. We ran our strategy at two distinct time intervals. From 1-Jan-2009 to 31-Dec-2014 and from 1-Jan-2018 to 30-Apr-2021.
In order to run our strategy, we considered all sectors with 5 or more stocks. As we only have nowadays sector stock classification, the former period inherently suffered from survivorship bias.
For the most recent period, we also considered the probable lack of liquidity to short stocks and thus made a separate test with just the stocks belonging to the top 100 stocks index, IBrX100.
In all scenarios, we used last year data as the test set and the remaining data as the training set.
Results were extraordinarily good ranging from a 272% CAGR with leverage 3 to a more realistic 60% CAGR with leverage 1.
Obtained results did not consider either transaction fee or slippage costs. All calculations were done based on daily close prices.
This project shows that Quantitative Trading Strategies can be very prolific and profitable in Brazil’s stock market, mainly because potential statistical arbitrage targeted market inefficiencies seem not to have already been addressed by most traders.
File in the download:
- Statistical Arbitrage - Pair Trading In the Brazilian Stock Market - FINAL Python Notebook
Disclaimer: The information in this project is true and complete to the best of our Student’s knowledge. All recommendations are made without guarantee on the part of the student or QuantInsti®. The student and QuantInsti® disclaim any liability in connection with the use of this information. All content provided in this project is for informational purposes only and we do not guarantee that by using the guidance you will derive a certain profit.
